West Sayville: Fire Incidents, New York (NY)
Where are fire incidents reported in West Sayville, NY
Something went wrong! Please refresh the page.
|
| |||||||||||||||||||||||||||||||||||||||||||||||||||||||||||||||||||||||||||||||||||||||||||||||||||||||||||||
2002 - 2018 National Fire Incident Reporting System (NFIRS) incidents
- Incident types reported to NFIRS in West Sayville, NY
- 26927.3%False Alarm
- 17417.6%Hazardous Condition
- 17317.5%Fire
- 12813.0%Rescue & EMS
- 9910.0%Service Call
- 9910.0%Good Intent Call
- 424.3%Severe Weather
- 20.2%Special Incident
- Fire incident types reported to NFIRS in West Sayville, NY
- 7845.1%Structure Fires
- 7040.5%Outside Fires
- 1810.4%Mobile Property/Vehicle Fires
- 74.0%Other
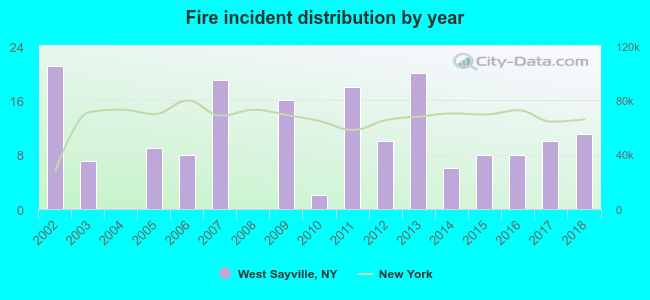 According to the data from the years 2002 - 2018 the average number of fires per year is 10. The highest number of fires - 21 took place in 2002, and the least - 0 in 2004. The data has a declining trend.
The average number of yearly fire incidents per 10k residents in West Sayville, NY compared to nearest cities:
(Note: Based on data for the last 3 years, including only cities with population 5,000 and above)
| West Sayville: | 19.3 |
| Sayville: | 13.4 |
| Oakdale: | 31.4 |
| Bohemia: | 32.1 |
| Bayport: | 7.1 |
| East Islip: | 6.9 |
| Islip Terrace: | 14.2 |
| Holbrook: | 12.7 |
| Patchogue: | 85.5 |
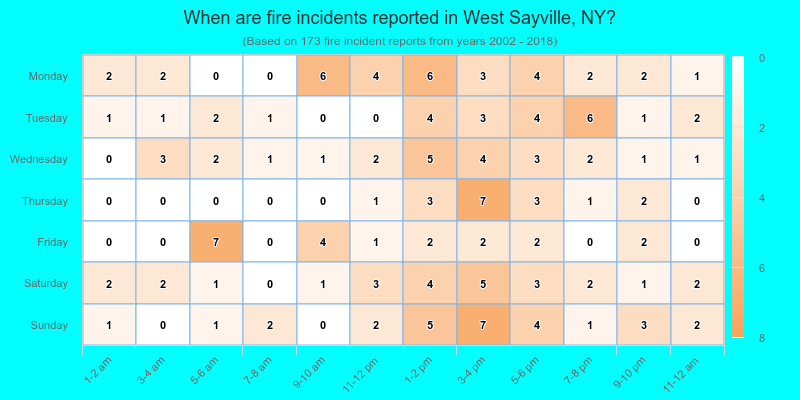
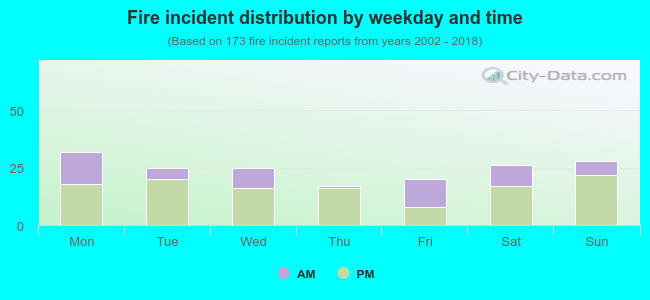 32.4% incidents where reported in the morning and 67.6% in the evening. The most fires (18.5%) took place on Monday, and the least (9.8%) on Thursday.
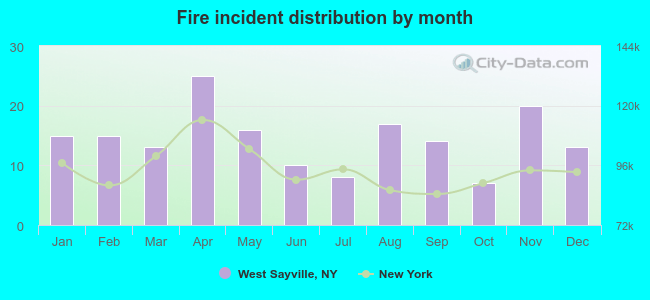 Based on the 173 reports from years 2002 - 2018 most fires (14.5%) took place during April, and the least (4.0%) in October.
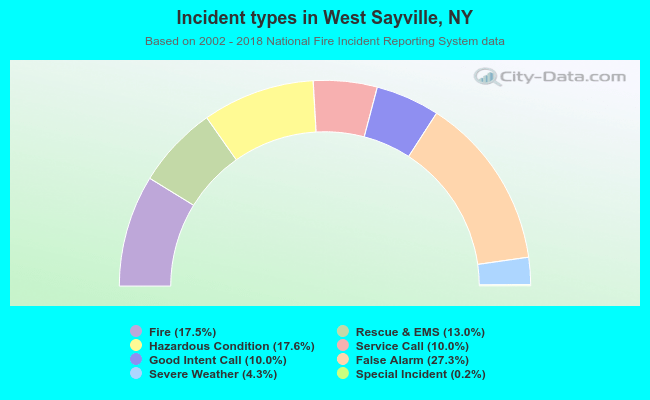 Out of all 986 cases reported during the years 2002 - 2018, the most belonged to the categories: Good Intent Call (27.3%), Rescue & EMS (17.6%), and Fire (17.5%).
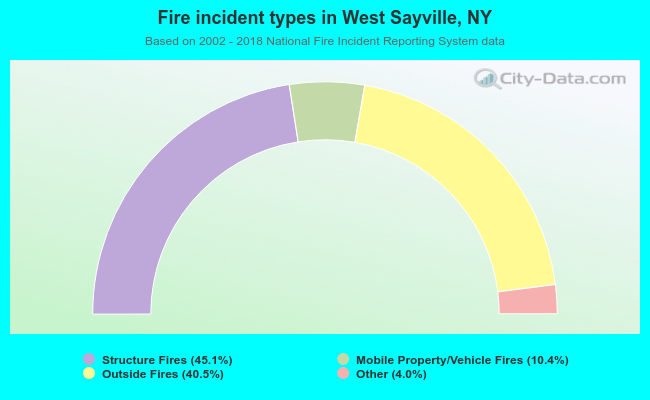 When looking into fire subcategories, the most reports belonged to: Structure Fires (45.1%), and Outside Fires (40.5%).