Weston: Fire Incidents, Wisconsin (WI)
Where are fire incidents reported in Weston, WI
Something went wrong! Please refresh the page.
|
| |||||||||||||||||||||||||||||||||||||||||||||||||||||||||||||||||||||||||||||||||||||||||||||||||||||||||||||
2004 - 2018 National Fire Incident Reporting System (NFIRS) incidents
- Incident types reported to NFIRS in Weston, WI
- 17336.8%Fire
- 7415.7%Rescue & EMS
- 6914.7%Good Intent Call
- 6914.7%False Alarm
- 6614.0%Hazardous Condition
- 173.6%Service Call
- 10.2%Overpressure Rupture
- 10.2%Special Incident
- Fire incident types reported to NFIRS in Weston, WI
- 11968.8%Structure Fires
- 2615.0%Outside Fires
- 148.1%Mobile Property/Vehicle Fires
- 148.1%Other
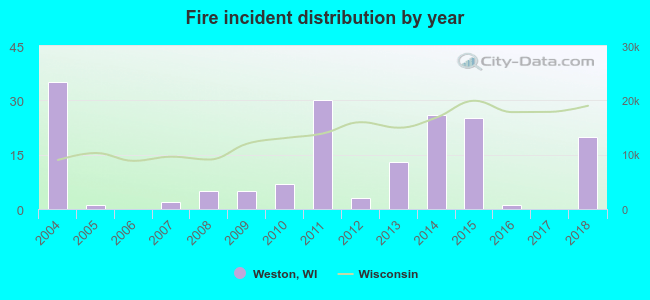 Based on the data from the years 2004 - 2018 the average number of fires per year is 12. The highest number of fire incidents - 35 took place in 2004, and the least - 0 in 2006. The data has a declining trend.
The average number of yearly fire incidents per 10k residents in Weston, WI compared to nearest cities:
(Note: Based on data for the last 3 years, including only cities with population 5,000 and above)
| Weston: | 7.0 |
| Rothschild: | 30.8 |
| Rib Mountain: | 16.5 |
| Wausau: | 29.0 |
| Kronenwetter: | 12.6 |
| Merrill: | 46.6 |
| Antigo: | 47.1 |
| Stevens Point: | 34.8 |
| Plover: | 42.7 |
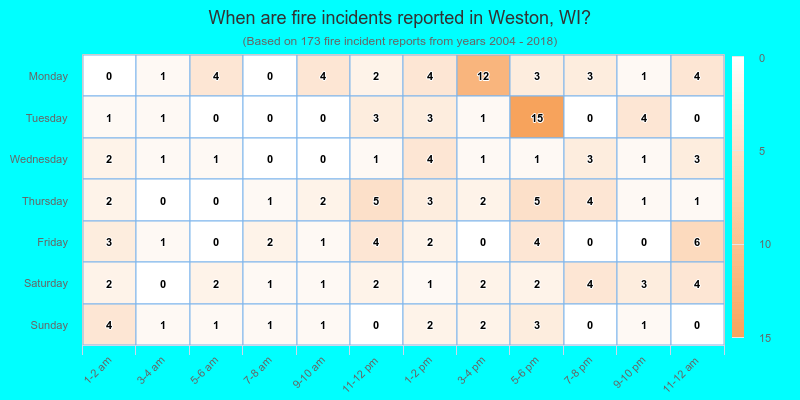
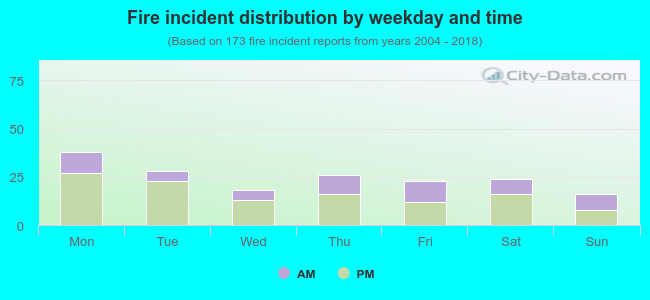 33.5% incidents where reported in the morning and 66.5% in the evening. The most fires (22.0%) took place on Monday, and the least (9.2%) on Sunday.
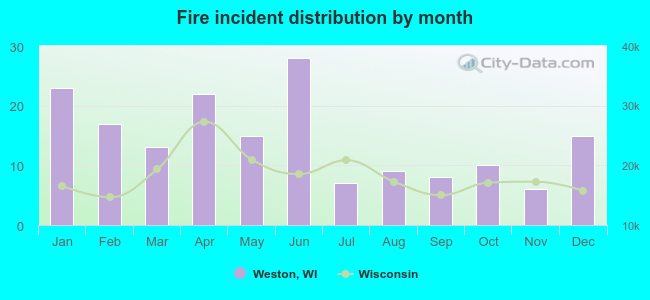 According to the 173 fire incidents from years 2004 - 2018 most fires (16.2%) took place during June, and the least (3.5%) in November.
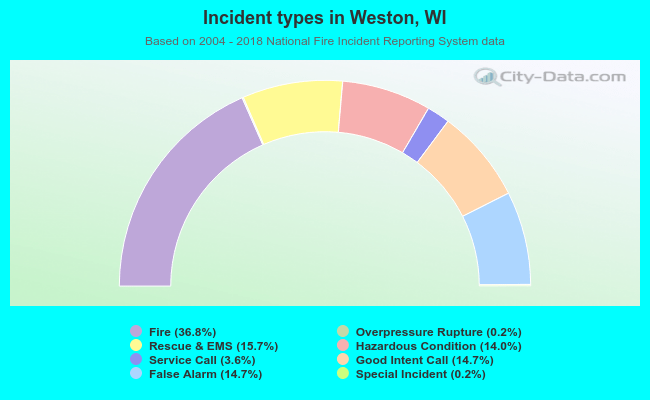 Out of all 470 cases reported during the years 2004 - 2018, the most belonged to the categories: Fire (36.8%), Rescue & EMS (15.7%), and Good Intent Call (14.7%).
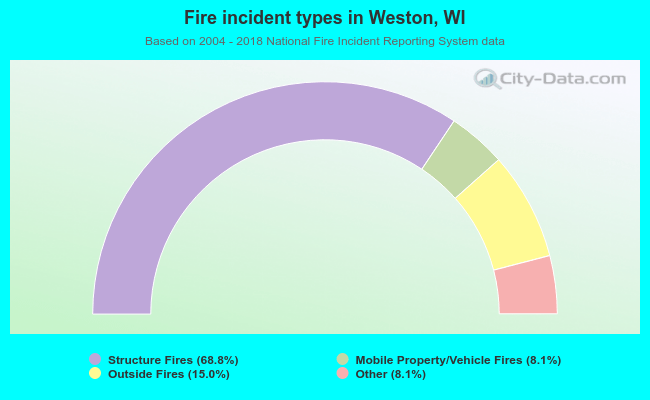 When looking into fire subcategories, the most reports belonged to: Structure Fires (68.8%), and Outside Fires (15.0%).