Wheaton: Fire Incidents, Illinois (IL)
Where are fire incidents reported in Wheaton, IL
Something went wrong! Please refresh the page.
| Fire incidents reported | |
|---|---|
| Sreet name | Count |
| ROOSEVELT RD | 88 |
| COUNTY FARM RD | 52 |
| MAIN ST | 50 |
| FRONT ST | 38 |
| LIBERTY DR | 34 |
| MAIN ST | 32 |
| LORRAINE RD | 30 |
| PRESIDENT ST | 28 |
| ROOSEVELT RD | 28 |
| COLLEGE AVE | 26 |
| NAPERVILLE RD | 26 |
| PRESIDENT ST | 26 |
| BUTTERFIELD RD | 22 |
| COLLEGE AVE | 22 |
| WEST ST | 22 |
| WHEATON CTR | 22 |
| GAMON RD | 20 |
| MANCHESTER RD | 20 |
| TARA CT | 20 |
| COUNTY FARM RD | 18 |
| EVERGREEN ST | 18 |
| LORRAINE RD | 18 |
| PERSHING AVE | 18 |
| STERLING CIR | 18 |
| WHEATON CENTER | 18 |
| BLANCHARD ST | 16 |
| CRESCENT ST | 16 |
| CROSS ST | 16 |
| DANADA SQ W | 16 |
| FALCON WAY | 16 |
| Other | 795 |
2003 - 2018 National Fire Incident Reporting System (NFIRS) incidents
- Incident types reported to NFIRS in Wheaton, IL
- 18,10862.6%Rescue & EMS
- 3,54912.3%Hazardous Condition
- 3,18211.0%False Alarm
- 1,5895.5%Fire
- 1,3384.6%Good Intent Call
- 1,1103.8%Service Call
- Fire incident types reported to NFIRS in Wheaton, IL
- 93959.1%Structure Fires
- 43327.2%Outside Fires
- 1247.8%Mobile Property/Vehicle Fires
- 935.9%Other
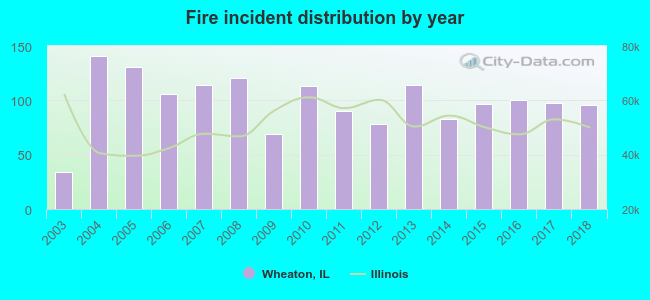 Based on the data from the years 2003 - 2018 the average number of fires per year is 99. The highest number of reported fire incidents - 141 took place in 2004, and the least - 34 in 2003. The data has an increasing trend.
The average number of yearly fire incidents per 10k residents in Wheaton, IL compared to nearest cities:
(Note: Based on data for the last 3 years, including only cities with population 5,000 and above)
| Wheaton: | 18.3 |
| Glen Ellyn: | 26.9 |
| Winfield: | 33.8 |
| Glendale Heights: | 27.1 |
| Carol Stream: | 21.1 |
| Lisle: | 29.1 |
| Warrenville: | 33.7 |
| Lombard: | 27.0 |
| West Chicago: | 40.1 |
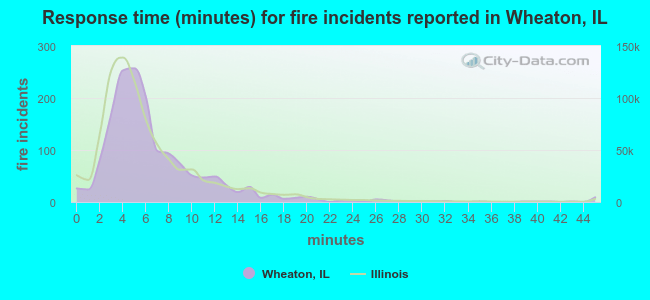 The median response time based on all reported fire incidents is 5 minutes. This is comparable to the state median value.
The median response time in Wheaton, IL compared to nearest cities:
(Note: Based on data for all years, including only cities with at least 500 fire incidents)
| Wheaton: | 5 minutes |
| Glen Ellyn: | 6 minutes |
| Winfield: | 5 minutes |
| Glendale Heights: | 5 minutes |
| Carol Stream: | 5 minutes |
| Lisle: | 5 minutes |
| Warrenville: | 5 minutes |
| Lombard: | 5 minutes |
| West Chicago: | 6 minutes |
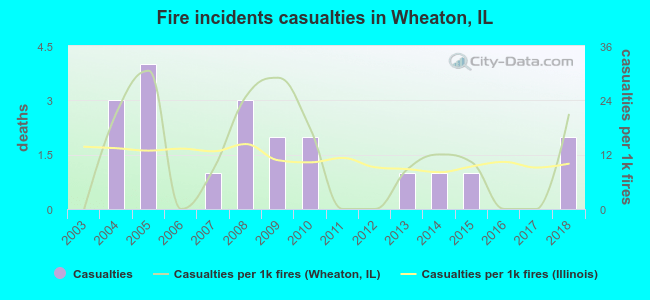 According to the data from the years 2003 - 2018 the average number of fire-related yearly casualties is 1. The highest number of reported injuries - 4 took place in 2005, and the lowest - 0 in 2003. The data has an increasing trend.
The average number of casualties per 1,000 fires is 12. This indicator was the highest - 31 in 2005, and the lowest 0 in 2003. The trend for injuries per 1,000 fire incidents is increasing. Compared to the state value the number of casualties per 1,000 fires is about the same.
According to the data from the years 2003 - 2018 the average number of fire-related yearly casualties is 1. The highest number of reported injuries - 4 took place in 2005, and the lowest - 0 in 2003. The data has an increasing trend.
The average number of casualties per 1,000 fires is 12. This indicator was the highest - 31 in 2005, and the lowest 0 in 2003. The trend for injuries per 1,000 fire incidents is increasing. Compared to the state value the number of casualties per 1,000 fires is about the same.Casualties per 1,000 incidents in Wheaton, IL compared to nearest cities:
(Note: Based on data for all years, including only cities with at least 500 fire incidents)
| Wheaton: | 12.6 |
| Glen Ellyn: | 12.2 |
| Winfield: | 3.4 |
| Glendale Heights: | 20.1 |
| Carol Stream: | 7.4 |
| Lisle: | 26.1 |
| Warrenville: | 33.4 |
| Lombard: | 13.3 |
| West Chicago: | 20.6 |
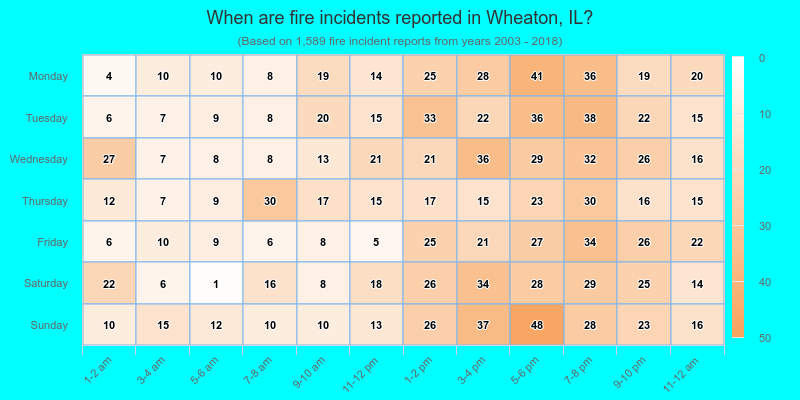
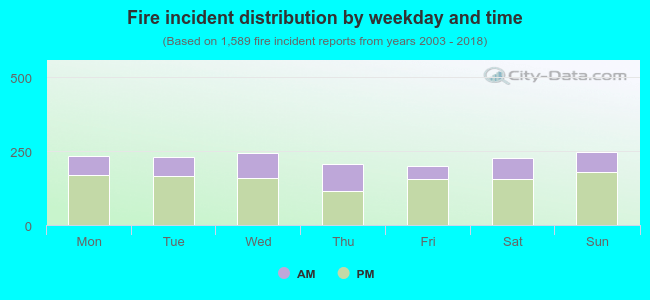 30.8% incidents where reported in the morning and 69.2% in the evening. The most fires (15.6%) took place on Sunday, and the least (12.5%) on Friday.
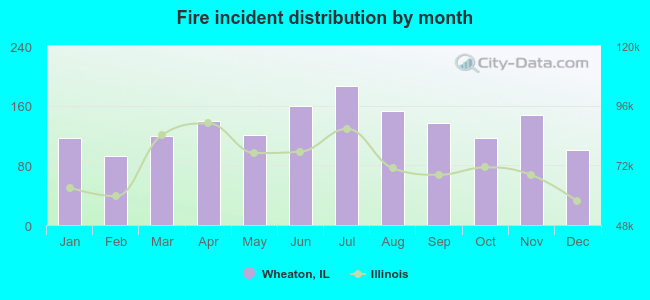 According to the 1,589 fire incidents from years 2003 - 2018 most fires (11.8%) took place during July, and the least (5.8%) in February.
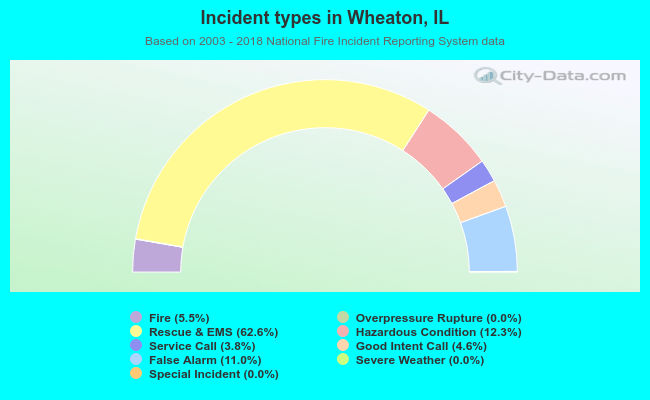 Out of all 28,913 cases reported during the years 2003 - 2018, the most belonged to the categories: Rescue & EMS (62.6%), Hazardous Condition (12.3%), and False Alarm (11.0%).
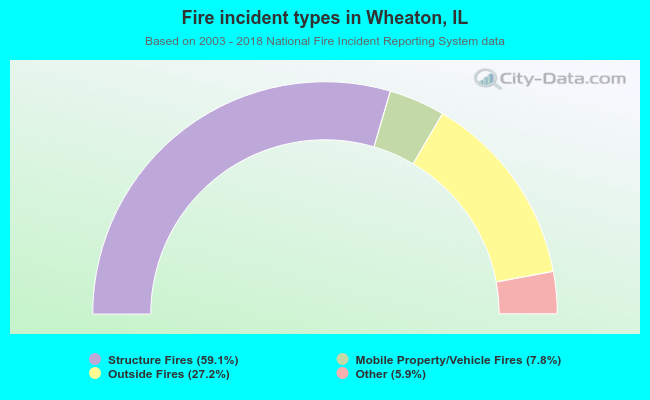 When looking into fire subcategories, the most reports belonged to: Structure Fires (59.1%), and Outside Fires (27.2%).