Whitesburg: Fire Incidents, Georgia (GA)
Where are fire incidents reported in Whitesburg, GA
Something went wrong! Please refresh the page.
|
| |||||||||||||||||||||||||||||||||||||||||||||||||||||||||||||||||||||||||||||||||||||||||||||||||||||||||||||
2003 - 2018 National Fire Incident Reporting System (NFIRS) incidents
- Incident types reported to NFIRS in Whitesburg, GA
- 1,16448.6%Rescue & EMS
- 48220.1%Fire
- 27711.6%Service Call
- 2289.5%Hazardous Condition
- 1687.0%Good Intent Call
- 411.7%False Alarm
- 241.0%Severe Weather
- 50.2%Special Incident
- 40.2%Overpressure Rupture
- Fire incident types reported to NFIRS in Whitesburg, GA
- 26154.1%Outside Fires
- 13628.2%Structure Fires
- 8517.6%Mobile Property/Vehicle Fires
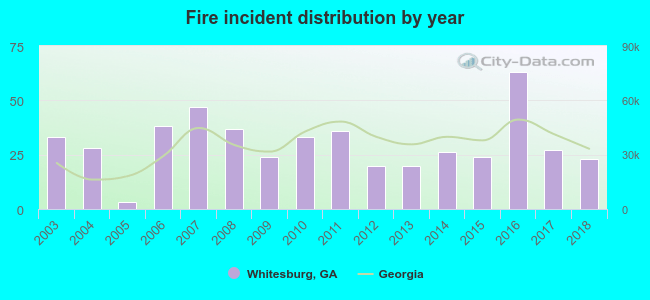 Based on the data from the years 2003 - 2018 the average number of fire incidents per year is 30. The highest number of fires - 63 took place in 2016, and the least - 3 in 2005. The data has a declining trend.
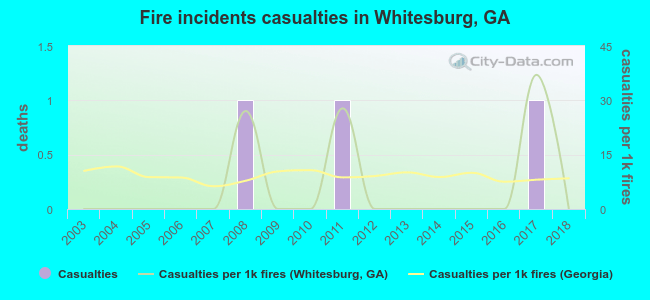 According to the data from the years 2003 - 2018 the average number of fire-related yearly casualties is 0. The highest number of injuries - 1 took place in 2008, and the lowest - 0 in 2003. The data has a constant trend.
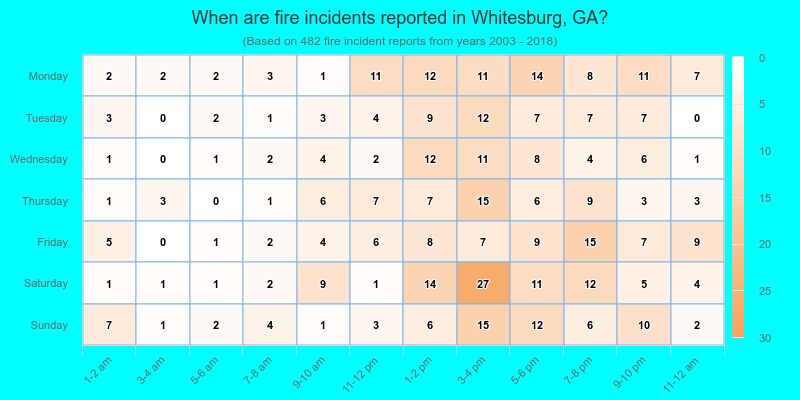
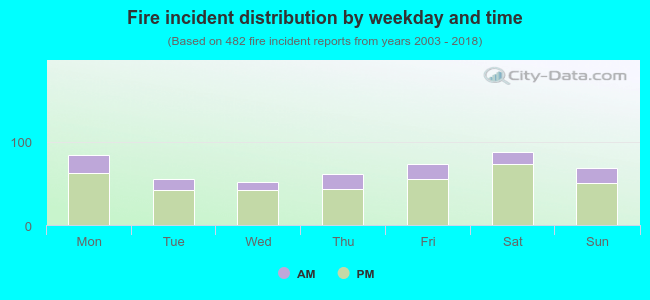 23.4% incidents where reported in the morning and 76.6% in the evening. The most fires (18.3%) took place on Saturday, and the least (10.8%) on Wednesday.
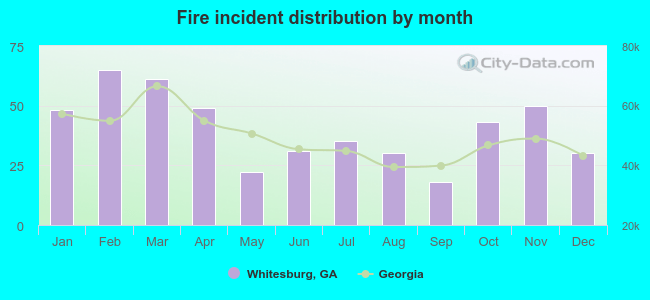 According to the 482 incident reports from years 2003 - 2018 most fires (13.5%) took place during February, and the least (3.7%) in September.
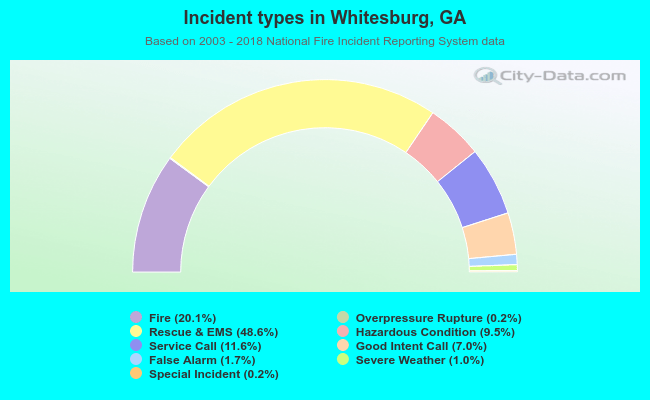 Out of all 2,393 cases reported during the years 2003 - 2018, the most belonged to the categories: Rescue & EMS (48.6%), Fire (20.1%), and Service Call (11.6%).
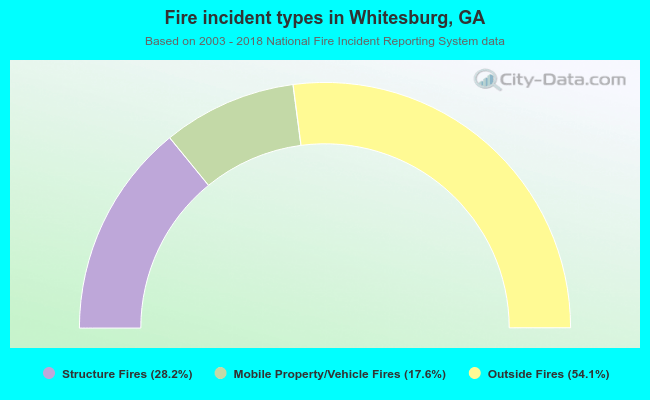 When looking into fire subcategories, the most incidents belonged to: Outside Fires (54.1%), and Structure Fires (28.2%).