Wild Rose: Fire Incidents, Wisconsin (WI)
Where are fire incidents reported in Wild Rose, WI
Something went wrong! Please refresh the page.
|
| |||||||||||||||||||||||||||||||||||||||||||||||||||||||||||||||||||||||||||||||||||||||||||||||||||||||||||||
| Other | 20 | |||||||||||||||||||||||||||||||||||||||||||||||||||||||||||||||||||||||||||||||||||||||||||||||||||||||||||||
2003 - 2018 National Fire Incident Reporting System (NFIRS) incidents
- Incident types reported to NFIRS in Wild Rose, WI
- 69863.7%Rescue & EMS
- 18416.8%Fire
- 12811.7%Hazardous Condition
- 302.7%False Alarm
- 272.5%Good Intent Call
- 201.8%Service Call
- 60.5%Severe Weather
- 20.2%Special Incident
- Fire incident types reported to NFIRS in Wild Rose, WI
- 8244.6%Structure Fires
- 6133.2%Outside Fires
- 2312.5%Other
- 189.8%Mobile Property/Vehicle Fires
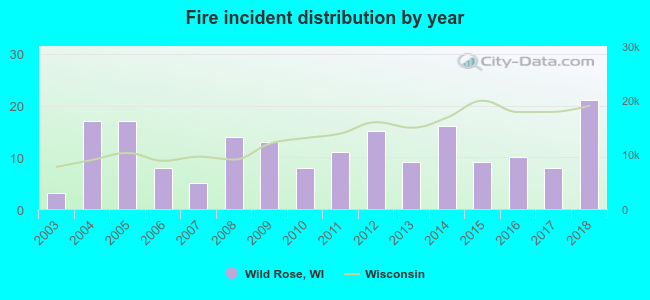 Based on the data from the years 2003 - 2018 the average number of fires per year is 12. The highest number of fire incidents - 21 took place in 2018, and the least - 3 in 2003. The data has a rising trend.
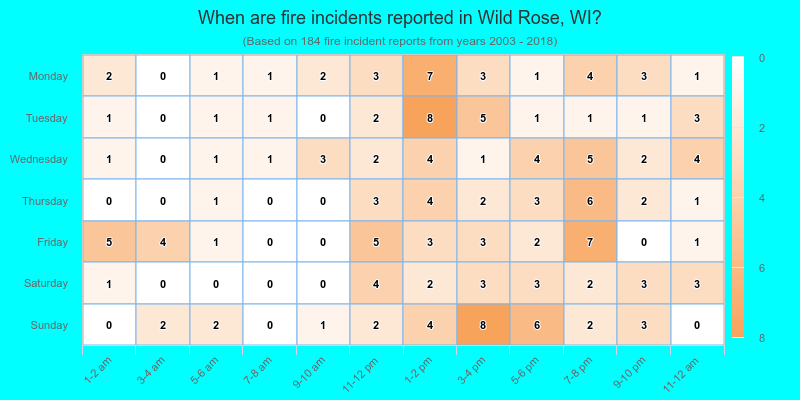
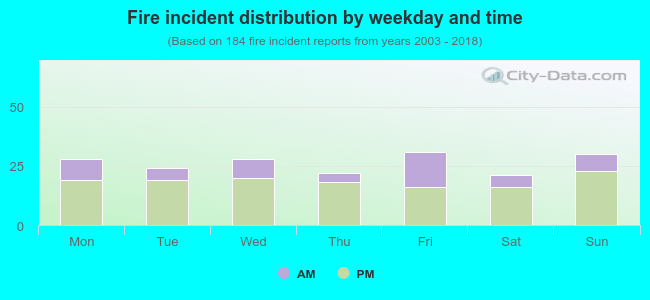 28.8% incidents where reported in the morning and 71.2% in the evening. The most fires (16.8%) took place on Friday, and the least (11.4%) on Saturday.
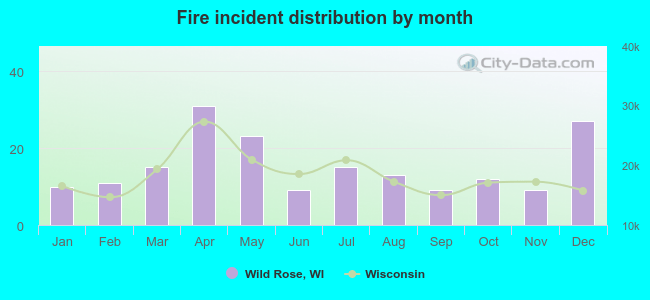 According to the 184 fire incidents from years 2003 - 2018 most fires (16.8%) took place during April, and the least (4.9%) in June.
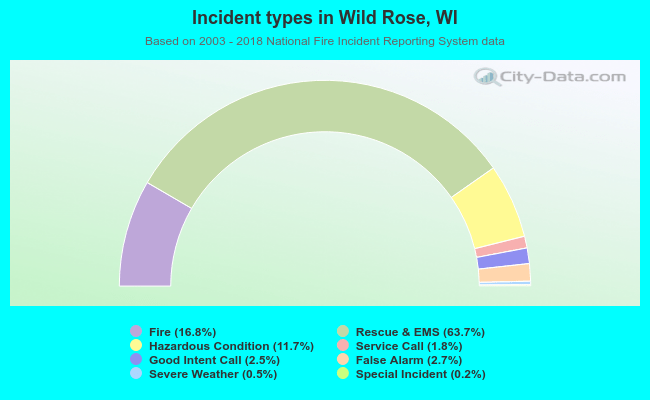 Out of all 1,095 cases reported during the years 2003 - 2018, the most belonged to the categories: Overpressure Rupture (63.7%), Fire (16.8%), and Rescue & EMS (11.7%).
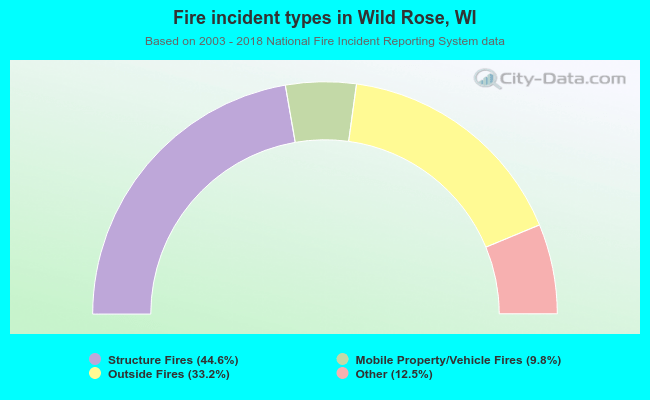 When looking into fire subcategories, the most reports belonged to: Structure Fires (44.6%), and Outside Fires (33.2%).