Wilton Manors: Fire Incidents, Florida (FL)
Where are fire incidents reported in Wilton Manors, FL
Something went wrong! Please refresh the page.
|
| |||||||||||||||||||||||||||||||||||||||||||||||||||||||||||||||||||||||||||||||||||||||||||||||||||||||||||||
2002 - 2018 National Fire Incident Reporting System (NFIRS) incidents
- Incident types reported to NFIRS in Wilton Manors, FL
- 8,07069.6%Rescue & EMS
- 9728.4%Good Intent Call
- 9047.8%Service Call
- 7696.6%False Alarm
- 5164.5%Hazardous Condition
- 3292.8%Fire
- 240.2%Special Incident
- Fire incident types reported to NFIRS in Wilton Manors, FL
- 13340.4%Structure Fires
- 11133.7%Outside Fires
- 4513.7%Other
- 4012.2%Mobile Property/Vehicle Fires
 Based on the data from the years 2002 - 2018 the average number of fires per year is 19. The highest number of fire incidents - 40 took place in 2016, and the least - 0 in 2003. The data has a growing trend.
The average number of yearly fire incidents per 10k residents in Wilton Manors, FL compared to nearest cities:
(Note: Based on data for the last 3 years, including only cities with population 5,000 and above)
| Wilton Manors: | 22.3 |
| Oakland Park: | 32.1 |
| Fort Lauderdale: | 31.2 |
| Lauderdale Lakes: | 22.5 |
| Pompano Beach: | 20.2 |
| Lauderhill: | 24.5 |
| North Lauderdale: | 19.9 |
| Dania Beach: | 0.5 |
| Plantation: | 10.4 |
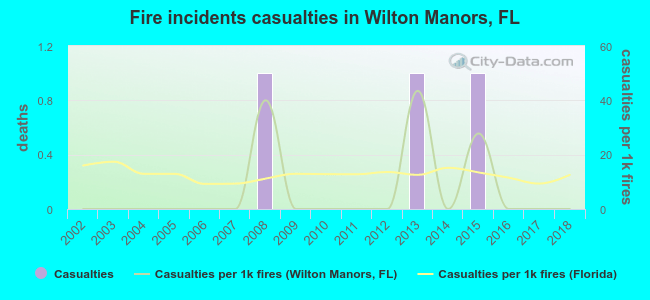 Based on the data from the years 2002 - 2018 the average number of fire-related casualties per year is 0. The highest number of reported injuries - 1 took place in 2008, and the lowest - 0 in 2002. The data has a constant trend.
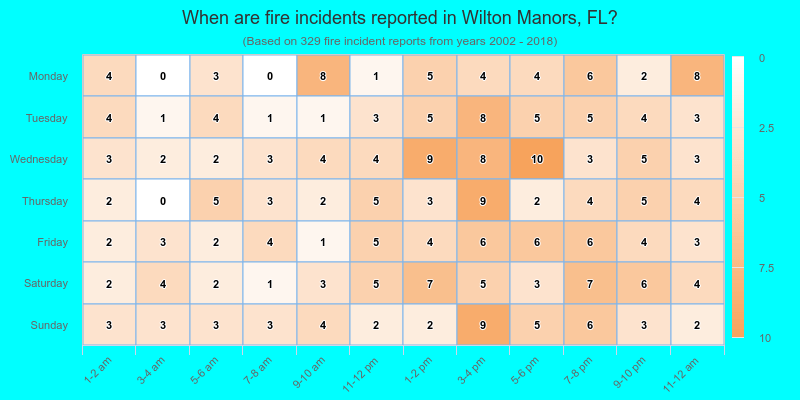
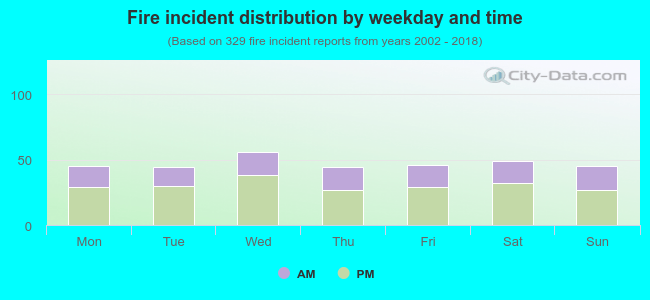 35.6% incidents where reported in the morning and 64.4% in the evening. The most fires (17.0%) took place on Wednesday, and the least (13.4%) on Tuesday.
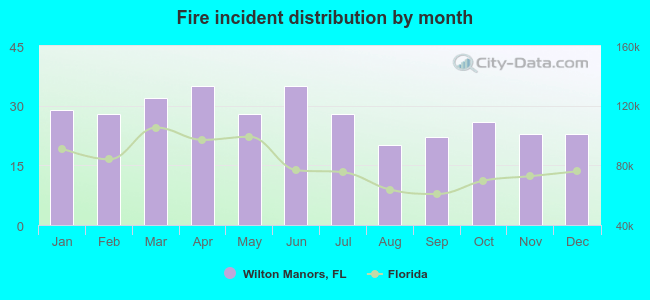 According to the 329 incident reports from years 2002 - 2018 most fires (10.6%) took place during April, and the least (6.1%) in August.
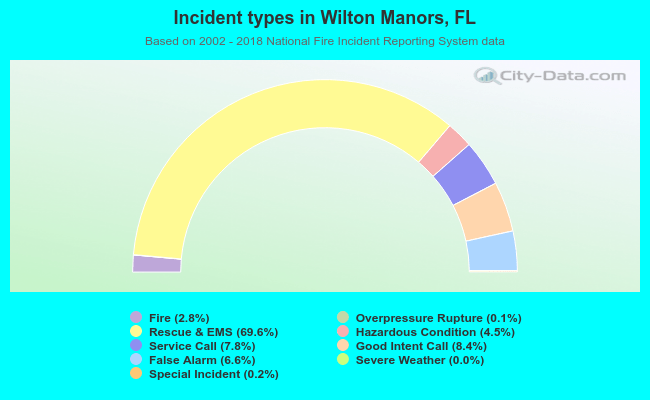 Out of all 11,591 cases reported during the years 2002 - 2018, the most belonged to the categories: Rescue & EMS (69.6%), Good Intent Call (8.4%), and Service Call (7.8%).
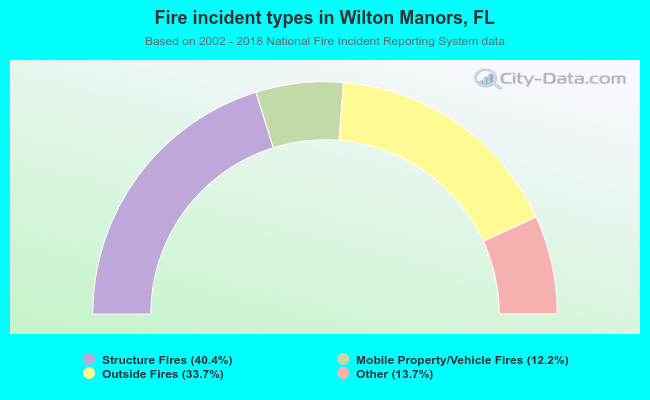 When looking into fire subcategories, the most reports belonged to: Structure Fires (40.4%), and Outside Fires (33.7%).