Winslow: Fire Incidents, Arizona (AZ)
Where are fire incidents reported in Winslow, AZ
Something went wrong! Please refresh the page.
|
| |||||||||||||||||||||||||||||||||||||||||||||||||||||||||||||||||||||||||||||||||||||||||||||||||||||||||||||
2006 - 2018 National Fire Incident Reporting System (NFIRS) incidents
- Incident types reported to NFIRS in Winslow, AZ
- 40158.7%Fire
- 11817.3%Hazardous Condition
- 10615.5%Good Intent Call
- 223.2%False Alarm
- 202.9%Rescue & EMS
- 101.5%Service Call
- 30.4%Overpressure Rupture
- 30.4%Special Incident
- Fire incident types reported to NFIRS in Winslow, AZ
- 17944.6%Outside Fires
- 11027.4%Structure Fires
- 8320.7%Mobile Property/Vehicle Fires
- 297.2%Other
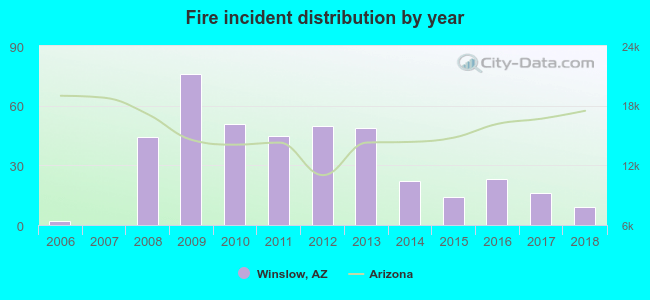 Based on the data from the years 2006 - 2018 the average number of fires per year is 31. The highest number of reported fires - 76 took place in 2009, and the least - 0 in 2007. The data has a growing trend.
The average number of yearly fire incidents per 10k residents in Winslow, AZ compared to nearest cities:
(Note: Based on data for the last 3 years, including only cities with population 5,000 and above)
| Winslow: | 16.7 |
| Holbrook: | 10.0 |
| Coconino: | 0.1 |
| Snowflake: | 65.6 |
| Flagstaff: | 34.7 |
| Sedona: | 64.8 |
| Payson: | 31.9 |
| Show Low: | 25.5 |
| Camp Verde: | 21.0 |
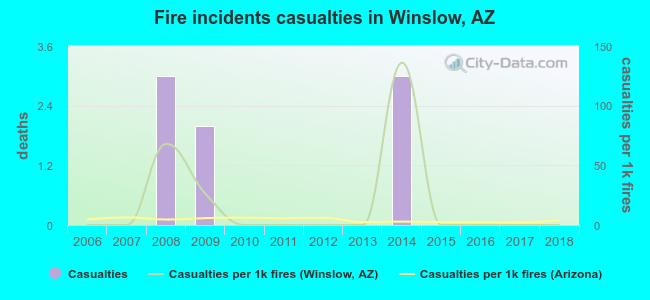 Based on the reports from the years 2006 - 2018 the average number of fire-related casualties per year is 1. The highest number of reported injuries - 3 took place in 2008, and the lowest - 0 in 2006. The data has a constant trend.
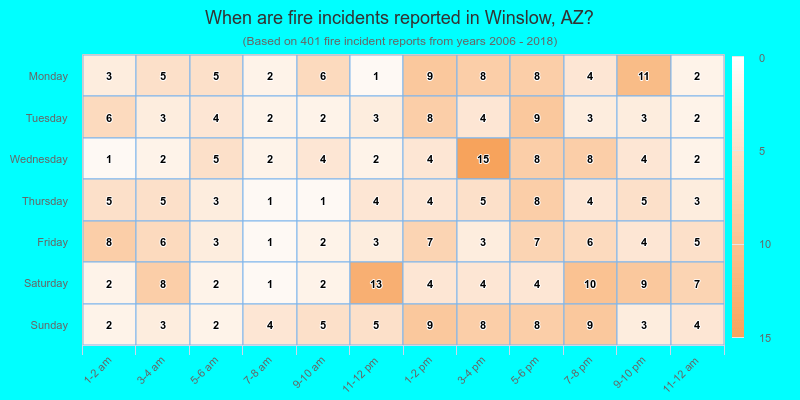
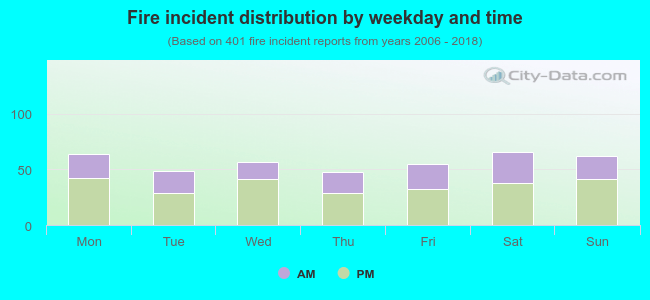 37.2% incidents where reported in the morning and 62.8% in the evening. The most fires (16.5%) took place on Saturday, and the least (12.0%) on Thursday.
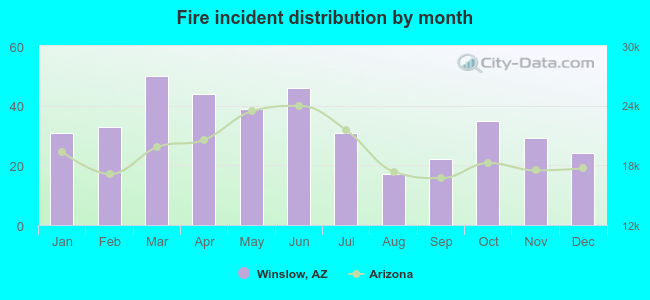 Based on the 401 reports from years 2006 - 2018 most fires (12.5%) took place during March, and the least (4.2%) in August.
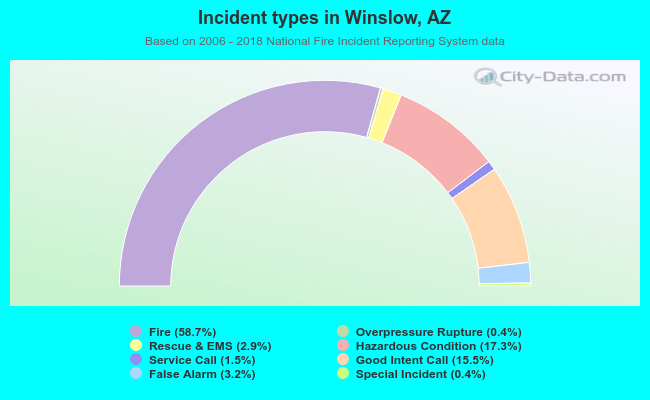 Out of all 683 cases reported during the years 2006 - 2018, the most belonged to the categories: Fire (58.7%), Hazardous Condition (17.3%), and Good Intent Call (15.5%).
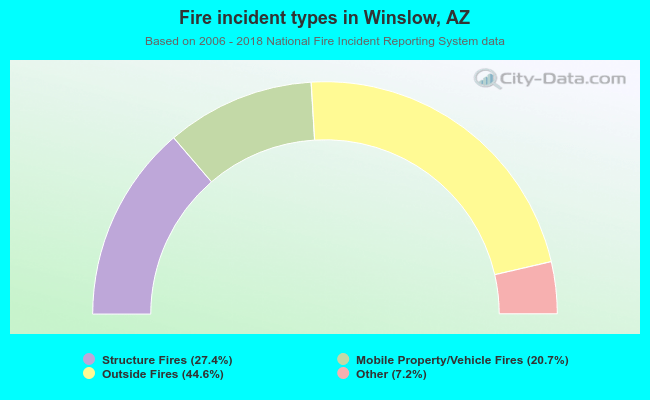 When looking into fire subcategories, the most reports belonged to: Outside Fires (44.6%), and Structure Fires (27.4%).