Winterville: Fire Incidents, Georgia (GA)
Where are fire incidents reported in Winterville, GA
Something went wrong! Please refresh the page.
|
| |||||||||||||||||||||||||||||||||||||||||||||||||||||||||||||||||||||||||||||||||||||||||||||||||||||||||||||
2003 - 2018 National Fire Incident Reporting System (NFIRS) incidents
- Incident types reported to NFIRS in Winterville, GA
- 27932.0%Fire
- 23226.6%Rescue & EMS
- 17219.7%Hazardous Condition
- 869.9%Good Intent Call
- 566.4%Service Call
- 384.4%False Alarm
- 60.7%Overpressure Rupture
- 20.2%Severe Weather
- 10.1%Special Incident
- Fire incident types reported to NFIRS in Winterville, GA
- 11541.2%Structure Fires
- 10537.6%Outside Fires
- 5519.7%Mobile Property/Vehicle Fires
- 41.4%Other
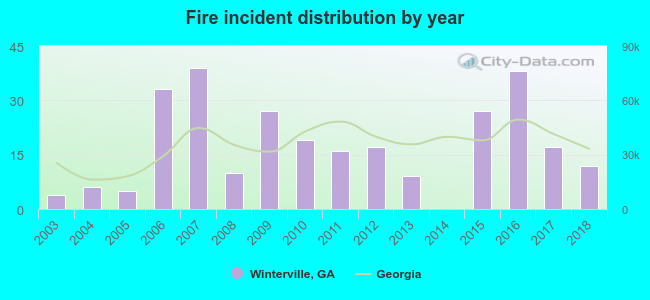 According to the data from the years 2003 - 2018 the average number of fire incidents per year is 17. The highest number of reported fire incidents - 39 took place in 2007, and the least - 0 in 2014. The data has a rising trend.
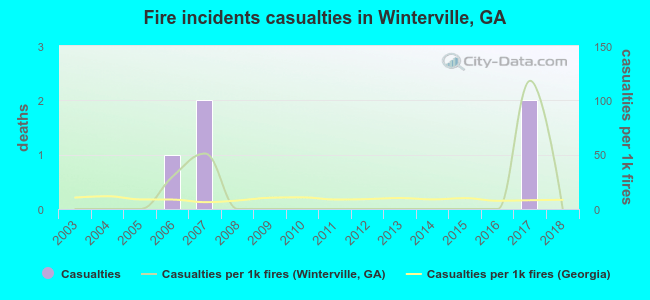 Based on the data from the years 2003 - 2018 the average number of fire-related yearly casualties is 0. The highest number of reported injuries - 2 took place in 2007, and the lowest - 0 in 2003. The data has a constant trend.
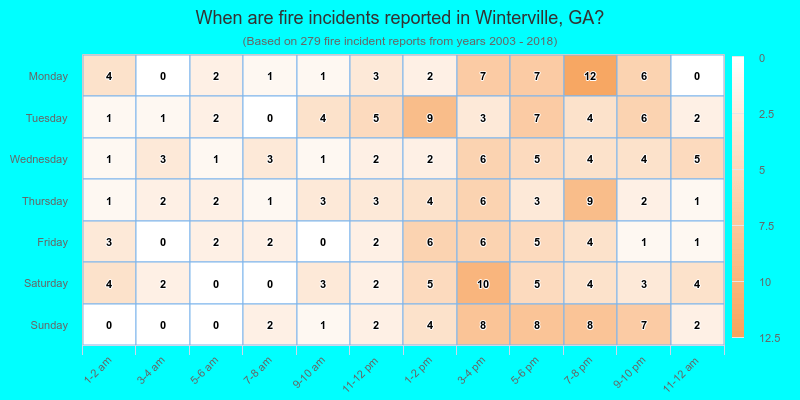
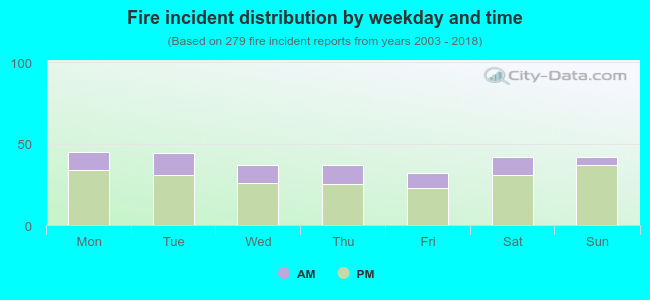 25.8% incidents where reported in the morning and 74.2% in the evening. The most fires (16.1%) took place on Monday, and the least (11.5%) on Friday.
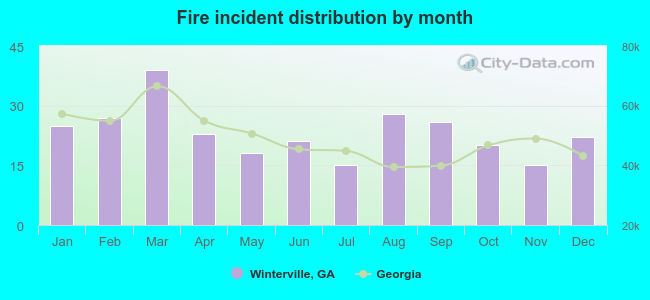 According to the 279 reports from years 2003 - 2018 most fires (14.0%) took place during March, and the least (5.4%) in July.
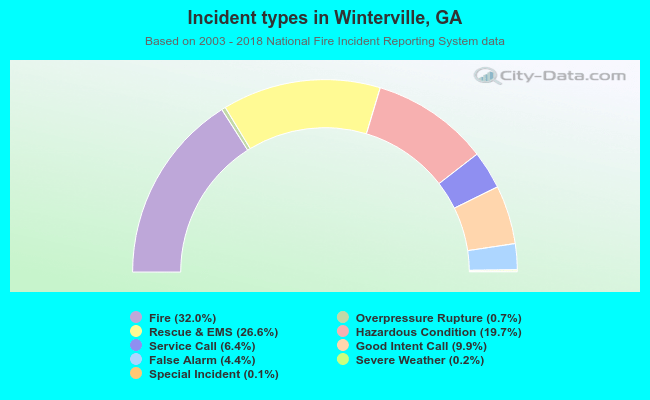 Out of all 872 cases reported during the years 2003 - 2018, the most belonged to the categories: Fire (32.0%), Rescue & EMS (26.6%), and Hazardous Condition (19.7%).
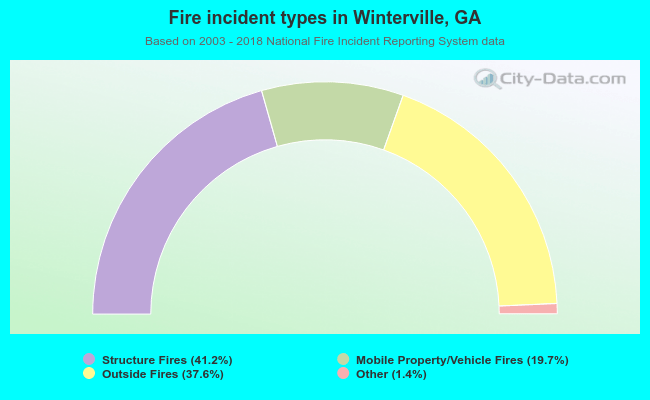 When looking into fire subcategories, the most incidents belonged to: Structure Fires (41.2%), and Outside Fires (37.6%).