Woodbine: Fire Incidents, Georgia (GA)
Where are fire incidents reported in Woodbine, GA
Something went wrong! Please refresh the page.
|
| |||||||||||||||||||||||||||||||||||||||||||||||||||||||||||||||||||||||||||||||||||||||||||||||||||||||||||||
| Other | 73 | |||||||||||||||||||||||||||||||||||||||||||||||||||||||||||||||||||||||||||||||||||||||||||||||||||||||||||||
2002 - 2018 National Fire Incident Reporting System (NFIRS) incidents
- Incident types reported to NFIRS in Woodbine, GA
- 2,86962.6%Rescue & EMS
- 66714.6%Fire
- 3698.1%Good Intent Call
- 3207.0%Hazardous Condition
- 1783.9%Service Call
- 1553.4%False Alarm
- 90.2%Severe Weather
- 80.2%Special Incident
- 50.1%Overpressure Rupture
- Fire incident types reported to NFIRS in Woodbine, GA
- 29343.9%Outside Fires
- 18828.2%Mobile Property/Vehicle Fires
- 17325.9%Structure Fires
- 131.9%Other
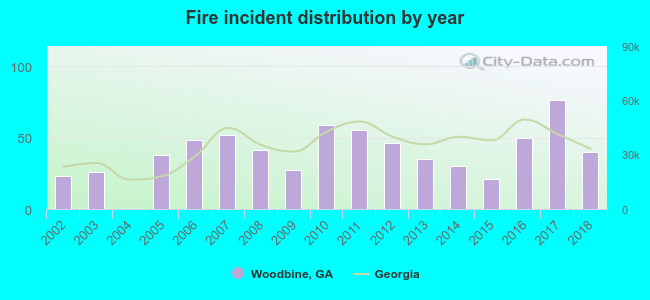 According to the data from the years 2002 - 2018 the average number of fire incidents per year is 39. The highest number of reported fire incidents - 76 took place in 2017, and the least - 0 in 2004. The data has a rising trend.
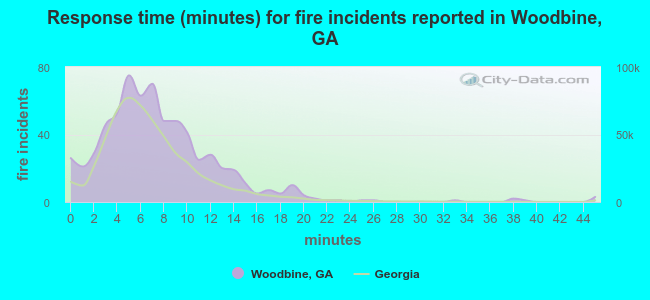 The median response time based on all reported fire incidents is 7 minutes. This is comparable to the state median value.
The median response time in Woodbine, GA compared to nearest cities:
(Note: Based on data for all years, including only cities with at least 500 fire incidents)
| Woodbine: | 7 minutes |
| Kingsland: | 5 minutes |
| St. Marys: | 5 minutes |
| Folkston: | 9 minutes |
| Brunswick: | 5 minutes |
| Hilliard: | 12 minutes |
| Yulee: | 9 minutes |
| Fernandina Beach: | 6 minutes |
| Callahan: | 9 minutes |
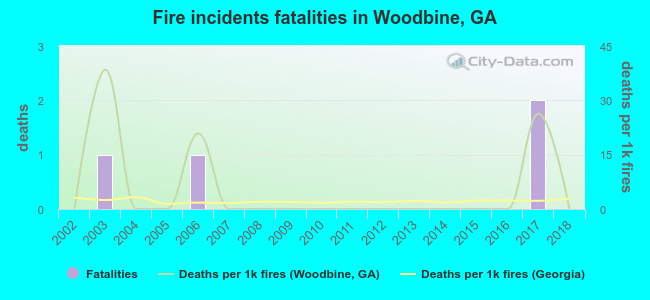 According to the data from the years 2002 - 2018 the average number of fire-related fatalities per year is 0. The highest number of reported deaths - 2 took place in 2017, and the lowest - 0 in 2002. The data has a constant trend.
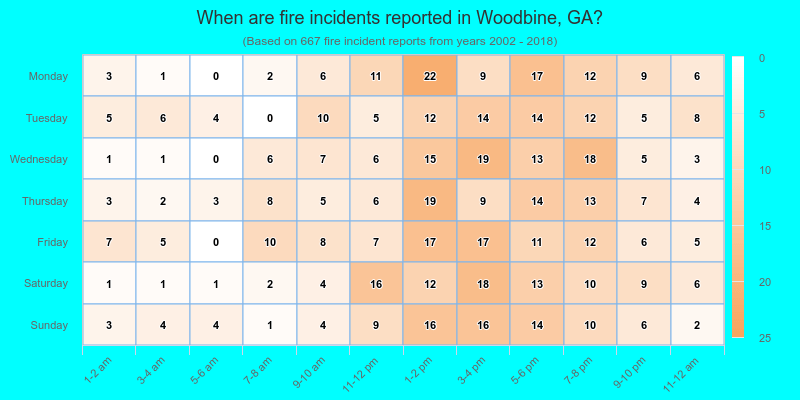
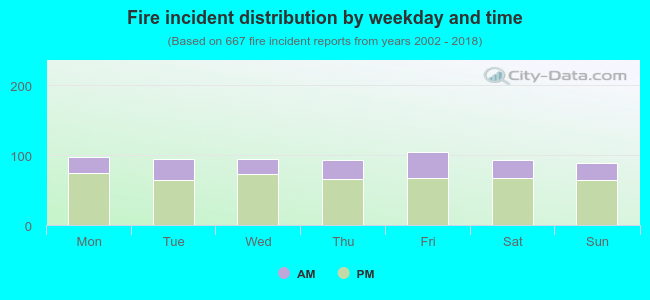 28.2% incidents where reported in the morning and 71.8% in the evening. The most fires (15.7%) took place on Friday, and the least (13.3%) on Sunday.
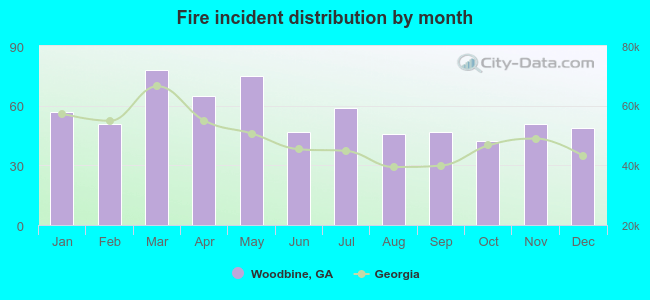 According to the 667 fires from years 2002 - 2018 most fires (11.7%) took place during March, and the least (6.3%) in October.
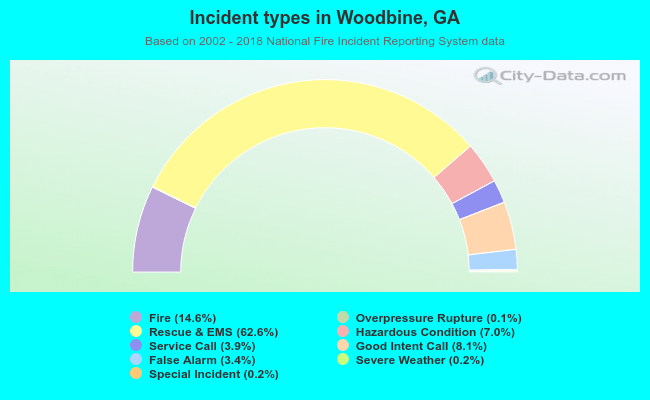 Out of all 4,580 cases reported during the years 2002 - 2018, the most belonged to the categories: Rescue & EMS (62.6%), Fire (14.6%), and Good Intent Call (8.1%).
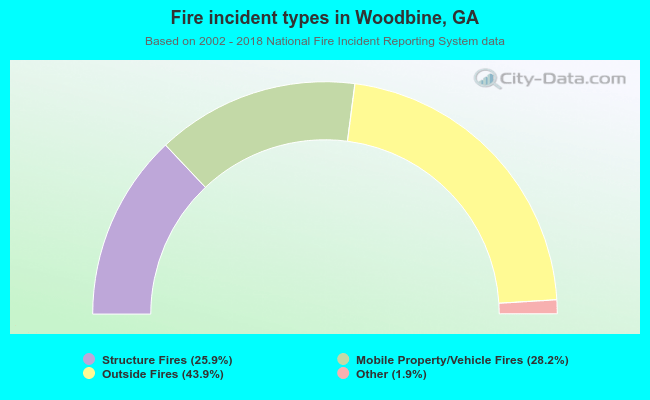 When looking into fire subcategories, the most reports belonged to: Outside Fires (43.9%), and Mobile Property/Vehicle Fires (28.2%).