Woodcliff Lake: Fire Incidents, New Jersey (NJ)
Where are fire incidents reported in Woodcliff Lake, NJ
Something went wrong! Please refresh the page.
|
| |||||||||||||||||||||||||||||||||||||||||||||||||||||||||||||||||||||||||||||||||||||||||||||||||||||||||||||
2004 - 2018 National Fire Incident Reporting System (NFIRS) incidents
- Incident types reported to NFIRS in Woodcliff Lake, NJ
- 37736.4%Hazardous Condition
- 37135.8%False Alarm
- 19819.1%Fire
- 373.6%Good Intent Call
- 282.7%Rescue & EMS
- 181.7%Service Call
- 50.5%Overpressure Rupture
- Fire incident types reported to NFIRS in Woodcliff Lake, NJ
- 7738.9%Structure Fires
- 6231.3%Other
- 3015.2%Mobile Property/Vehicle Fires
- 2914.6%Outside Fires
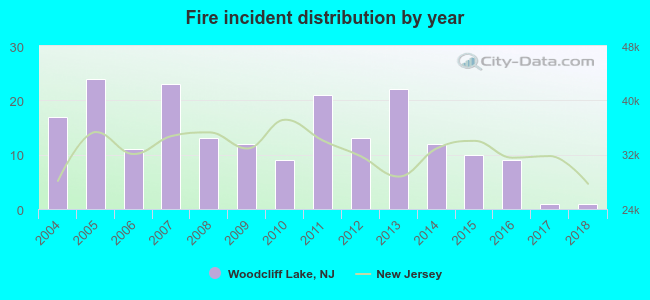 Based on the data from the years 2004 - 2018 the average number of fires per year is 13. The highest number of reported fire incidents - 24 took place in 2005, and the least - 1 in 2017. The data has a dropping trend.
The average number of yearly fire incidents per 10k residents in Woodcliff Lake, NJ compared to nearest cities:
(Note: Based on data for the last 3 years, including only cities with population 5,000 and above)
| Woodcliff Lake: | 6.2 |
| Park Ridge: | 11.3 |
| Hillsdale: | 21.9 |
| Montvale: | 9.2 |
| Washington Township: | 10.8 |
| River Vale: | 13.4 |
| Westwood: | 7.2 |
| Waldwick: | 16.8 |
| Upper Saddle River: | 16.0 |
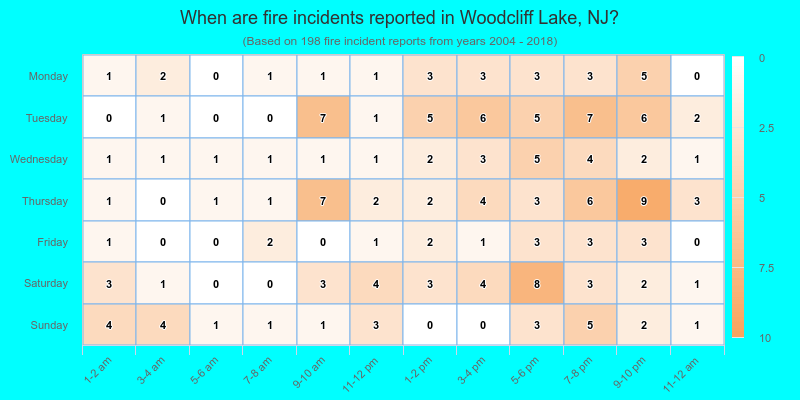
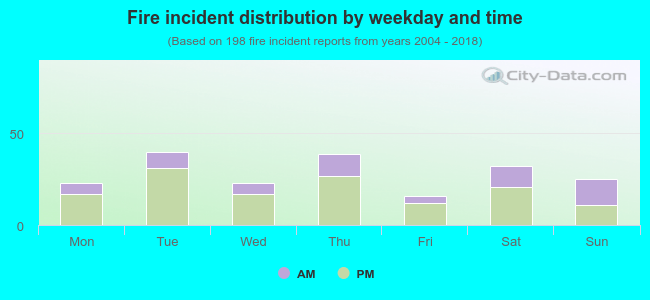 31.3% incidents where reported in the morning and 68.7% in the evening. The most fires (20.2%) took place on Tuesday, and the least (8.1%) on Friday.
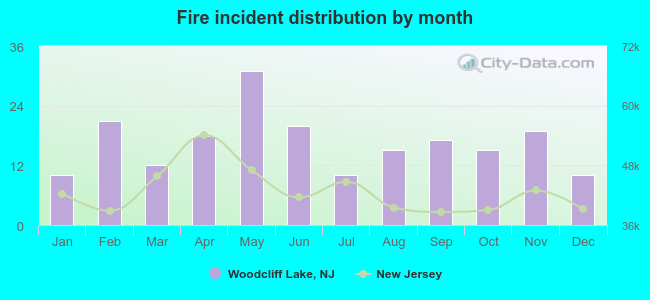 According to the 198 fire incident reports from years 2004 - 2018 most fires (15.7%) took place during May, and the least (5.1%) in January.
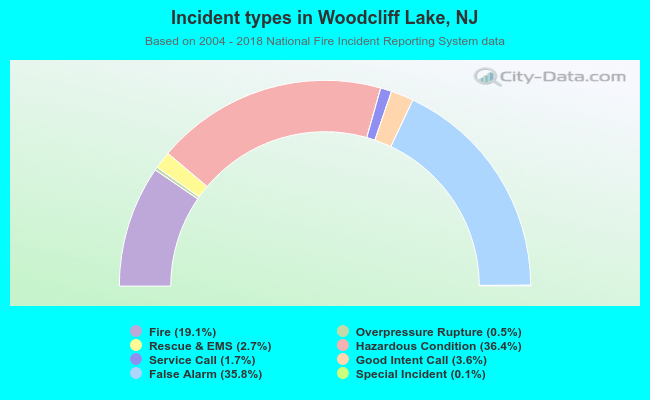 Out of all 1,035 cases reported during the years 2004 - 2018, the most belonged to the categories: Hazardous Condition (36.4%), False Alarm (35.8%), and Fire (19.1%).
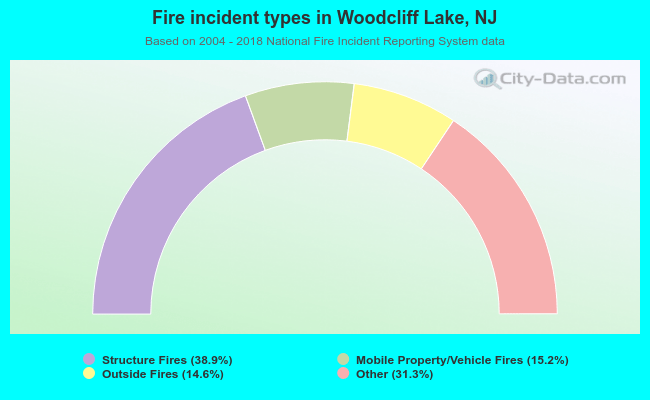 When looking into fire subcategories, the most incidents belonged to: Structure Fires (38.9%), and Other (31.3%).