Woodland Park: Fire Incidents, New Jersey (NJ)
Where are fire incidents reported in Woodland Park, NJ
Something went wrong! Please refresh the page.
|
| |||||||||||||||||||||||||||||||||||||||||||||||||||||||||||||||||||||||||||||||||||||||||||||||||||||||||||||
2010 - 2018 National Fire Incident Reporting System (NFIRS) incidents
- Incident types reported to NFIRS in Woodland Park, NJ
- 52129.4%Hazardous Condition
- 51128.9%False Alarm
- 40322.8%Fire
- 1317.4%Good Intent Call
- 1126.3%Service Call
- 784.4%Rescue & EMS
- 90.5%Overpressure Rupture
- 30.2%Severe Weather
- 20.1%Special Incident
- Fire incident types reported to NFIRS in Woodland Park, NJ
- 22656.1%Structure Fires
- 8721.6%Outside Fires
- 7919.6%Mobile Property/Vehicle Fires
- 112.7%Other
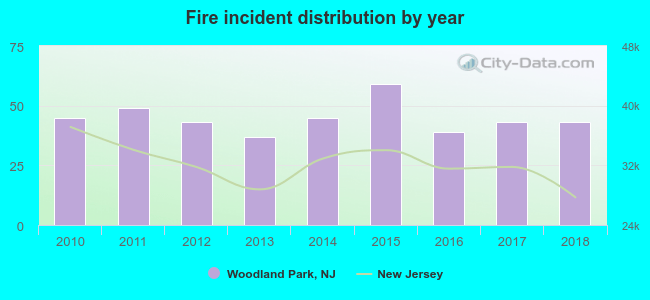 Based on the data from the years 2010 - 2018 the average number of fires per year is 45. The highest number of reported fire incidents - 59 took place in 2015, and the least - 37 in 2013. The data has a dropping trend.
The average number of yearly fire incidents per 10k residents in Woodland Park, NJ compared to nearest cities:
(Note: Based on data for the last 3 years, including only cities with population 5,000 and above)
| Woodland Park: | 33.6 |
| New Providence: | 16.9 |
| Summit: | 46.5 |
| Mountainside: | 19.0 |
| Chatham: | 42.1 |
| Springfield: | 44.0 |
| Berkeley Heights: | 30.8 |
| Millburn: | 10.6 |
| Westfield: | 18.3 |
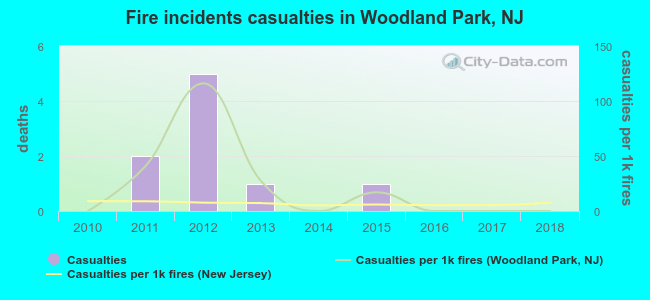 According to the data from the years 2010 - 2018 the average number of fire-related casualties per year is 1. The highest number of casualties - 5 took place in 2012, and the lowest - 0 in 2010. The data has a constant trend.
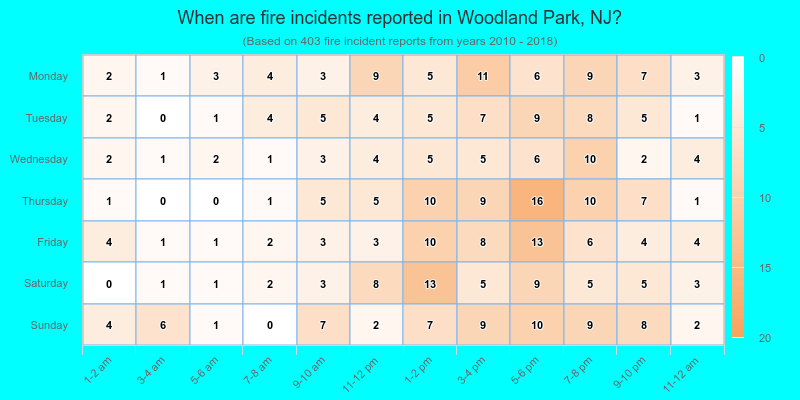
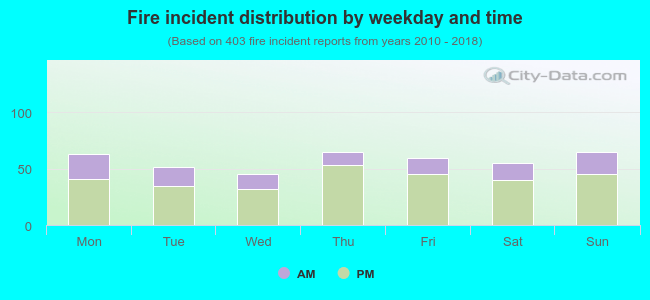 27.8% incidents where reported in the morning and 72.2% in the evening. The most fires (16.1%) took place on Thursday, and the least (11.2%) on Wednesday.
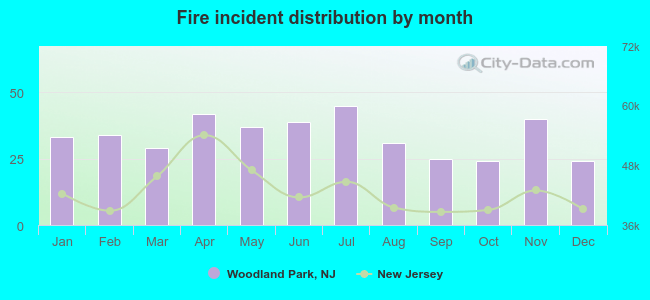 According to the 403 fire incidents from years 2010 - 2018 most fires (11.2%) took place during July, and the least (6.0%) in October.
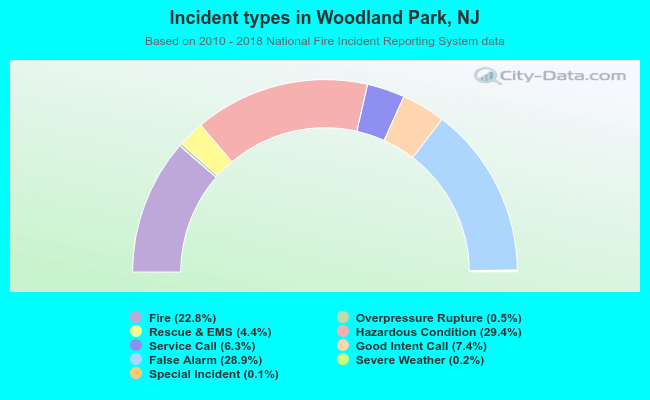 Out of all 1,770 cases reported during the years 2010 - 2018, the most belonged to the categories: Hazardous Condition (29.4%), False Alarm (28.9%), and Fire (22.8%).
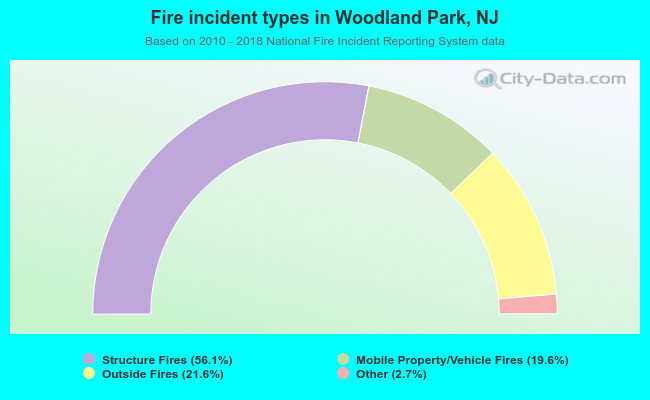 When looking into fire subcategories, the most incidents belonged to: Structure Fires (56.1%), and Outside Fires (21.6%).