Worcester: Fire Incidents, New York (NY)
Where are fire incidents reported in Worcester, NY
Something went wrong! Please refresh the page.
|
| |||||||||||||||||||||||||||||||||||||||||||||||||||||||||||||||||||||||||||||||||||||||||||||||||||||||||||||
2002 - 2018 National Fire Incident Reporting System (NFIRS) incidents
- Incident types reported to NFIRS in Worcester, NY
- 73358.6%Rescue & EMS
- 17113.7%Hazardous Condition
- 1249.9%Fire
- 1048.3%Good Intent Call
- 675.4%Service Call
- 483.8%False Alarm
- 20.2%Overpressure Rupture
- Fire incident types reported to NFIRS in Worcester, NY
- 5846.8%Structure Fires
- 3427.4%Outside Fires
- 2923.4%Mobile Property/Vehicle Fires
- 32.4%Other
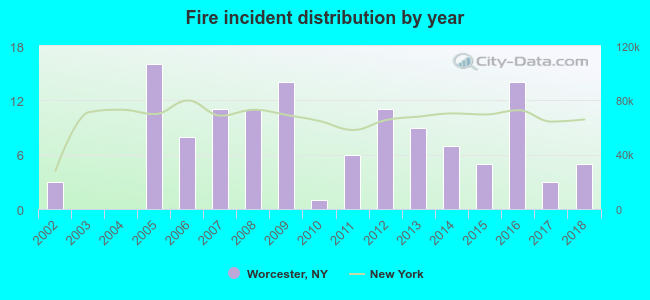 According to the data from the years 2002 - 2018 the average number of fires per year is 7. The highest number of fires - 16 took place in 2005, and the least - 0 in 2003. The data has a growing trend.
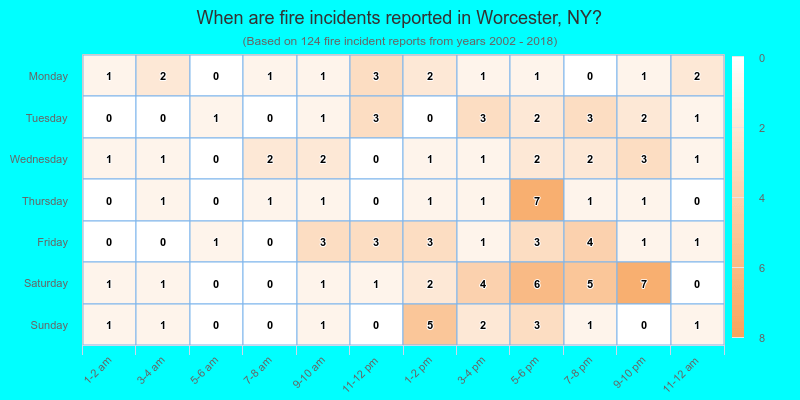
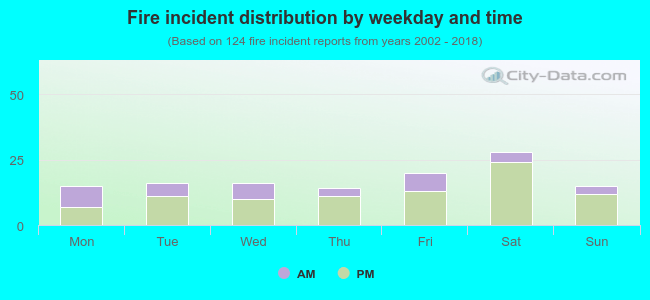 29.0% incidents where reported in the morning and 71.0% in the evening. The most fires (22.6%) took place on Saturday, and the least (11.3%) on Thursday.
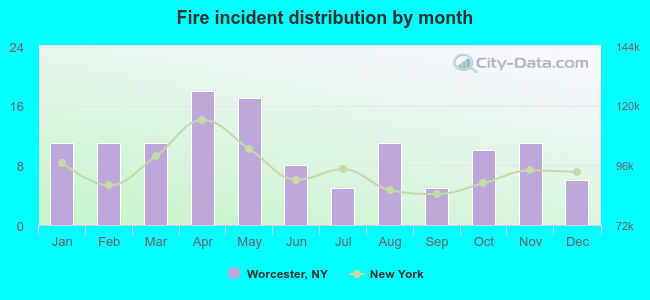 Based on the 124 reports from years 2002 - 2018 most fires (14.5%) took place during April, and the least (4.0%) in July.
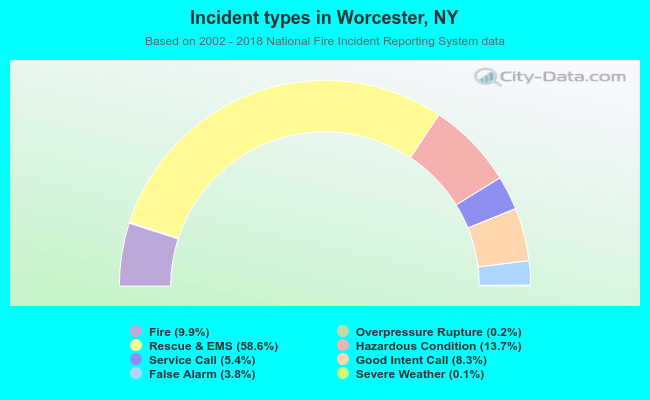 Out of all 1,250 cases reported during the years 2002 - 2018, the most belonged to the categories: Rescue & EMS (58.6%), Hazardous Condition (13.7%), and Fire (9.9%).
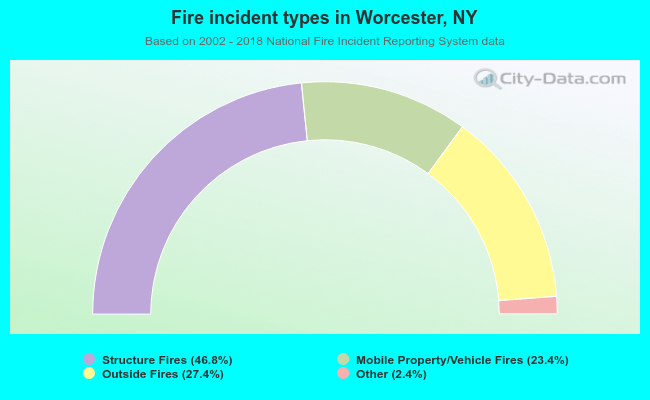 When looking into fire subcategories, the most reports belonged to: Structure Fires (46.8%), and Outside Fires (27.4%).