York: Fire Incidents, Maine (ME)
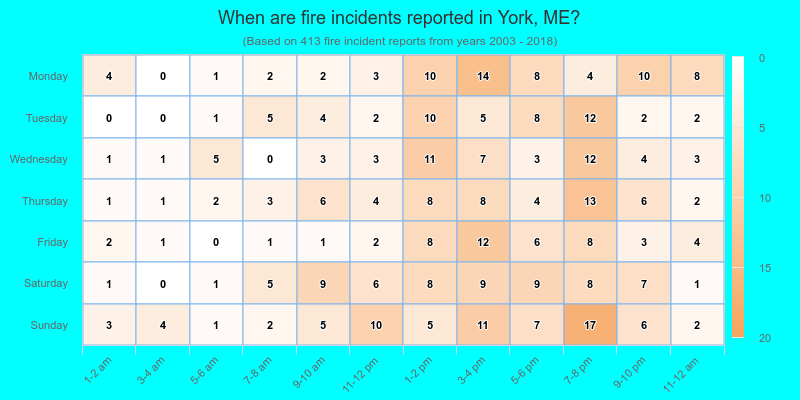
Where are fire incidents reported in York, ME
Something went wrong! Please refresh the page.
|
| |||||||||||||||||||||||||||||||||||||||||||||||||||||||||||||||||||||||||||||||||||||||||||||||||||||||||||||
2003 - 2018 National Fire Incident Reporting System (NFIRS) incidents
- Incident types reported to NFIRS in York, ME
- 5,28457.6%Rescue & EMS
- 1,07111.7%False Alarm
- 95910.5%Hazardous Condition
- 7978.7%Service Call
- 6006.5%Good Intent Call
- 4134.5%Fire
- 260.3%Severe Weather
- 140.2%Special Incident
- Fire incident types reported to NFIRS in York, ME
- 21251.3%Structure Fires
- 10024.2%Outside Fires
- 6515.7%Mobile Property/Vehicle Fires
- 368.7%Other
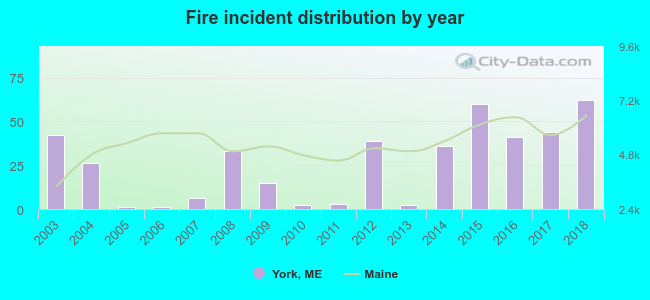 According to the data from the years 2003 - 2018 the average number of fire incidents per year is 26. The highest number of fire incidents - 62 took place in 2018, and the least - 1 in 2005. The data has a growing trend.
The average number of yearly fire incidents per 10k residents in York, ME compared to nearest cities:
(Note: Based on data for the last 3 years, including only cities with population 5,000 and above)
| York: | 39.1 |
| Eliot: | 18.8 |
| South Berwick: | 30.9 |
| Wells: | 48.3 |
| Kennebunk: | 88.9 |
| Sanford: | 16.6 |
| Lebanon: | 48.1 |
| Biddeford: | 59.5 |
| Saco: | 41.2 |
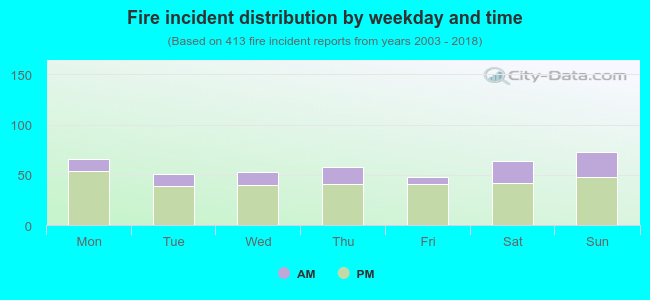 26.2% incidents where reported in the morning and 73.8% in the evening. The most fires (17.7%) took place on Sunday, and the least (11.6%) on Friday.
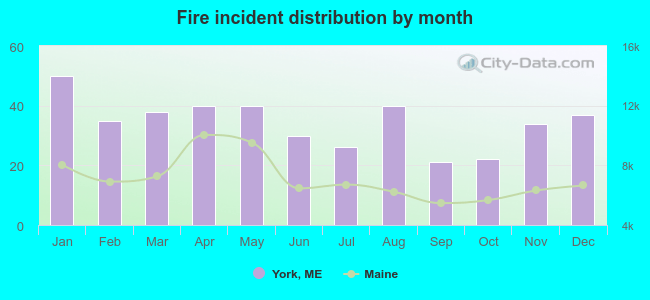 Based on the 413 reports from years 2003 - 2018 most fires (12.1%) took place during January, and the least (5.1%) in September.
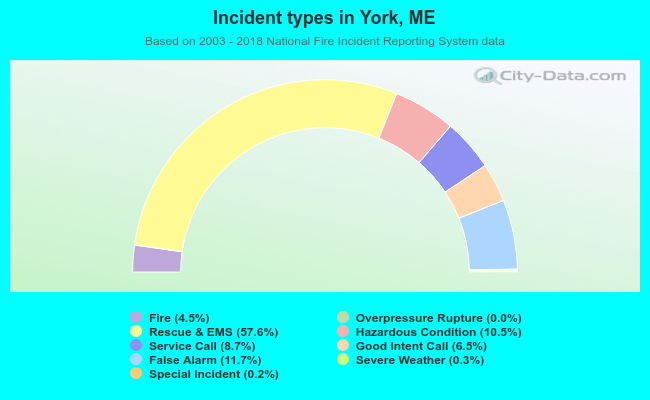 Out of all 9,167 cases reported during the years 2003 - 2018, the most belonged to the categories: Rescue & EMS (57.6%), False Alarm (11.7%), and Hazardous Condition (10.5%).
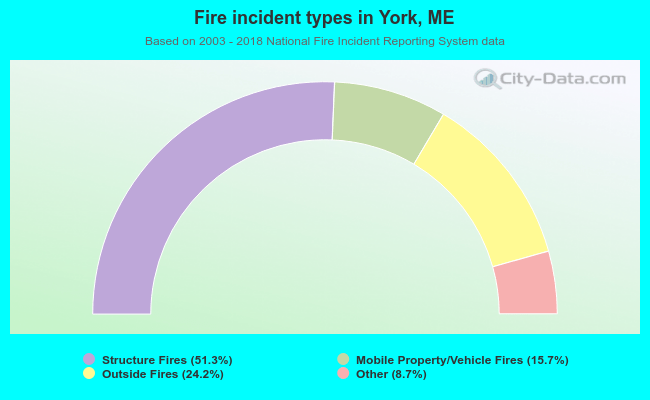 When looking into fire subcategories, the most incidents belonged to: Structure Fires (51.3%), and Outside Fires (24.2%).