Please register to participate in our discussions with 2 million other members - it's free and quick! Some forums can only be seen by registered members. After you create your account, you'll be able to customize options and access all our 15,000 new posts/day with fewer ads.
In related science news that mentiones Barrow too:
In all honesty, that is not "science news", it's just a bunch of conspiracy theorists going overboard! (And keep in mind my political persuasions are not exactly towards Bush, nor am I likely to understate the effects of global warming.)
There is just all kinds of very good satellite imagery that shows very well the changes in the Arctic ice over time. I don't know exactly where to find the images and will not make the effort. But I have sat in the NWS office here in Barrow and watched Gina Sturm (an expert on Arctic ice) pull up daily satellite imagery. I also saw the Ocean Watch crew put on a public outreach presentation a few days ago that included an up to the minute (downloaded literally an hour before) map of the Arctic ice.
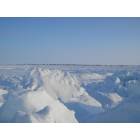
Worse, the images you posted might look to some as if they show something significant, but I assure you they do not. July is typically when the shore ice lets loose. The image showing ice (2006) looks like what we would expect so see here during the first week of July in just about any year. The image showing no ice looks just about what one might expect to see (with careful selection to avoid drifting ice floes) by the end of July in just about any year. Note that the ice show is "shore" ice, not pack ice. It is frozen to the bottom. The pack ice by that time, even in 2006, was miles distant.
The real significance can be found in two or three characteristics. We don't see any multiyear ice at all now. The ice in late September is now 200-400 miles away from Barrow (as opposed to 25-100). And after the shore ice breaks up in July there are now very few ice flows compared to the numbers that existed a decade ago.
Bush certainly was ignoring the data, but he had no way to really hide it.
Why is it that data ended in 2005? Reports are that the last few years the ice has been gaining and the winters have been cooler.
In Putting our boats in the Arctic Ocean annually, and for the last three years, we have had to pull them by about two weeks earlier than the previous year due to freezing. Which is about the same time that "Global Warming" changed to "Climate Change"... Bit odd on the timing don't you think?
Last edited by starlite9; 07-28-2009 at 12:01 AM..
Why is it that data ended in 2005? Reports are that the last few years the ice has been gaining and the winters have been cooler.
The data showing otherwise has been presented here before, so one wonders why you would say that again. It isn't true.
Quote:
In Putting our boats in the Arctic Ocean annually, and for the last three years, we have had to pull them by about two weeks earlier than the previous year due to freezing. Which is about the same time that "Global Warming" changed to "Climate Change"... Bit odd on the timing don't you think?
You are dealing with weather, not climate.
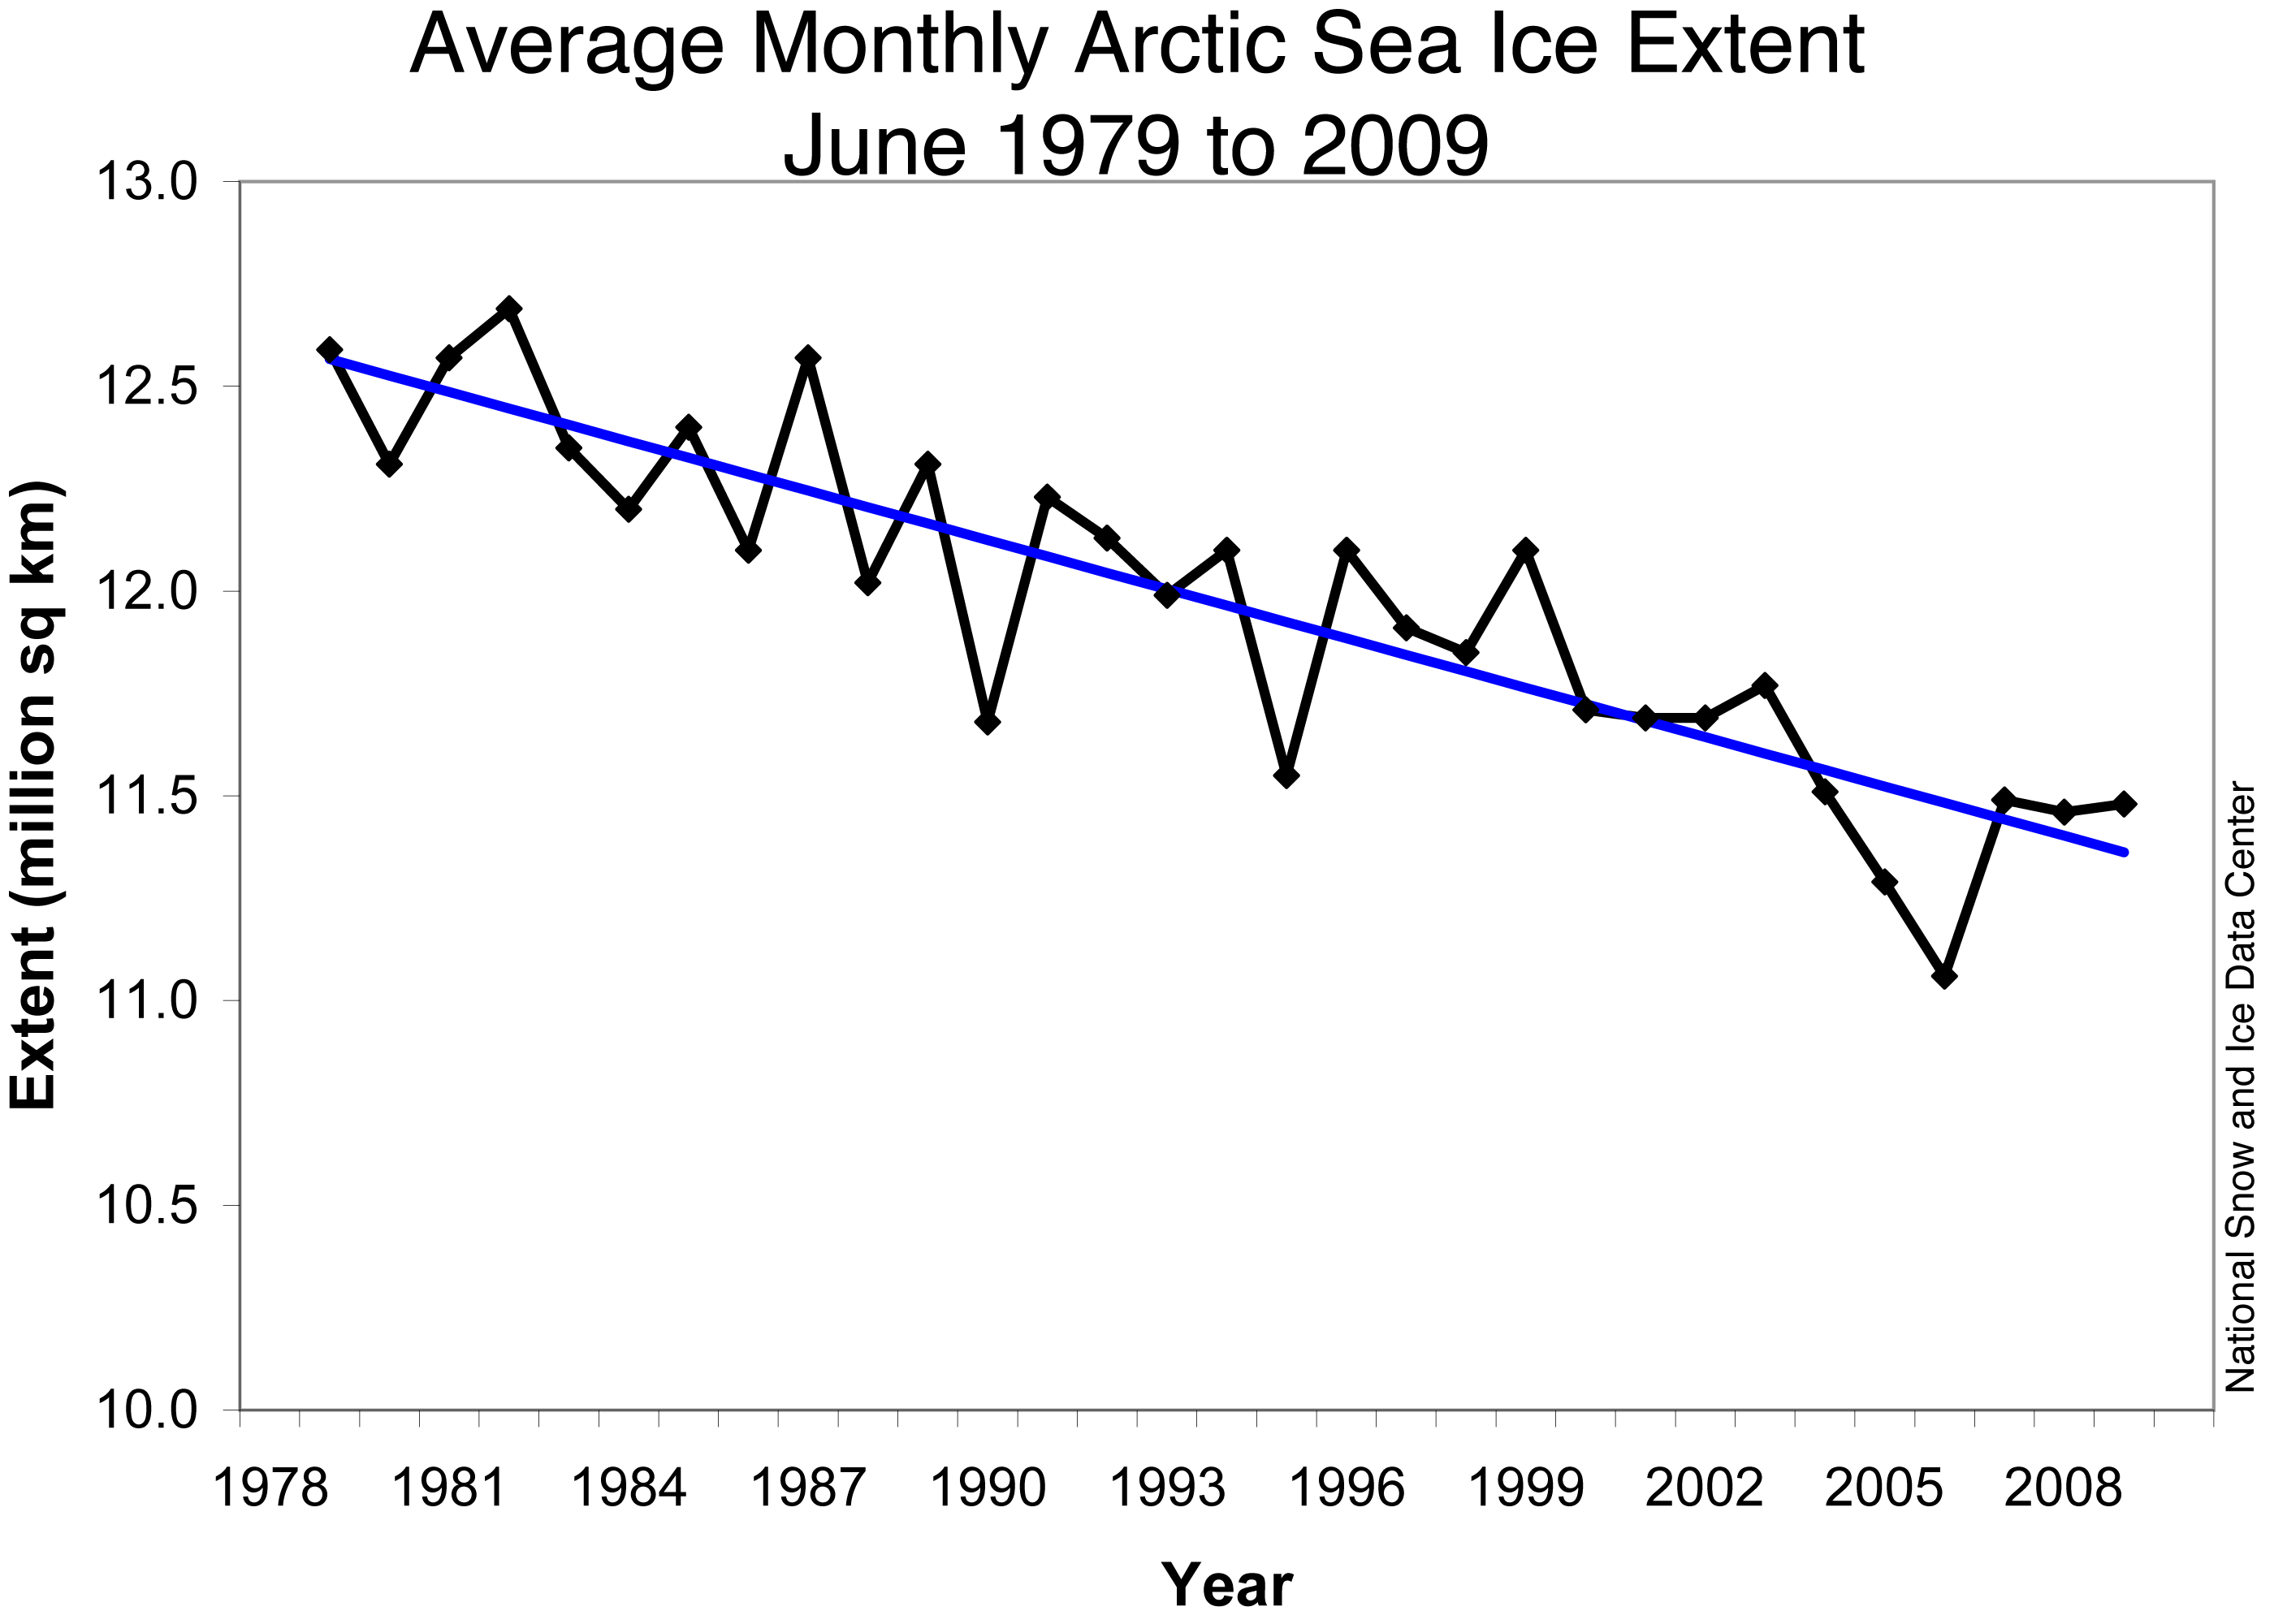
Note that in your limited experience the fact that the last three years have had more ice than the years just preceeding that appears to be significant. Yet the actual fact is that in the last 30 years there were only two years with less ice and three years with about the same amount of ice. The other years all had more ice, and the definite trend is still (even for the past three years) down. Any one year, or even five years is just observation of weather. The entire graph is climate.
Why is it that data ended in 2005? Reports are that the last few years the ice has been gaining and the winters have been cooler.
In Putting our boats in the Arctic Ocean annually, and for the last three years, we have had to pull them by about two weeks earlier than the previous year due to freezing. Which is about the same time that "Global Warming" changed to "Climate Change"... Bit odd on the timing don't you think?
Actually, the 2007 and 2008 sea ice minimums were the lowest in recorded history (Which dates back to only 1979, LOL). It's hard to draw many conclusions with such a small sample size.
However, while the obvious trend from 1979-2008 has been downward, it is to be expected with increased solar activity and a positive PDO.
However, we should be seeing sea ice increase over the next 20 years as we head into a negative PDO regime and lessened solar activity.
However, while the obvious trend from 1979-2008 has been downward, it is to be expected with increased solar activity and a positive PDO.
However, we should be seeing sea ice increase over the next 20 years as we head into a negative PDO regime and lessened solar activity.
And we should of course keep in mind that the PDO (Pacific Decadal Oscillation) is merely a relatively short term cycle (with a 60 year period) within the long term cycle of global temperature.
The chart shows monthly PDO in blue and monthly global temperature in red. Note the smoothed data lines and the trend lines. There is an obvious correlation between global temperature and the PDO for short term trends, but none for long term. Note the horizontal PDO trend compared to the upward slope of the temperature trend.
Which is another way to say that watching short term (weather) observations is clearly not a valid indication of climate change.
Actually, the 2007 and 2008 sea ice minimums were the lowest in recorded history (Which dates back to only 1979, LOL). It's hard to draw many conclusions with such a small sample size.
However, while the obvious trend from 1979-2008 has been downward, it is to be expected with increased solar activity and a positive PDO.
However, we should be seeing sea ice increase over the next 20 years as we head into a negative PDO regime and lessened solar activity.
What amazes me it that the Planet is hundreds of millions of years old. It has gone though massive amounts of changes that any one of many would have wiped us off the Planet, and appears has for other life forms.
We, as a people have been here less than a Milli second in the span of the Earth's history, and of that, the weather that is being touted as "Man's Fault" is but a sliver of that. So claiming that we have changed the course of the weather systems in that short period of time is trying to claim that we have the power of God. Having said that, we do have in fact the power to wipe most of the life off the Planet in hours with Nuclear weapons... which has nothing to do with "Climate Change" as we know it, but in fact would be the "Change" that would indeed affect the climate and does appear to be more of a reality than most want to think about.
I have said all along the Planet is going to do what it wants, with or without us and to claim that the last fifty years has changed the face of the Weather patterns from what we do on a day to day basis is mostly a faint attempt at us being a "God" of some kind within our own merit, or a scam for money by those with the morals of a "Carny hawker"... "I" tend to think of the latter.
The fact that we are more than likely still on the down trend of the last Ice Age that covered a lot more of the place than is being claimed "Lost" now.
If you are person that believes that there is a "God", then the Earth was made for man, not man for the Earth... In that case, this is the Womb for the Solar System...
But it appears that many are turning to the "Climate Change" as if was the hand of man and thus it's own Religion....
There is nothing wrong to recycle, cut down on waste and a host of things in being a good steward of the place we live, but this insanity of making food into fuel is one of many bad ideas that have come along along with buying and selling "Carbon Credits".
Currently where I live in Interior Alaska we are having another year of massive forest fires caused by lightening (been doing it for thousands of years)... a natural event. It has burnt in one area alone, some 250,000+ acres and has put more particulates into the air than all of our uses of fossel fuel for the year when added with all the other "Natural" fires many times over.
At some point, common sense has to start kicking in and that seems highly unlikely at this time....
The fact that these guys are able to sail around the Northwest Passage is an Adventure that I wish I could follow them on! I don't view it as the end of times....
If the USofA has all the cars and China is building a new coal fired power plant a week - why are we so concerned over global warming?
Wouldn't it stand to reason that China is warming their side of the planet more than we are? They have 1.3 billion methane emitting people and all of North America has less than 500 million.
Please register to post and access all features of our very popular forum. It is free and quick. Over $68,000 in prizes has already been given out to active posters on our forum. Additional giveaways are planned.
Detailed information about all U.S. cities, counties, and zip codes on our site: City-data.com.

 Please register to participate in our discussions with 2 million other members - it's free and quick! Some forums can only be seen by registered members. After you create your account, you'll be able to customize options and access all our 15,000 new posts/day with fewer ads.