Please register to participate in our discussions with 2 million other members - it's free and quick! Some forums can only be seen by registered members. After you create your account, you'll be able to customize options and access all our 15,000 new posts/day with fewer ads.
Oh, I will one of these days, come hell or high water...lol. But due to "other people" in my life and their circumstances, not to mention the crap-licious housing market around here, I'm stuck here for the time being. Yeah, it sucks.
That's why I'm entertaining the idea of fixing up rehab houses up there while keeping my primary residence down here, at least that'd get me up there part of the time - even better if i could swing it during the winter months so I can enjoy the S-N-O-W.
The Arctic Ocean is starting to refreeze. I took a screenshot of the Arctic Ocean sea ice at its minimum so as to preserve an image of sea ice at its lowest ever in recent years since the auto-update on the first page is showing increasing ice. From the cryosphere today, Sept 16 had the least sea ice. It's starting to refreeze fast.
You know my stance and I apoligize for continuing on with it but its my way of not being brainwashed. I am sick of the media continuing with all the warming news stories and not mentioning anything else.
How and why do they get to be bias but even the little people like me can't even leave posts without being considered bias on a forum?? They have gone over the line for me and I'm almost getting tired of searching for all the record cold thats happen.(because they are).
Do they know there's about to be record Ice at the other end of the pole???? Why focus on one end??? That is just very iritating to me and it give the public a false sense of whats happening.
Lets get with it and show the below normal temps and record cold/ice/snow along with the record warm at least..
How and why do they get to be bias but even the little people like me can't even leave posts without being considered bias on a forum?? They have gone over the line for me and I'm almost getting tired of searching for all the record cold thats happen.(because they are).
Do they know there's about to be record Ice at the other end of the pole???? Why focus on one end??? That is just very iritating to me and it give the public a false sense of whats happening.
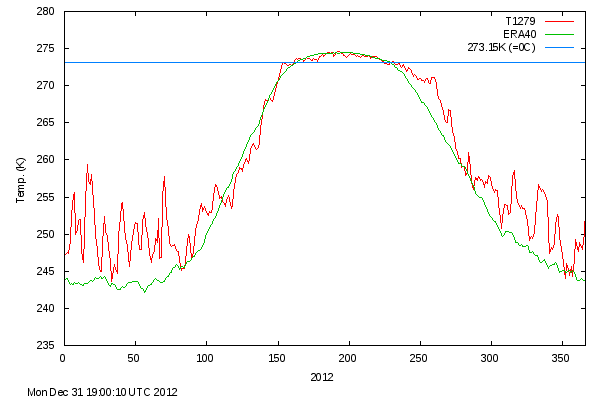
Fair enough, but there is a reason why there is more focus on the Arctic than Antarctica. The difference is much more drastic. Look at these graphs:
2012 stands out much more in the Arctic graphs than Antarctica graphs. Still, I'm curious why Antarctic sea ice has been increasing, maybe another post (or thread?) when I get time. Also, of course there are cold records as well as warm records, but to see which is the bigger story one should look at which ones are greater, as well as averages.
Fair enough, but there is a reason why there is more focus on the Arctic than Antarctica. The difference is much more drastic. Look at these graphs:
.
To me it looks like Arctic is less then 2 below normal ice. Antarctica is less than 2 above normal ice. I dont see a difference in the deviation from normal aspect. Is that what I was supposed to see?
That would be a cool thread to keep track of. Go for it. :-)
Back to the original issue, Antarctic ice does have a similar departure in terms of the raw area that is above normal (in the neighborhood of 1 000 000 sq km), but Antarctic ice extent has a smaller departure from normal in percentage terms, and is not as far off from ice extent in past years. Despite all that it is still a notable event in the sea ice department, and merits more attention than it's getting. Just because the warm event is more notable doesn't mean the other cold event is not notable. All it means is that it is less notable, and should be treated accordingly, such as for example having a third of the coverage while the warm event takes two thirds.
To the media's credit, I have seen recent reports on TV and online about the very high ice extent in Antarctica, so although it should be getting a bigger piece of the sea ice pie than it's getting now, I don't think the media have done too bad of a job reporting it. Also, I'd like to note that the fact that the high Antarctic ice is much more recent of a development than the low Arctic ice should be taken into account, since Antarctic ice wasn't that notable at all before about 10 days ago.
Last edited by nei; 09-22-2012 at 06:28 PM..
Reason: the post you are responding to has been deleted
To me it looks like Arctic is less then 2 below normal ice. Antarctica is less than 2 above normal ice. I dont see a difference in the deviation from normal aspect. Is that what I was supposed to see?
The graphs might be confusing. The thick black line each graph isn't the same time period; the Arctic graphs separate by three different decades. It looks like 2012 sea ice area minimum was about 2.5 million square kilometers below average. Antarctica was about half that. Cryopshere today's graphs:
the anomaly was actually greater than the area! The vertical scale on the graph had to be changed this year.
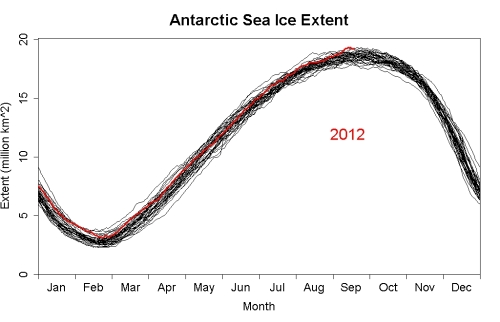
The near record max doesn't show up as obviously on the graph because the higher peaks were at other times of the year that weren't the max. These graphs might make the difference clear. 2012 is highlighted for Antarctica in red. black are other years:
Another year time with the record max (see the link below). Now look at the Arctic:
Back to the original issue, Antarctic ice does have a similar departure in terms of the raw area that is above normal (in the neighborhood of 1 000 000 sq km), but Antarctic ice extent has a smaller departure from normal in percentage terms, and is not as far off from ice extent in past years.
The data I've found show that the absolute departure is smaller for Antarctica. Regardless, there's a bit of confusion because right now Antarctic sea ice is near a maximum while Arctic sea ice is at a minimum. That would create a big % difference. Looks Antarctica sea ice minimum doesn't vary much; which makes sense geographically. It exists in open ocean (as opposed to the partly isolated Arctic Ocean) at much lower latitudes than the Arctic Ocean.
Quote:
Despite all that it is still a notable event in the sea ice department, and merits more attention than it's getting. Just because the warm event is more notable doesn't mean the other cold event is not notable. All it means is that it is less notable, and should be treated accordingly, such as for example having a third of the coverage while the warm event takes two thirds.
Agree with that, and it is interesting that Antarctic sea ice has been showing a consistent, though smaller compared to the Arctic, increase. It must mean something. My complaint would be if the media is treating the two events as equivalent, while in fact one is more dramatic than the other.
the anomaly was actually greater than the area! The vertical scale on the graph had to be changed this year.
Interesting.... but You know what I see on that graph?? A needle in a haystack. We are picking a tiny point in time and this is a hiccup. What I mean is... look at that graph. The last time it was this low what happened?? Right back up it went. So essentially we (& they) are looking at 1 month of extreme melt data and comparing it to a consistant ice gain on the other side of the pole.
What I mean is... i think the consistancy of the Ice Gaining on one side of the pole is more worth noting than a melt of a very tiny point in time no matter how much it is. No?
Please register to post and access all features of our very popular forum. It is free and quick. Over $68,000 in prizes has already been given out to active posters on our forum. Additional giveaways are planned.
Detailed information about all U.S. cities, counties, and zip codes on our site: City-data.com.


 Please register to participate in our discussions with 2 million other members - it's free and quick! Some forums can only be seen by registered members. After you create your account, you'll be able to customize options and access all our 15,000 new posts/day with fewer ads.