Health and Nutrition of Holiday Valley, OH Residents

Diet Behavior & Nutrition
Fifty seven percent of Holiday Valley residents report that their diet is generally healthy. People here have milk to drink or on their cereal 20 times per month. This includes chocolate and other flavored milks, as well as hot cocoa made with milk, and does not count small amounts of milk added to coffee or tea. People living here eat an average of four meals (breakfasts, lunches or dinners) per week that were prepared away from home in places such as restaurants, fast food places, food stands, grocery stores or from vending machines. They get one of these meals from a fast-food or pizza place. People here eat two "ready to eat" foods such as salads, soups, chicken, sandwiches and cooked vegetables per month. They also eat three frozen meals or frozen pizzas on average monthly.
Summary
Diet health (%)
- Holiday Valley 56.9%
- County 48.4%
- Ohio 49.6%
Milk product consumption (# of products/month)
- Here 20.5
- Clark County 21.9
- State 21.4
Meals not home prepared (#/week)
- Here 4.0
- County 3.3
- Ohio 3.6
Meals from fast food or pizza place (#/week)
- Here 1.3
- County 1.8
- State 1.8
Ready-to-eat foods (#/month)
- Here 2.0
- County 1.7
- Ohio 1.7
Frozen meals/pizza (#/month)
- Here 3.0
- Clark County 3.7
- State 3.6
The biggest differences compared to state averages have been highlighted with a blue background.
Oral Health
The average Holiday Valley resident last visited a dentist one years ago (including all types of dentists, such as, orthodontists, oral surgeons, and all other dental specialists, as well as dental hygienists). Ten percent of people living here 30 years of age and older, are embarrassed because of their teeth, mouth or dentures. Seventeen percent think they might have gum disease (might have swollen gums, receding gums, sore or infected gums or loose teeth). Holiday Valley residents rate the overall health of their teeth and gums on average at 58 percent. People living here aged 30 years and older, aside from brushing their teeth with toothbrush, use dental floss or any other device that clean between teeth on average four days per week. They also use mouthwash or other dental rinse products to treat dental disease or dental problems an average of three days per week. The average person living here (including children) has 24 teeth.
Summary
Average years since last visit a dentist
- Here 1.4
- Clark County 2.1
- State 2.0
People embarrassed because of mouth (%)
- Here 10.2%
- County 17.2%
- Ohio 16.1%
People with gum disease (%)
- Here 17.0%
- County 22.4%
- Ohio 21.3%
General health of teeth and gums (%)
- Holiday Valley 57.9%
- Clark County 44.3%
- Ohio 46.4%
Average days a week using dental floss/device
- Here 3.5
- County 2.6
- State 2.8
Average days a week using mouthwash for dental problem
- Here 2.8
- County 2.8
- Ohio 2.8
Average number of teeth
- Here 24.3
- Clark County 21.5
- Ohio 22.5
The biggest differences compared to state averages have been highlighted with a blue background.
Weight
The average height of Holiday Valley residents 16 years and older is 67 inches. The average weight is 180 pounds. Their average BMI (Body Mass Index) is 28. Thirty three percent of people living here are obese. Forty four percent have ever been obese. Forty three percent have ever tried to lose weight.
Summary
Average height (inches)
- Holiday Valley 67.1
- County 66.9
- Ohio 66.9
Average weight (pounds)
- Here 179.5
- County 181.0
- Ohio 181.0
Average BMI
- Here 28.4
- County 28.8
- Ohio 28.8
People that are obese (%)
- Holiday Valley 33.4%
- Clark County 38.0%
- State 37.7%
People that ever were obese (%)
- Here 43.8%
- Clark County 50.7%
- State 49.5%
People trying to lose weight (%)
- Here 43.5%
- County 33.7%
- Ohio 35.2%
The biggest differences compared to state averages have been highlighted with a blue background.
Drug Use
Sixty six percent of Holiday Valley residents have ever used marijuana or hashish. Twenty percent of people living here have ever used cocaine, crack cocaine, heroin or methamphetamine. Nineteen percent have ever used any form of cocaine, such as powder, 'crack', 'free base', and coca paste. Two percent have ever used heroin. Nine percent have ever used methamphetamines.
Summary
People that ever used marijuana or hashish (%)
- Holiday Valley 66.1%
- Clark County 66.3%
- State 64.5%
Ever used hard drugs (%)
- Holiday Valley 20.3%
- County 25.4%
- Ohio 23.9%
Ever used any form of cocaine (%)
- Holiday Valley 18.7%
- Clark County 22.8%
- Ohio 21.7%
Ever used heroin (%)
- Holiday Valley 1.5%
- County 3.4%
- Ohio 3.2%
Ever used methamphetamine (%)
- Here 8.7%
- Clark County 13.9%
- State 12.8%
The biggest differences compared to state averages have been highlighted with a blue background.
Diabetes
Ten percent of people living in Holiday Valley have ever been told by a doctor or health professional that they have diabetes. Fifty six percent of people had a blood test for high sugar or diabetes within the past three years. Three percent of city residents are currently taking insulin.
Summary
Diabetics (%)
- Here 9.5%
- Clark County 10.9%
- Ohio 10.1%
Had a blood test for high blood sugar (%)
- Here 56.2%
- Clark County 47.6%
- Ohio 47.2%
People taking insulin (%)
- Holiday Valley 3.3%
- Clark County 3.4%
- State 3.2%
Kidney Conditions-Urology
Holiday Valley residents 20 years and older on average get up to urinate one time at night (from time they go to bed at night until the time they get up in the morning).
Summary
Avg. # of times urinating at night
- Holiday Valley 1.0
- County 1.2
- Ohio 1.1
Taste & Smell
Eleven percent of Holiday Valley residents above the age of 40 have problems with their ability to smell, such as not being able to smell things or things not smelling the way they are supposed to. Seven percent have been having problems with their ability to taste sweet, sour, salty or bitter foods and drinks. Seventy one percent of people above the age of 40 have ever had wisdom teeth removed. Forty percent have ever had their tonsils removed. Seventeen percent have lost consciousness because of a head injury. Twenty two percent have ever had a broken nose or other serious injury to face or skull. Forty six percent have had two or more sinus infections.
Summary
People 40+ having problems with smell (%)
- Holiday Valley 11.1%
- County 12.2%
- Ohio 11.5%
People 40+ having problems with taste (%)
- Here 7.0%
- County 6.4%
- State 5.7%
People 40+ that ever had wisdom teeth removed (%)
- Holiday Valley 70.9%
- County 69.9%
- Ohio 68.6%
People 40+ that ever had tonsils teeth removed (%)
- Holiday Valley 39.9%
- County 28.8%
- State 29.9%
People 40+ that ever had a loss of consciousness because of a head injury (%)
- Here 17.1%
- Clark County 16.7%
- State 16.2%
People 40+ that ever had a broken nose or other serious injury to face or skull (%)
- Holiday Valley 22.2%
- Clark County 23.1%
- Ohio 22.1%
People 40+ that ever had two or more sinus infections (%)
- Holiday Valley 46.0%
- Clark County 40.8%
- State 42.5%
The biggest differences compared to state averages have been highlighted with a blue background.
Health Insurance
Eighty five percent of people living in Holiday Valley are covered by health insurance or some other kind of health care plan.
Summary
People covered by health insurance (%)
- Here 84.8%
- County 74.4%
- Ohio 75.4%
Blood Pressure & Cholesterol
Twenty eight percent of people living in Holiday Valley have been ever told by a doctor or other health professional that they had hypertension (also called high blood pressure). Twenty nine percent of people take their blood pressure at home. Fifty six percent of people in Holiday Valley frequently check their blood cholesterol. Twenty one percent of people have ever been told by a doctor or other health professional that their blood cholesterol level was high.
Summary
Has high blood pressure (%)
- Holiday Valley 27.9%
- Clark County 25.4%
- Ohio 23.6%
Checking blood pressure at home (%)
- Here 28.9%
- County 27.2%
- Ohio 25.3%
Frequently checking blood cholesterol (%)
- Holiday Valley 55.7%
- County 43.8%
- State 43.1%
Has high cholesterol level (%)
- Here 20.9%
- Clark County 21.3%
- State 19.7%
The biggest differences compared to state averages have been highlighted with a blue background.
Dermatology
Fifty two percent of people living in Holiday Valley use sunscreen.
Summary
People using sunscreen (%)
- Here 51.7%
- County 33.8%
- Ohio 35.5%
The biggest differences compared to state averages have been highlighted with a blue background.
Mental Health
Twenty one percent of Holiday Valley residents 18 years old and older have usually little interest or pleasure in doing things. Twenty one percent often feel down, depressed, or hopeless. Thirty nine percent of people living here have trouble falling or staying asleep, or sleep too much. Forty nine percent of people often feel tired or have little energy. Twenty one percent are bothered by poor appetite or overeating. Sixteen percent often feel badly about themselves, that they are a failure or have let themselves or their families down. Fifteen percent have trouble concentrating on things, such as reading the newspaper or watching TV. Seven percent of people living here move or speak so slowly that other people could have noticed, or the opposite - being so fidgety or restless that they have been moving around a lot more than usual. Two percent have thoughts that they would be better off dead or of hurting themselves in some way.
Summary
People who have little interest in doing things (%)
- Holiday Valley 21.3%
- County 27.2%
- Ohio 25.9%
People feeling down, depressed, or hopeless (%)
- Here 20.6%
- County 28.0%
- State 27.0%
People who have trouble sleeping or sleeping too much (%)
- Holiday Valley 38.7%
- Clark County 43.0%
- State 41.8%
People feeling tired or having little energy (%)
- Holiday Valley 49.5%
- Clark County 52.1%
- Ohio 51.4%
People with poor appetite or overeating (%)
- Holiday Valley 21.0%
- Clark County 28.6%
- Ohio 27.5%
People feeling bad about themself (%)
- Here 16.0%
- Clark County 22.0%
- State 21.0%
People who have trouble concentrating on things (%)
- Holiday Valley 14.8%
- Clark County 19.5%
- State 18.9%
People moving or speaking slowly or too fast (%)
- Holiday Valley 7.5%
- County 14.7%
- State 13.6%
People having thoughts they would be better off dead (%)
- Here 2.4%
- Clark County 4.6%
- Ohio 4.3%
The biggest differences compared to state averages have been highlighted with a blue background.
Prescription Medications
Holiday Valley residents on average take two prescription medicines.
Summary
Average number of prescription medicines taking
- Holiday Valley 2.4
- Clark County 2.3
- State 2.2
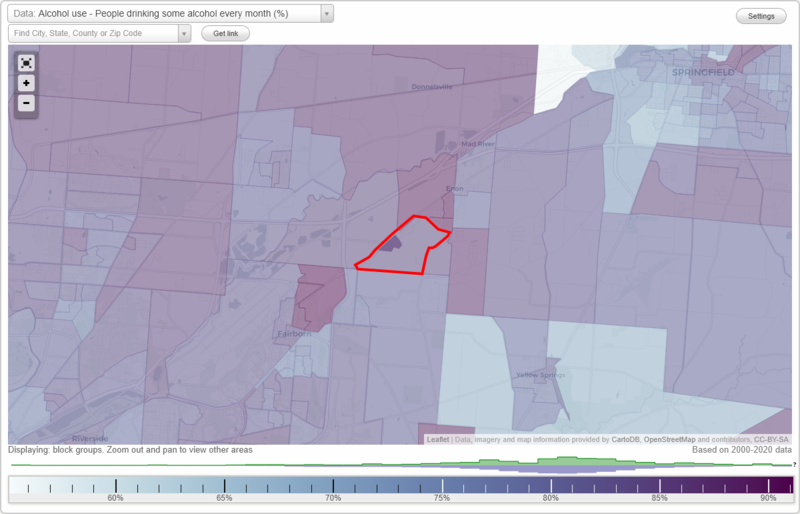
Alcohol use
Eighty three percent of people living in Holiday Valley have at least one alcoholic drink per month. Seven percent of people living here do not drink alcohol at all. People living here drink alcohol 6.2 days per month on average. They have 4.0 drinks per week. On average people living here have 5 or more drinks on 11 days a year.
Summary
People drinking some alcohol every month (%)
- Holiday Valley 82.8%
- County 80.4%
- State 80.0%
People not drinking at all (%)
- Here 7.3%
- Clark County 10.4%
- Ohio 10.7%
Average days/month drinking alcohol
- Here 6.2
- Clark County 4.9
- State 5.1
Average drinks/week
- Here 4.0
- Clark County 5.8
- State 5.7
Average days/year people drink much
- Holiday Valley 11.3
- Clark County 25.0
- Ohio 23.8
The biggest differences compared to state averages have been highlighted with a blue background.
Sexual Behavior
Ninety eight percent of Holiday Valley residents 18 years and older have ever had vaginal, anal or oral sex. Ninety five percent of males have ever had vaginal sex with a woman. Ninety percent have ever performed oral sex on a woman. Thirty four percent have ever had anal sex with a woman. Nine percent of males in Holiday Valley have ever had any kind of sex with a man, including oral or anal. Ninety nine percent of females have ever had vaginal sex with a man. Ninety two percent have ever performed oral sex on a man. Forty six percent have ever had anal sex. Nine percent of females have ever had any kind of sex with a woman. People in Holiday Valley were 18 years old on average when they had sex for the first time. The average man in his lifetime had any kind of sex with 14 women. He has vaginal sex with nine women. People living here were on average 22 years old when they first performed oral sex on a woman. In their lifetime they performed oral sex on average on two women. Males in their lifetime have anal or oral sex with 3.1 men on average. They have had 1.1 anal sex partners in their lifetime. People in Holiday Valley were 19 years old on average when they first performed oral sex on a man. They performed oral sex on average on three men in their lifetime. Three percent of people use protection, like a condom or dental dam, while performing oral sex. The average person in Holiday Valley has vaginal or anal sex 47 times a year. Sixty percent have sex without using a condom. Females in Holiday Valley 18 years and older have had any kind of sex with nine men on average. They have had eight male vaginal sex partners in their lifetimes. Women here have on average 0.4 female sex partners in their lifetimes. Eighty nine percent of men 18 years old and older are circumcised.
Summary
People 18+ that ever had sex (vaginal, anal, or oral) (%)
- Holiday Valley 98.3%
- Clark County 97.3%
- State 97.3%
Males 18+ that ever had vaginal sex with a woman (%)
- Here 94.5%
- County 94.9%
- State 94.5%
Males 18+ that ever performed oral sex on a woman (%)
- Here 90.0%
- County 87.3%
- Ohio 87.1%
Males 18+ that ever had anal sex with a woman (%)
- Holiday Valley 34.0%
- Clark County 49.6%
- Ohio 48.1%
Males 18+ that ever had any sex with a man (%)
- Here 9.4%
- County 5.5%
- Ohio 5.9%
Females 18+ that ever had vaginal sex with a man (%)
- Holiday Valley 98.5%
- Clark County 97.4%
- Ohio 97.4%
Females 18+ that ever performed oral sex on a man (%)
- Holiday Valley 92.0%
- County 84.7%
- State 85.3%
Females 18+ that ever had anal sex with a man (%)
- Here 45.9%
- County 40.1%
- State 38.7%
Females 18+ that ever had any kind of sex with a woman (%)
- Here 9.4%
- Clark County 12.2%
- State 11.6%
Average age people first had sex
- Here 17.8
- County 16.5
- Ohio 16.7
Average number of female sex partners in lifetime (males 18+)
- Holiday Valley 13.6
- Clark County 28.4
- State 26.8
Average number of female vaginal sex partners in lifetime (males 18+)
- Holiday Valley 8.6
- County 22.8
- State 21.2
Average age people first performed oral sex on a woman (18+)
- Holiday Valley 22.0
- Clark County 21.5
- Ohio 21.6
Average number of woman performed oral sex on in lifetime (18+)
- Here 2.5
- County 5.4
- State 5.1
Average number of male sex partners in lifetime (males 18+)
- Here 3.1
- County 3.5
- State 3.1
Average number of male anal sex partners in lifetime (males 18+)
- Holiday Valley 1.1
- Clark County 2.1
- State 1.8
Average age people first performed oral sex on a man (18+)
- Holiday Valley 18.9
- Clark County 20.1
- Ohio 19.8
Average number of male oral sex partners in lifetime (18+)
- Here 3.5
- County 6.3
- Ohio 5.4
People using protection when performing oral sex (%)
- Here 3.1%
- Clark County 8.2%
- State 8.7%
Average number of times people have vaginal or anal sex a year
- Holiday Valley 47.4
- County 60.5
- State 61.8
People having sex without condom (%)
- Here 60.3%
- County 56.2%
- Ohio 55.1%
Average number of male sex partners in lifetime (females 18+)
- Holiday Valley 9.3
- Clark County 11.8
- Ohio 11.3
Average number of male vaginal sex partners in lifetime (females 18+)
- Holiday Valley 8.4
- Clark County 10.4
- State 9.9
Average number of female sex partners in lifetime (females 18+)
- Holiday Valley 0.4
- Clark County 0.5
- Ohio 0.5
Circumcised males 18+ (%)
- Holiday Valley 89.3%
- Clark County 83.2%
- Ohio 83.2%
The biggest differences compared to state averages have been highlighted with a blue background.
Pesticide Use
Nine percent of households in Holiday Valley use chemical products in their homes to control fleas, roaches, ants, termites or other insects. Four percent use chemical products in their lawns or gardens to kill weeds.
Summary
Households using pesticides to control insects (%)
- Holiday Valley 9.2%
- Clark County 10.8%
- Ohio 10.1%
Households using pesticides to kill weeds (%)
- Holiday Valley 4.5%
- Clark County 4.5%
- State 4.3%
Sleep Disorders
Holiday Valley residents 16 years and older usually get seven hours of sleep at night on weekdays or workdays. Thirty three percent of them have trouble sleeping.
Summary
Average hours sleeping at night
- Here 6.9
- County 6.8
- State 6.8
People that has trouble sleeping (%)
- Holiday Valley 33.3%
- Clark County 32.7%
- State 31.9%
Smoking-Cigarette Use
Thirty four percent of Holiday Valley residents currently smoke cigarettes.
Summary
People smoking cigarettes (%)
- Here 33.6%
- County 53.4%
- Ohio 51.9%
The biggest differences compared to state averages have been highlighted with a blue background.
Physical Activity
Fourteen percent of Holiday Valley residents' work involve vigorous-intensity activity that causes large increases in breathing or heart rate, like carrying or lifting heavy loads, digging or construction work for at least 10 minutes continuously. Thirty four percent of people do moderate-intensity activities at work that cause small increases in breathing or heart rate such as brisk walking or carrying light loads for at least 10 minutes continuously. Twenty nine percent walk or bicycle for at least 10 minutes continuously to get to and from places. Twenty seven percent do any vigorous-intensity sports, fitness or recreational activities that cause large increases in breathing or heart rate like running or basketball for at least 10 minutes continuously. Fifty three percent do any moderate-intensity sports, fitness or recreational activities that cause a small increase in breathing or heart rate such as brisk walking, bicycling, swimming or golf for at least 10 minutes continuously. People living here spend seven hours sitting on a typical day (this includes sitting at work, at home, getting to and from places, or with friends, including time spent sitting at a desk, traveling in a car or bus, reading, playing cards, watching television or using a computer). They usually sit and watch TV or videos for about two hours per day. They use a computer or play computer games (including Playstation, Nintendo DS, or other portable video games) outside of work or school for 1.3 hours per day.
Summary
People doing vigorous-intensity work activities (%)
- Holiday Valley 14.0%
- County 21.6%
- State 22.0%
People doing moderate-intensity work activities (%)
- Holiday Valley 33.5%
- County 37.5%
- Ohio 38.0%
People walking or bicycling (%)
- Holiday Valley 29.0%
- Clark County 29.0%
- Ohio 29.4%
People doing vigorous-intensity recreational activities (%)
- Here 27.0%
- Clark County 16.1%
- State 19.4%
People doing moderate-intensity recreational activities (%)
- Holiday Valley 53.1%
- County 41.0%
- State 42.6%
Average hours a day doing sedentary activities
- Holiday Valley 7.0
- County 6.1
- Ohio 6.1
Average hours a day watching TV or videos
- Holiday Valley 2.5
- Clark County 2.9
- Ohio 2.8
Average hours a day using computer
- Here 1.3
- Clark County 1.2
- State 1.2
The biggest differences compared to state averages have been highlighted with a blue background.
Medical Conditions
Nine percent of Holiday Valley residents have ever been told by a doctor or other health professional that they had asthma. Three percent of people living here has anemia, sometimes called "tired blood" or "low blood". Four percent of people 16 years and older have ever been told by a doctor or other health care professional that they had psoriasis. Thirty seven percent are overweight. Fifteen percent of people 60 years and older have difficulties in thinking or remembering that can make a big difference in everyday activities (this does not refer to occasionally forgetting your keys or the name of someone you recently met). This refers to things like confusion or memory loss that are happening more often or getting worse. Fifteen percent of people living in Holiday Valley have ever received a blood transfusion. Fifteen percent have trouble seeing, even when wearing glasses or contact lenses. Thirty one percent of people 20 and older have arthritis. Seven percent have ever been told they had gout. Three percent have congestive heart failure. Four percent have coronary heart disease. Three percent have angina, also called angina pectoris. Four percent have ever had a heart attack, also called myocardial infarction. Three percent have been ever told by a doctor or other health professional that they had a stroke. Two percent have ever had emphysema. Nine percent have another thyroid problem. Three percent have ever had chronic bronchitis. Two percent of people had any kind of liver condition. Fourteen percent have ever had cancer or a malignancy of any kind.
Summary
People with asthma (%)
- Holiday Valley 9.4%
- County 11.4%
- State 10.8%
People with anemia (%)
- Here 2.9%
- County 3.6%
- State 3.4%
People with psoriasis (%)
- Holiday Valley 4.4%
- County 4.0%
- State 3.9%
People with overweight (%)
- Holiday Valley 37.0%
- County 34.3%
- Ohio 34.2%
Elderly people having difficulties in thinking or remembering (%)
- Holiday Valley 14.5%
- Clark County 23.2%
- Ohio 19.6%
People who ever received blood transfusion (%)
- Here 15.3%
- Clark County 13.3%
- Ohio 11.8%
People having trouble seeing even with glass/contacts (%)
- Holiday Valley 15.3%
- County 20.5%
- State 18.6%
People with arthritis (%)
- Holiday Valley 30.7%
- Clark County 28.7%
- Ohio 26.5%
People with gout (%)
- Holiday Valley 6.6%
- Clark County 4.2%
- State 3.9%
People with congestive heart failure (%)
- Holiday Valley 2.6%
- Clark County 4.1%
- State 3.6%
People with coronary heart disease (%)
- Holiday Valley 4.2%
- County 3.8%
- State 3.2%
People with angina pectoris (%)
- Here 2.9%
- Clark County 2.6%
- State 2.3%
People who ever had heart attack (%)
- Holiday Valley 4.0%
- Clark County 4.5%
- Ohio 3.9%
People who ever had stroke (%)
- Here 3.0%
- County 4.6%
- Ohio 4.0%
People with emphysema (%)
- Holiday Valley 2.3%
- County 4.0%
- State 3.3%
People with thyroid problem (%)
- Holiday Valley 9.4%
- County 8.0%
- Ohio 7.8%
People with chronic bronchitis (%)
- Holiday Valley 3.4%
- County 4.5%
- State 3.9%
People with any liver condition (%)
- Here 1.8%
- Clark County 3.6%
- State 2.9%
People who ever had cancer or malignancy (%)
- Here 14.0%
- Clark County 9.7%
- State 9.2%
The biggest differences compared to state averages have been highlighted with a blue background.
Reproductive Health
Sixty nine percent of births in Holiday Valley were vaginal deliveries. Thirty one percent of deliveries were cesarean. 99.3 percent of deliveries resulted in live births. Sixty one percent of pregnancies resulted in a delivery. Sixty two percent of women breastfeed their children. Twenty nine percent of women in Holiday Valley have ever had a hysterectomy, including a partial hysterectomy (that is, surgery to remove their uterus or womb). Fifteen percent had both of their ovaries removed (either when they had their uterus removed or at another time). Seventy eight percent have ever taken birth control pills for any reason. Six percent of women are currently taking birth control pills. Fifteen percent have ever used Depo-Provera or injectable birth control to prevent pregnancy. Twenty eight percent have ever used female hormones such as estrogen and progesterone, including any forms of female hormones, such as pills, cream, patch and injections, but do not include birth control methods or use for infertility.
Summary
Vaginal deliveries (%)
- Holiday Valley 68.8%
- County 67.6%
- Ohio 64.6%
Cesarean deliveries (%)
- Here 31.2%
- Clark County 32.4%
- Ohio 35.4%
Deliveries resulted in a live birth (%)
- Here 99.3%
- County 99.4%
- State 99.3%
Pregnancies resulted in a delivery (%)
- Holiday Valley 60.5%
- County 61.1%
- Ohio 59.8%
Women breastfeeding newborns (%)
- Holiday Valley 62.3%
- County 52.6%
- State 53.7%
Women that had a hysterectomy (%)
- Holiday Valley 28.8%
- Clark County 24.9%
- State 23.0%
Women that had both ovaries removed (%)
- Here 14.6%
- Clark County 13.2%
- Ohio 12.4%
Women that have ever taken birth control pills (%)
- Holiday Valley 78.0%
- Clark County 74.0%
- Ohio 75.6%
Women taking birth control pills (%)
- Here 6.3%
- County 6.9%
- State 8.5%
Women that have ever used Depo-Provera or injectables (%)
- Holiday Valley 14.6%
- County 15.4%
- State 15.9%
Women that have ever used female hormones (%)
- Holiday Valley 28.0%
- County 19.9%
- Ohio 18.9%
The biggest differences compared to state averages have been highlighted with a blue background.
Current Health Status
People living in Holiday Valley report their general health condition on average at 62 percent. Six percent of them donate blood. Excluding tests they have had as part of blood donations, 42 percent of Holiday Valley residents have ever had their blood tested for the AIDS virus infection. Eight percent of people living in Holiday Valley are left-handed.
Summary
General health condition (%)
- Holiday Valley 62.3%
- County 54.5%
- Ohio 56.1%
Blood donors (%)
- Holiday Valley 5.8%
- Clark County 3.8%
- State 4.5%
Has blood ever tested for HIV virus (%)
- Holiday Valley 42.1%
- County 39.4%
- Ohio 40.0%
Left-handed people (%)
- Here 8.3%
- Clark County 8.5%
- State 8.6%
The biggest differences compared to state averages have been highlighted with a blue background.
Consumer Behavior
People in Holiday Valley spend $376 per month on average on food for their families at supermarkets or grocery stores. This is 19 percent of their income. The average family in Holiday Valley spends $74 on food at other stores monthly. This is three percent of their income. They spend $209 on eating out, including cafeterias at work or at school or on vending machines. This is nine percent of their income. They also spend $33 monthly on carried out or delivered food. This is one percent of their income.
Summary
Money monthly spent on food at supermarket/grocery store
- Holiday Valley $376
- Clark County $355
- Ohio $357
Income spent on food at supermarket/grocery store (%)
- Here 18.6%
- Clark County 25.3%
- State 23.6%
Money monthly spent on food at other stores
- Here $74
- County $65
- Ohio $71
Income spent on food at other stores (%)
- Here 3.5%
- County 4.1%
- Ohio 4.2%
Money monthly spent on eating out
- Holiday Valley $209
- Clark County $125
- Ohio $139
Income spent on eating out (%)
- Here 8.7%
- County 6.6%
- Ohio 6.8%
Money monthly spent on carryout/delivered foods
- Holiday Valley $33
- Clark County $21
- Ohio $24
Income spent on carryout/delivered foods (%)
- Holiday Valley 1.0%
- Clark County 1.2%
- Ohio 1.3%
The biggest differences compared to state averages have been highlighted with a blue background.
Audiometry
People living in Holiday Valley report their general condition of hearing on average at 80 percent. Eighty five percent of them can usually hear and understand, without the use of a hearing aid or any other listening devices, what a person says without seeing his or her face if that person whispers to them from across a quiet room. Ninety seven percent of people can hear a normal voice across a quiet room. Nineteen percent of Holiday Valley population have been bothered by ringing, roaring or buzzing in their ears or head. Twenty eight percent of people living here have ever had a job where they were exposed to loud sounds or noise. Loud means so loud that they must speak in a raised voice to be heard. Thirteen percent of people in Holiday Valley had off-work exposure to loud noise.
Summary
Average condition of hearing (%)
- Here 79.9%
- Clark County 77.5%
- State 78.7%
People that can hear a whisper from across a quiet room (%)
- Here 84.6%
- County 77.0%
- Ohio 78.0%
People that can hear normal voice from across a quiet room (%)
- Here 97.0%
- County 94.2%
- Ohio 94.8%
Ears ringing, roaring, buzzing (%)
- Here 19.1%
- County 22.6%
- Ohio 20.3%
Had a job exposure to loud noise (%)
- Here 28.3%
- County 45.3%
- Ohio 43.4%
Had off-work exposure to loud noise (%)
- Holiday Valley 13.1%
- County 16.3%
- State 15.7%
The biggest differences compared to state averages have been highlighted with a blue background.
Preventive Aspirin Use
Thirty two percent of Holiday Valley residents 40 and older take a low-dose aspirin each day to prevent heart attacks, strokes or cancer.
Summary
Adults 40+ taking low-dose aspirin (%)
- Here 32.1%
- County 27.1%
- Ohio 26.5%
The biggest differences compared to state averages have been highlighted with a blue background.
Physical Functioning
Eleven percent of Holiday Valley residents 20 or older have limitations caused by a long-term physical, mental or emotional problems or illnesses keeping them from working at a job or business. Twenty percent are limited in the kind or amount of work they can do because of physical, mental or emotional problems. Nine percent have difficulty walking without using any special equipment. Five percent are limited in any way because of difficulty remembering or because they experience periods of confusion. Nine percent of people here have health problems that require them to use special equipment, such as a cane, wheelchair, special bed or special telephone.
Summary
People having limitations keeping them from working (%)
- Here 10.9%
- County 21.7%
- Ohio 18.5%
People limited in amount of work they can do (%)
- Holiday Valley 19.5%
- Clark County 28.6%
- State 25.0%
People that need special equipment to walk (%)
- Holiday Valley 8.8%
- County 11.0%
- State 9.5%
People experiencing confusion/memory problems (%)
- Holiday Valley 5.0%
- County 11.2%
- Ohio 9.8%
People requiring special healthcare equipment (%)
- Here 8.7%
- County 9.4%
- Ohio 8.1%
The biggest differences compared to state averages have been highlighted with a blue background.