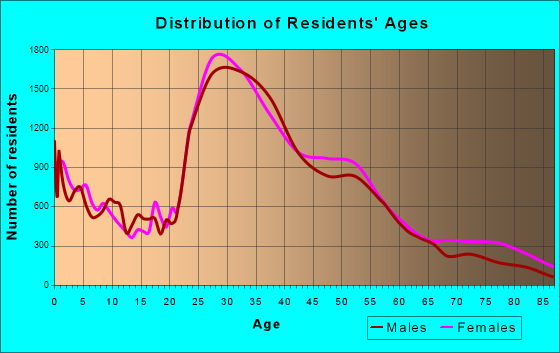
Alexandria, VA (Virginia) Houses and Residents
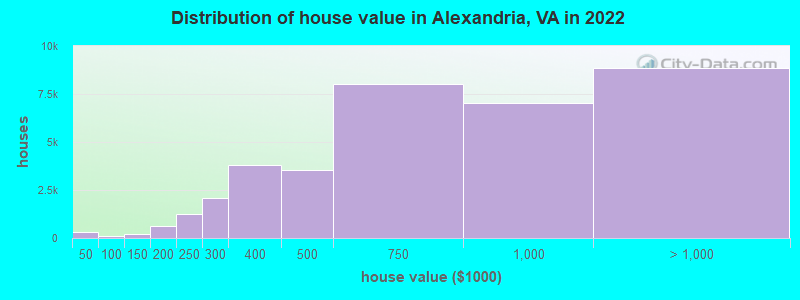
Estimated median house or condo value in 2022: $748,300 (it was $202,400 in 2000 )
Alexandria:
$748,300Virginia:
$365,700
Lower value quartile - upper value quartile: $456,600 - $1,081,700Mean price in 2022: Detached houses: $1,153,151 Here:
$1,153,151State:
$472,865
Townhouses or other attached units: $902,237 Here:
$902,237State:
$457,437
In 2-unit structures: $720,104 Here:
$720,104State:
$396,289
In 3-to-4-unit structures: $430,465 Here:
$430,465State:
$252,346
In 5-or-more-unit structures: $390,441 Here:
$390,441State:
$382,551
Total population: 150,575 (Urban population: 128,283, Rural population: 0)
Houses: 80,342 (76,672 occupied: 30,502 owner occupied, 46,170 renter occupied )
% of renters here:
60%State:
33%
Housing density: 5,293 houses/condos per square mile
Median price asked for vacant for-sale houses and condos in 2022: $545,239.
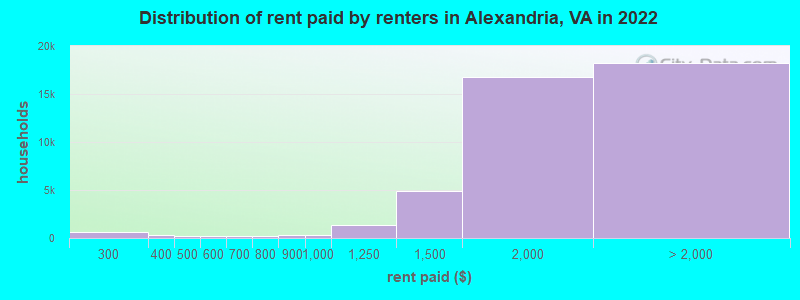
Median contract rent in 2022: $1,864 (lower quartile is $1,533, upper quartile is over $2,000)
Median rent asked for vacant for-rent units in 2022: $1,729
Median gross rent in Alexandria, VA in 2022: $1,960
Housing units in Alexandria with a mortgage: 23,478 (1,972 second mortgage, 111 home equity loan, 1,504 both second mortgage and home equity loan )Houses without a mortgage: 363
Median household income for houses/condos with a mortgage: $197,861
Median household income for apartments without a mortgage: $116,272
Median monthly housing costs: $2,109
Data:
Median house or condo value ($)
Median house or condo value ($ change since 2000)
Median house or condo value ($) - White
Median house or condo value ($) - Black or African American
Median house or condo value ($) - Asian
Median house or condo value ($) - Hispanic or Latino
Median house or condo value ($) - American Indian and Alaska Native
Median house or condo value ($) - Multirace
Median house or condo value ($) - Other Race
Median price asked for mobile homes ($)
Household density (households per square mile)
Mean house or condo value by units in structure - 1, detached ($)
Mean house or condo value by units in structure - 1, attached ($)
Mean house or condo value by units in structure - 2 ($)
Mean house or condo value by units in structure by units in structure - 3 or 4 ($)
Mean house or condo value by units in structure - 5 or more ($)
Mean house or condo value by units in structure - Boat, RV, van, etc. ($)
Mean house or condo value by units in structure - Mobile home ($)
Median contract rent ($)
Median contract rent - Lower quartile ($)
Median contract rent - Upper quartile ($)
Median gross rent ($)
Urban houses (%)
Rural houses (%)
Houses occupied (%)
Houses occupied (% change since 2000)
Houses owner occupied (%)
Houses owner occupied (% change since 2000)
Houses renter occupied (%)
Houses renter occupied (% change since 2000)
Vacant housing units - For rent (%)
Vacant housing units - For rent (% change since 2000)
Vacant housing units - For sale only (%)
Vacant housing units - For sale only (% change since 2000)
Vacant housing units - Rented or sold, not occupied (%)
Vacant housing units - Rented or sold, not occupied (% change since 2000)
Vacant housing units - For seasonal, recreational, or occasional use (%)
Vacant housing units - For seasonal, recreational, or occasional use (% change since 2000)
Vacant housing units - For migrant workers (%)
Vacant housing units - For migrant workers (% change since 2000)
Vacant housing units - Other vacant (%)
Vacant housing units - Other vacant (% change since 2000)
Median monthly housing costs ($)
Median household income for houses/condos with a mortgage ($)
Median household income for houses/condos without a mortgage ($)
Median household income ($)
Median household income ($) - White
Median household income ($) - Black or African American
Median household income ($) - Asian
Median household income ($) - Hispanic or Latino
Median household income ($) - American Indian and Alaska Native
Median household income ($) - Multirace
Median household income ($) - Other Race
Mortgage status - with mortgage (%)
Mortgage status - with second mortgage (%)
Mortgage status - with home equity loan (%)
Mortgage status - with both second mortgage and home equity loan (%)
Mortgage status - without a mortgage (%)
Median year house/condo built
Median year apartment built
Household type by relationship - Male householder living alone (%)
Household type by relationship - Male householder not living alone (%)
Household type by relationship - Female householder living alone (%)
Household type by relationship - Female householder not living alone (%)
Household type by relationship - Opposite-Sex spouse (%)
Household type by relationship - Same-Sex spouse (%)
Household type by relationship - Opposite-Sex unmarried partner (%)
Household type by relationship - Same-Sex unmarried partner (%)
Household type by relationship - In group quarters (%)
Size of family households - 2-person household (%)
Size of family households - 3-person household (%)
Size of family households - 4-person household (%)
Size of family households - 5-person household (%)
Size of family households - 6-person household (%)
Size of family households - 7-or-more-person household (%)
Size of nonfamily households - 1-person household (%)
Size of nonfamily households - 2-person household (%)
Size of nonfamily households - 3-person household (%)
Size of nonfamily households - 4-person household (%)
Size of nonfamily households - 5-person household (%)
Size of nonfamily households - 6-person household (%)
Size of nonfamily households - 7-or-moreperson household (%)
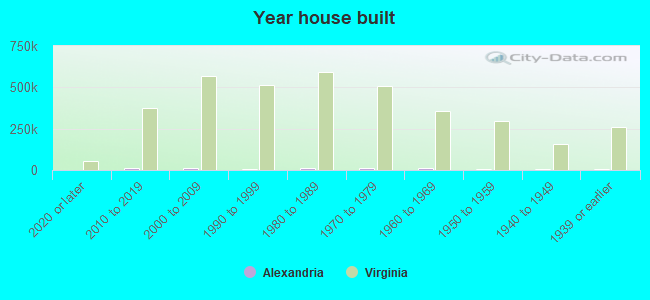
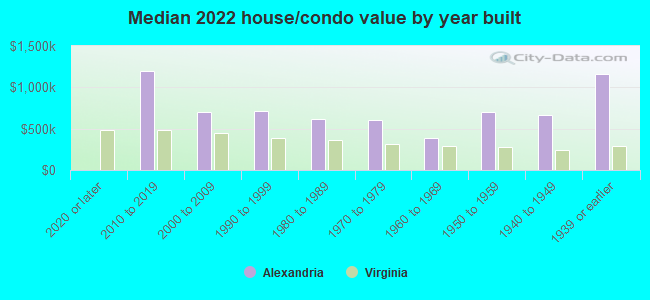
Year house built - Built 2010 or later (%)
Year house built - Built 2000 to 2009 (%)
Year house built - Built 1990 to 1999 (%)
Year house built - Built 1980 to 1989 (%)
Year house built - Built 1970 to 1979 (%)
Year house built - Built 1960 to 1969 (%)
Year house built - Built 1950 to 1959 (%)
Year house built - Built 1940 to 1949 (%)
Year house built - Built 1939 or earlier (%)
Median number of rooms in houses and condos
Median number of rooms in apartments
Median number of bedrooms in owner occupied houses
Mean number of bedrooms in owner occupied houses
Median number of bedrooms in renter occupied houses
Mean number of bedrooms in renter occupied houses
Median number of vehichles in owner occupied houses
Mean number of vehichles in owner occupied houses
Median number of vehichles in renter occupied houses
Mean number of vehichles in renter occupied houses
Rooms in owner-occupied houses - 1 room (%)
Rooms in owner-occupied houses - 2 rooms (%)
Rooms in owner-occupied houses - 3 rooms (%)
Rooms in owner-occupied houses - 4 rooms (%)
Rooms in owner-occupied houses - 5 rooms (%)
Rooms in owner-occupied houses - 6 rooms (%)
Rooms in owner-occupied houses - 7 rooms (%)
Rooms in owner-occupied houses - 8 rooms (%)
Rooms in owner-occupied houses - 9+ rooms (%)
Rooms in renter-occupied houses - 1 room (%)
Rooms in renter-occupied houses - 2 rooms (%)
Rooms in renter-occupied houses - 3 rooms (%)
Rooms in renter-occupied houses - 4 rooms (%)
Rooms in renter-occupied houses - 5 rooms (%)
Rooms in renter-occupied houses - 6 rooms (%)
Rooms in renter-occupied houses - 7 rooms (%)
Rooms in renter-occupied houses - 8 rooms (%)
Rooms in renter-occupied houses - 9+ rooms (%)
Bedrooms in owner-occupied houses - no bedrooms (%)
Bedrooms in owner-occupied houses - 1 bedroom (%)
Bedrooms in owner-occupied houses - 2 bedrooms (%)
Bedrooms in owner-occupied houses - 3 bedrooms (%)
Bedrooms in owner-occupied houses - 4 bedrooms (%)
Bedrooms in owner-occupied houses - 5+ bedrooms (%)
Bedrooms in renter-occupied houses - no bedrooms (%)
Bedrooms in renter-occupied houses - 1 bedroom (%)
Bedrooms in renter-occupied houses - 2 bedrooms (%)
Bedrooms in renter-occupied houses - 3 bedrooms (%)
Bedrooms in renter-occupied houses - 4 bedrooms (%)
Bedrooms in renter-occupied houses - 5+ bedrooms (%)
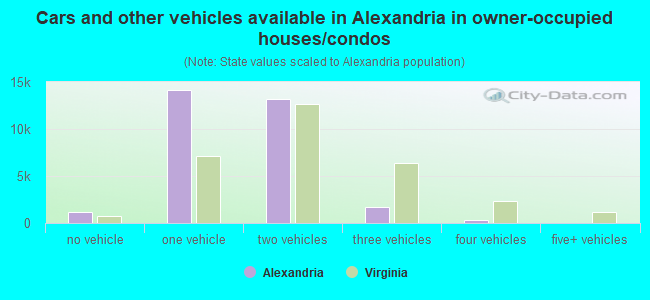
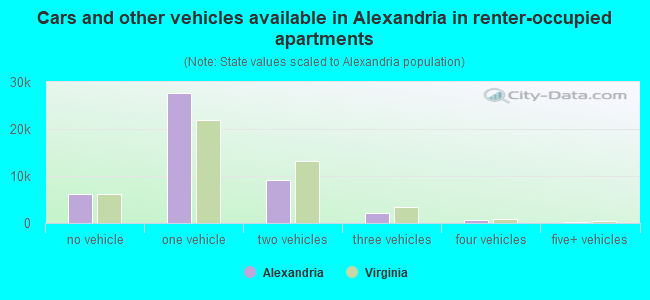
Vehicles available in owner-occupied houses - no vehicle available (%)
Vehicles available in owner-occupied houses - 1 vehicle available(%)
Vehicles available in owner-occupied houses - 2 Vehicles available (%)
Vehicles available in owner-occupied houses - 3 Vehicles available (%)
Vehicles available in owner-occupied houses - 4 Vehicles available (%)
Vehicles available in owner-occupied houses - 5+ Vehicles available (%)
Vehicles available in renter-occupied houses - no vehicle available (%)
Vehicles available in renter-occupied houses - 1 vehicle available (%)
Vehicles available in renter-occupied houses - 2 Vehicles available (%)
Vehicles available in renter-occupied houses - 3 Vehicles available (%)
Vehicles available in renter-occupied houses - 4 Vehicles available (%)
Vehicles available in renter-occupied houses - 5+ Vehicles available (%)
Housing units in structures - 1, detached (%)
Housing units in structures - 1, attached (%)
Housing units in structures - 2 (%)
Housing units in structures - 3 or 4 (%)
Housing units in structures - 5 to 9 (%)
Housing units in structures - 10 to 19 (%)
Housing units in structures - 20 to 49 (%)
Housing units in structures - 50 or more (%)
Housing units in structures - Mobile home (%)
Housing units in structures - Boat, RV, van, etc. (%)
Housing units in structures - Owners - 1, detached (%)
Housing units in structures - Owners - 1, attached (%)
Housing units in structures - Owners - 2 (%)
Housing units in structures - Owners - 3 or 4 (%)
Housing units in structures - Owners - 5 to 9 (%)
Housing units in structures - Owners - 10 to 19 (%)
Housing units in structures - Owners - 20 to 49 (%)
Housing units in structures - Owners - 50 or more (%)
Housing units in structures - Owners - Mobile home (%)
Housing units in structures - Owners - Boat, RV, van, etc. (%)
Housing units in structures - Renters - 1, detached (%)
Housing units in structures - Renters - 1, attached (%)
Housing units in structures - Renters - 2 (%)
Housing units in structures - Renters - 3 or 4 (%)
Housing units in structures - Renters - 5 to 9 (%)
Housing units in structures - Renters - 10 to 19 (%)
Housing units in structures - Renters - 20 to 49 (%)
Housing units in structures - Renters - 50 or more (%)
Housing units in structures - Renters - Mobile home (%)
Housing units in structures - Renters - Boat, RV, van, etc. (%)
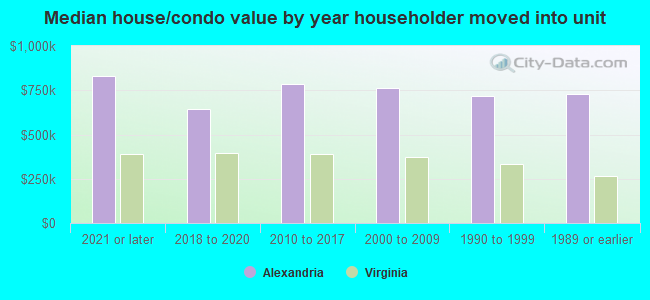
House/condo owner moved in on average (years ago)
Renter moved in on average (years ago)
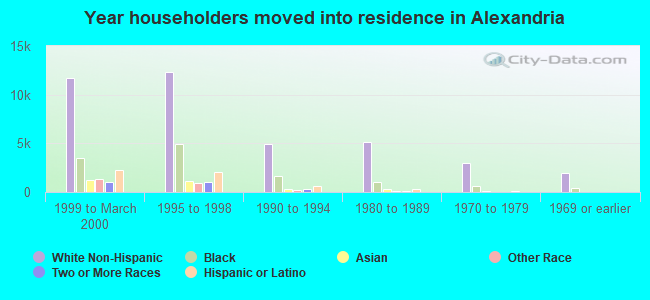
Year householder moved into unit - Moved in 1999 to March 2000 (%)
Year householder moved into unit - Moved in 1999 to March 2000 (%) - White
Year householder moved into unit - Moved in 1999 to March 2000 (%) - Black or African American
Year householder moved into unit - Moved in 1999 to March 2000 (%) - Asian
Year householder moved into unit - Moved in 1999 to March 2000 (%) - Hispanic or Latino
Year householder moved into unit - Moved in 1999 to March 2000 (%) - American Indian and Alaska Native
Year householder moved into unit - Moved in 1999 to March 2000 (%) - Multirace
Year householder moved into unit - Moved in 1999 to March 2000 (%) - Other Race
Year householder moved into unit - Moved in 1995 to 1998 (%)
Year householder moved into unit - Moved in 1995 to 1998 (%) - White
Year householder moved into unit - Moved in 1995 to 1998 (%) - Black or African American
Year householder moved into unit - Moved in 1995 to 1998 (%) - Asian
Year householder moved into unit - Moved in 1995 to 1998 (%) - Hispanic or Latino
Year householder moved into unit - Moved in 1995 to 1998 (%) - American Indian and Alaska Native
Year householder moved into unit - Moved in 1995 to 1998 (%) - Multirace
Year householder moved into unit - Moved in 1995 to 1998 (%) - Other Race
Year householder moved into unit - Moved in 1990 to 1994 (%)
Year householder moved into unit - Moved in 1990 to 1994 (%) - White
Year householder moved into unit - Moved in 1990 to 1994 (%) - Black or African American
Year householder moved into unit - Moved in 1990 to 1994 (%) - Asian
Year householder moved into unit - Moved in 1990 to 1994 (%) - Hispanic or Latino
Year householder moved into unit - Moved in 1990 to 1994 (%) - American Indian and Alaska Native
Year householder moved into unit - Moved in 1990 to 1994 (%) - Multirace
Year householder moved into unit - Moved in 1990 to 1994 (%) - Other Race
Year householder moved into unit - Moved in 1980 to 1989 (%)
Year householder moved into unit - Moved in 1980 to 1989 (%) - White
Year householder moved into unit - Moved in 1980 to 1989 (%) - Black or African American
Year householder moved into unit - Moved in 1980 to 1989 (%) - Asian
Year householder moved into unit - Moved in 1980 to 1989 (%) - Hispanic or Latino
Year householder moved into unit - Moved in 1980 to 1989 (%) - American Indian and Alaska Native
Year householder moved into unit - Moved in 1980 to 1989 (%) - Multirace
Year householder moved into unit - Moved in 1980 to 1989 (%) - Other Race
Year householder moved into unit - Moved in 1970 to 1979 (%)
Year householder moved into unit - Moved in 1970 to 1979 (%) - White
Year householder moved into unit - Moved in 1970 to 1979 (%) - Black or African American
Year householder moved into unit - Moved in 1970 to 1979 (%) - Asian
Year householder moved into unit - Moved in 1970 to 1979 (%) - Hispanic or Latino
Year householder moved into unit - Moved in 1970 to 1979 (%) - American Indian and Alaska Native
Year householder moved into unit - Moved in 1970 to 1979 (%) - Multirace
Year householder moved into unit - Moved in 1970 to 1979 (%) - Other Race
Year householder moved into unit - Moved in 1969 or earlier (%)
Year householder moved into unit - Moved in 1969 or earlier (%) - White
Year householder moved into unit - Moved in 1969 or earlier (%) - Black or African American
Year householder moved into unit - Moved in 1969 or earlier (%) - Asian
Year householder moved into unit - Moved in 1969 or earlier (%) - Hispanic or Latino
Year householder moved into unit - Moved in 1969 or earlier (%) - American Indian and Alaska Native
Year householder moved into unit - Moved in 1969 or earlier (%) - Multirace
Year householder moved into unit - Moved in 1969 or earlier (%) - Other Race
Housing units lacking complete plumbing facilities (%)
Housing units lacking complete kitchen facilities (%)
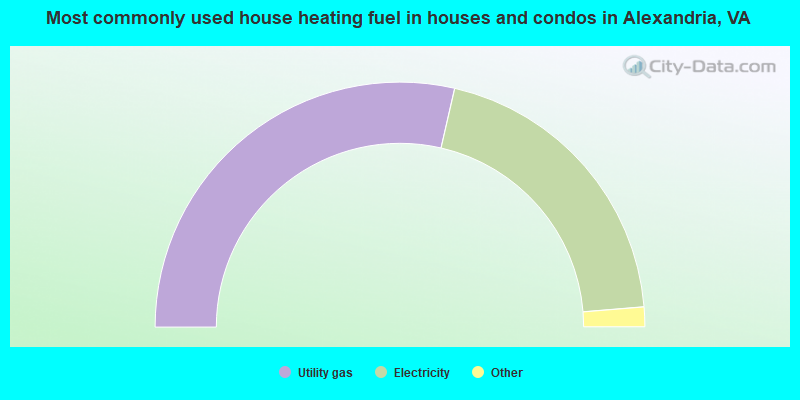
House heating fuel used in houses and condos - Utility gas (%)
House heating fuel used in houses and condos - Bottled, tank, or LP gas (%)
House heating fuel used in houses and condos - Electricity (%)
House heating fuel used in houses and condos - Fuel oil, kerosene, etc. (%)
House heating fuel used in houses and condos - Coal or coke (%)
House heating fuel used in houses and condos - Wood (%)
House heating fuel used in houses and condos - Solar energy (%)
House heating fuel used in houses and condos - Other fuel (%)
House heating fuel used in houses and condos - No fuel used (%)
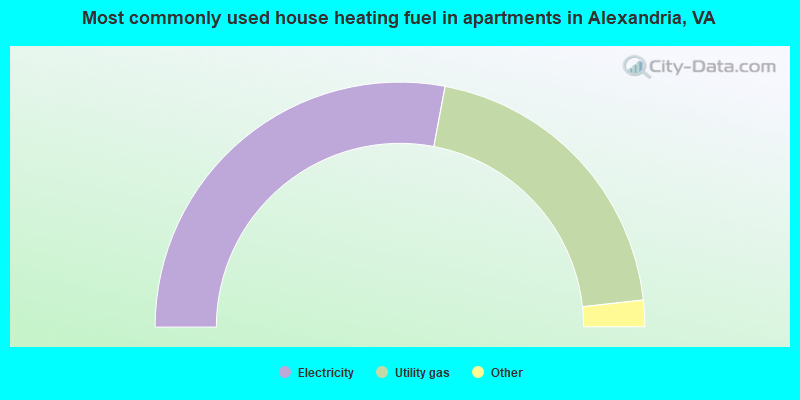
House heating fuel used in apartments - Utility gas (%)
House heating fuel used in apartments - Bottled, tank, or LP gas (%)
House heating fuel used in apartments - Electricity (%)
House heating fuel used in apartments - Fuel oil, kerosene, etc. (%)
House heating fuel used in apartments - Coal or coke (%)
House heating fuel used in apartments - Wood (%)
House heating fuel used in apartments - Solar energy (%)
House heating fuel used in apartments - Other fuel (%)
House heating fuel used in apartments - No fuel used (%)
Latest news about housing in Alexandria, VA collected exclusively by city-data.com from local newspapers, TV, and radio stations
Median year house/condo built: 1970Median year apartment built: 1980Household type by relationship:
Households: 155,525
Male householders: 37,627 (13,165 living alone ), Female householders: 39,045 (20,231 living alone )26,501 spouses (25,966 opposite-sex spouses ), 5,632 unmarried partners , (4,814 opposite-sex unmarried partners ), 32,116 children (31,486 natural , 255 adopted , 375 stepchildren ), 1,342 grandchildren , 1,507 brothers or sisters , 2,374 parents , 0 foster children , 3,432 other relatives , 4,325 non-relatives In group quarters: 1,624
Size of family households: 18,866 2-persons , 7,970 3-persons , 5,849 4-persons , 2,430 5-persons , 223 6-persons , 97 7-or-more-persons .
Size of nonfamily households: 33,396 1-person , 7,192 2-persons , 541 3-persons , 59 4-persons , 49 5-persons .
19,275 married couples with children. single-parent households (1,426 men , 5,600 women ).
69.4% of residents of Alexandria speak English at home. of residents speak Spanish at home (57% speak English very well , 19% speak English well , 16% speak English not well , 8% don't speak English at all ).of residents speak other Indo-European language at home (72% speak English very well , 19% speak English well , 8% speak English not well , 1% don't speak English at all ).of residents speak Asian or Pacific Island language at home (76% speak English very well , 19% speak English well , 4% speak English not well , 1% don't speak English at all ).of residents speak other language at home (63% speak English very well , 27% speak English well , 9% speak English not well , 1% don't speak English at all ).
Foreign born population: 36,828 (23.7%)of them are naturalized citizens )
Median number of rooms in houses and condos:
Median number of rooms in apartments
Owner-occupied Renter-occupied
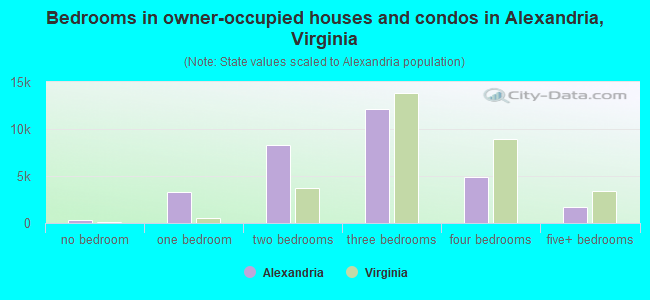
Bedrooms in owner-occupied houses and condos in Alexandria, Virginia
275 no bedroom 3,270 1 bedroom 8,333 2 bedrooms 12,111 3 bedrooms 4,863 4 bedrooms 1,650 5+ bedrooms
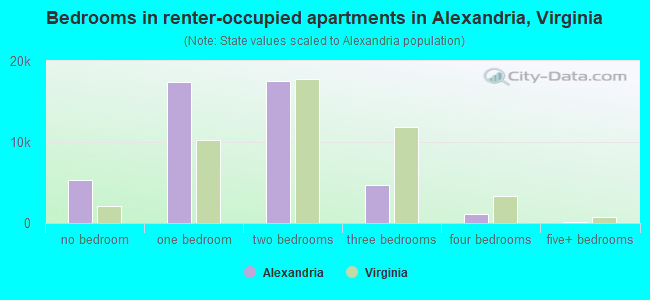
Bedrooms in renter-occupied apartments in Alexandria, Virginia
5,365 no bedroom 17,367 1 bedroom 17,576 2 bedrooms 4,685 3 bedrooms 1,071 4 bedrooms 106 5+ bedrooms
Owner-occupied Renter-occupied
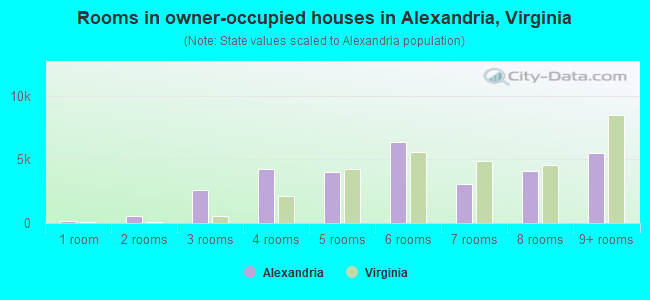
Rooms in owner-occupied houses in Alexandria, Virginia
156 1 room 514 2 rooms 2,599 3 rooms 4,263 4 rooms 4,027 5 rooms 6,338 6 rooms 3,025 7 rooms 4,071 8 rooms 5,509 9+ rooms
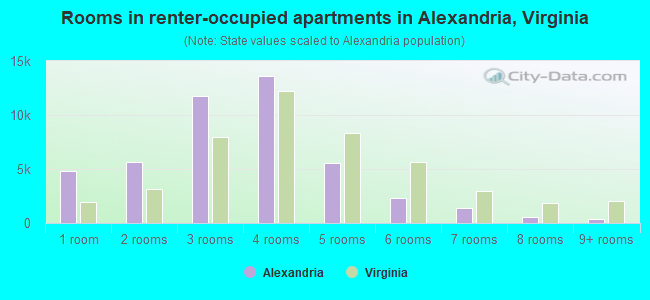
Rooms in renter-occupied apartments in Alexandria, Virginia
4,798 1 room 5,683 2 rooms 11,738 3 rooms 13,639 4 rooms 5,578 5 rooms 2,327 6 rooms 1,421 7 rooms 570 8 rooms 416 9+ rooms
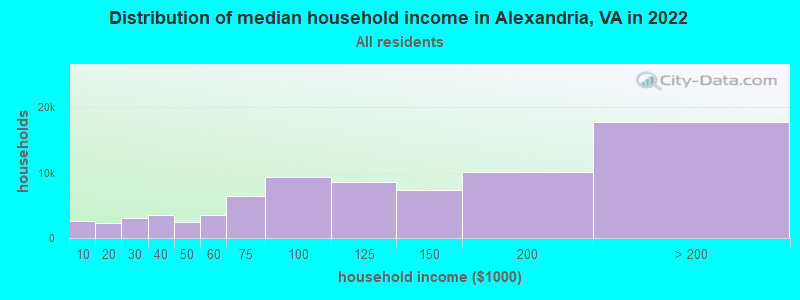
Alexandria, VA household income distribution 2,623 Less than $10,0002,279 $10,000 to $19,9993,000 $20,000 to $29,9993,530 $30,000 to $39,9992,381 $40,000 to $49,9993,516 $50,000 to $59,9996,352 $60,000 to $74,9999,262 $75,000 to $99,9998,544 $100,000 to $124,9997,377 $125,000 to $149,99910,080 $150,000 to $199,99917,728 $200,000 or more
Home value of owner - occupied houses in 2022 in Alexandria, VA 187 Less than $10,00038 $15,000 to $19,99943 $25,000 to $29,9994 $30,000 to $34,9999 $35,000 to $39,99914 $40,000 to $49,99918 $70,000 to $79,99952 $80,000 to $89,999141 $100,000 to $124,99965 $125,000 to $149,999237 $150,000 to $174,999379 $175,000 to $199,9991,265 $200,000 to $249,9992,072 $250,000 to $299,9993,814 $300,000 to $399,9993,542 $400,000 to $499,9997,997 $500,000 to $749,9997,026 $750,000 to $999,9995,965 $1,000,000 to $1,499,9991,826 $1,500,000 to $1,999,9991,078 $2,000,000 or moreRent paid by renters in 2022 in Alexandria, VA 153 Less than $10079 $100 to $14978 $150 to $199274 $200 to $249334 $250 to $299165 $300 to $349179 $350 to $399103 $400 to $44960 $450 to $49915 $500 to $549223 $550 to $59993 $600 to $649141 $650 to $69972 $700 to $749175 $750 to $799352 $800 to $899319 $900 to $9991,342 $1,000 to $1,2494,887 $1,250 to $1,49916,786 $1,500 to $1,99910,794 $2,000 to $2,4993,196 $2,500 to $2,9991,906 $3,000 to $3,4991,752 $3,500 or more630 No cash rent
Percentage of workers working in this county: 50.0%Number of people working at home: 30,015 (30.9% of all workers )
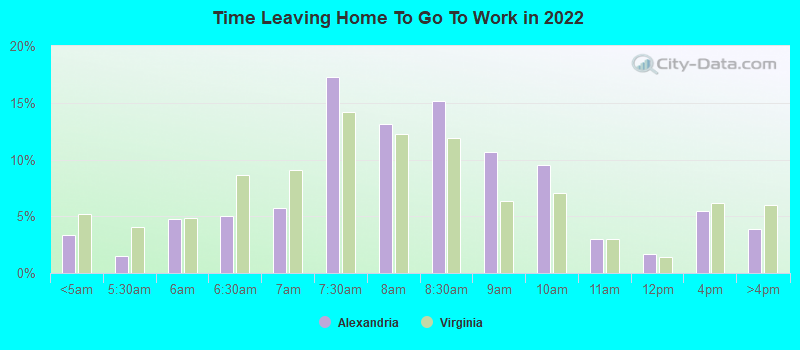
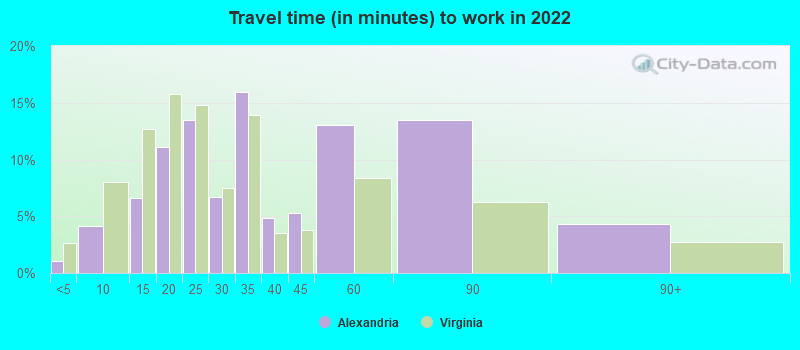
Travel time to work (commute)
Less than 5 minutes: 1,3745 to 9 minutes: 2,62910 to 14 minutes: 5,86215 to 19 minutes: 8,62420 to 24 minutes: 11,86125 to 29 minutes: 5,48330 to 34 minutes: 11,38135 to 39 minutes: 3,14840 to 44 minutes: 2,73245 to 59 minutes: 7,82360 to 89 minutes: 5,78190 or more minutes: 280
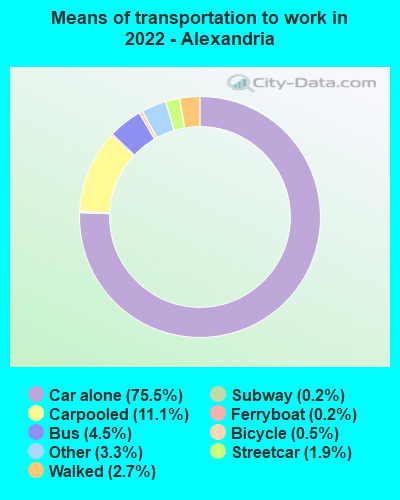
Means of transportation to work:
Drove a car alone: 56,552 (53.9%)Carpooled: 8,333 (7.9%)Bus : 3,367 (3.2%)Subway or elevated rail : 1,422 (1.4%)Long-distance train or commuter rail : 130 (0.1%)Ferryboat: 181 (0.2%)Taxi: 2,483 (2.4%)Bicycle: 394 (0.4%)Walked: 2,045 (1.9%)Worked at home: 30,015 (28.6%)
Unemployment by race in 2022
Unemployment rate for White non-Hispanic residents 0.8% Males2.9% FemalesUnemployment rate for Black residents 2.1% MalesUnemployment rate for Asian residents 0.2% Males3.5% FemalesUnemployment rate for other race residents 3.4% Males9.0% FemalesUnemployment rate for two or more race residents 3.4% Males4.0% FemalesUnemployment rate for Hispanic or Latino residents 2.8% Males4.6% Females
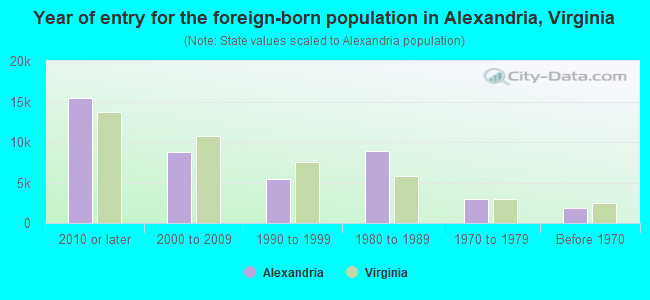
Year of entry for the foreign-born population in Alexandria, Virginia
15,409 2010 or later 8,753 2000 to 2009 5,396 1990 to 1999 8,881 1980 to 1989 2,958 1970 to 1979 1,829 Before 1970
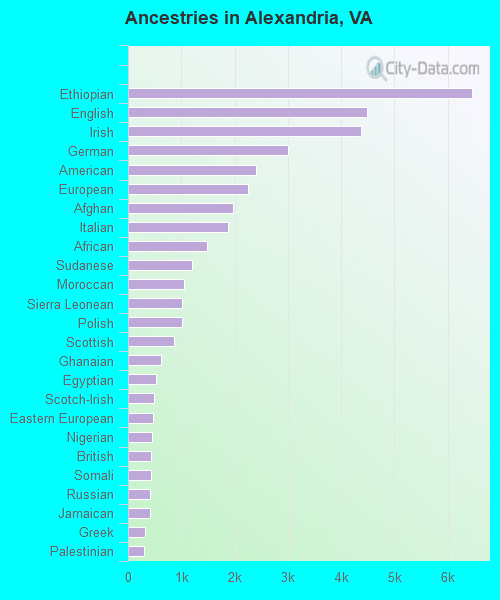
First ancestries reported:
Ethiopian: 6,456 (7.8%)
English: 4,485 (5.4%)
Irish: 4,374 (5.3%)
German: 3,008 (3.7%)
American: 2,408 (2.9%)
European: 2,251 (2.7%)
Afghan: 1,980 (2.4%)
Italian: 1,873 (2.3%)
African: 1,475 (1.8%)
Sudanese: 1,206 (1.5%)
Moroccan: 1,047 (1.3%)
Sierra Leonean: 1,020 (1.2%)
Polish: 1,012 (1.2%)
Scottish: 864 (1.0%)
Ghanaian: 619 (0.8%)
Egyptian: 523 (0.6%)
Scotch-Irish: 492 (0.6%)
Eastern European: 469 (0.6%)
Nigerian: 450 (0.5%)
British: 439 (0.5%)
Somali: 423 (0.5%)
Russian: 416 (0.5%)
Jamaican: 410 (0.5%)
Greek: 310 (0.4%)
Palestinian: 299 (0.4%)
Turkish: 282 (0.3%)
French: 279 (0.3%)
Norwegian: 276 (0.3%)
Dutch: 259 (0.3%)
Iranian: 252 (0.3%)
Swedish: 236 (0.3%)
Northern European: 216 (0.3%)
Albanian: 206 (0.3%)
Jordanian: 203 (0.2%)
Ukrainian: 203 (0.2%)
Iraqi: 190 (0.2%)
Portuguese: 180 (0.2%)
Welsh: 134 (0.2%)
Armenian: 126 (0.2%)
Brazilian: 125 (0.2%)
Lebanese: 118 (0.1%)
Arab: 116 (0.1%)
Scandinavian: 109 (0.1%)
French Canadian: 104 (0.1%)
Ugandan: 88 (0.1%)
Serbian: 88 (0.1%)
Slavic: 85 (0.1%)
Haitian: 83 (0.1%)
Hungarian: 82 (0.10%)
Trinidadian and Tobagonian: 77 (0.09%)
South African: 76 (0.09%)
Danish: 73 (0.09%)
Romanian: 71 (0.09%)
Belgian: 63 (0.08%)
Swiss: 47 (0.06%)
Canadian: 46 (0.06%)
Syrian: 44 (0.05%)
Austrian: 41 (0.05%)
Cape Verdean: 39 (0.05%)
Australian: 39 (0.05%)
Liberian: 37 (0.04%)
Bulgarian: 36 (0.04%)
Croatian: 36 (0.04%)
Slovak: 30 (0.04%)
Czech: 28 (0.03%)
Zimbabwean: 27 (0.03%)
Slovene: 27 (0.03%)
Czechoslovakian: 23 (0.03%)
Yugoslavian: 23 (0.03%)
Senegalese: 21 (0.03%)
Guyanese: 20 (0.02%)
Icelander: 20 (0.02%)
Lithuanian: 20 (0.02%)
British West Indian: 19 (0.02%)
Barbadian: 18 (0.02%)
Finnish: 18 (0.02%)
Belizean: 17 (0.02%)
U.S. Virgin Islander: 17 (0.02%)
Bahamian: 10 (0.01%)
West Indian: 7 (0.01%)
Latvian: 6 (0.01%)
Cajun: 5 (0.01%)
Luxembourger: 5 (0.01%)
Most common places of birth for foreign-born residents (%): Ethiopia Alexandria:
14.5% (5,661)Virginia:
2.9% (32,082)
El Salvador Alexandria:
10.7% (4,174)Virginia:
9.9% (107,534)
Honduras Alexandria:
6.3% (2,462)Virginia:
3.0% (32,892)
Afghanistan Alexandria:
6.1% (2,372)Virginia:
1.8% (19,426)
Guatemala Alexandria:
2.9% (1,146)Virginia:
3.3% (35,938)
Sudan Alexandria:
2.8% (1,106)Virginia:
0.4% (4,442)
Philippines Alexandria:
2.8% (1,082)Virginia:
4.8% (52,629)
Bolivia Alexandria:
2.7% (1,051)Virginia:
2.4% (25,722)
Sierra Leone Alexandria:
2.4% (946)Virginia:
0.6% (6,458)
Mexico Alexandria:
2.3% (914)Virginia:
5.3% (57,498)
Ghana Alexandria:
2.3% (902)Virginia:
1.6% (17,346)
Morocco Alexandria:
2.2% (860)Virginia:
0.7% (7,733)
Korea Alexandria:
1.8% (689)Virginia:
4.9% (52,857)
India Alexandria:
1.7% (684)Virginia:
9.0% (97,830)
China, excluding Hong Kong and Taiwan Alexandria:
1.6% (632)Virginia:
3.9% (42,989)
Panama Alexandria:
1.5% (594)Virginia:
0.4% (4,196)
Place of birth for U.S.-born residents:
This state: 37,530Other state: 78,293Northeast: 24,400Midwest: 15,193South: 29,579West: 9,121 82.8% of Alexandria residents lived in the same house 1 years ago.
Out of people who lived in different houses, 21.9% lived in this county.
Out of people who lived in different counties, 47.4% lived in Virginia.
Alexandria:
82.8%State average:
86.6%
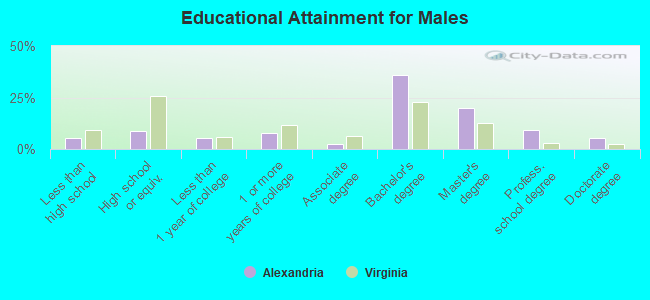
Education attainment for males 25 years and older:
No schooling: 329Nursery to 4th grade: 1845th and 6th grade: 5207th and 8th grade: 09th grade: 18510th grade: 6511th grade: 1,45512th grade, no diploma: 262High school graduate (or equivalency): 5,038Less than 1 year of college: 2,942Some college more than 1 year, no degree: 4,391Associate degree: 1,490Bachelor's degree: 20,462Master's degree: 11,433Professional school degree: 5,237Doctorate degree: 2,992
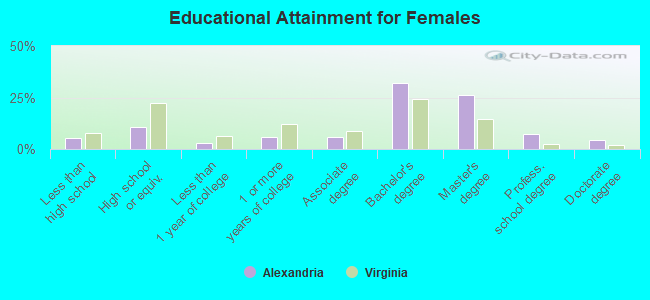
Education attainment for females 25 years and older:
No schooling: 639Nursery to 4th grade: 2585th and 6th grade: 3867th and 8th grade: 5519th grade: 39010th grade: 3411th grade: 28012th grade, no diploma: 799High school graduate (or equivalency): 6,430Less than 1 year of college: 1,661Some college more than 1 year, no degree: 3,592Associate degree: 3,689Bachelor's degree: 19,594Master's degree: 16,018Professional school degree: 4,345Doctorate degree: 2,575
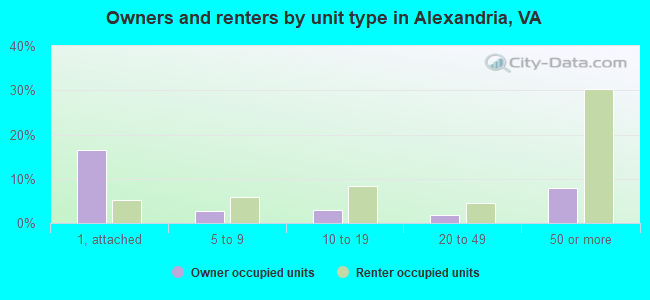
Housing units in structures:
One, detached: 10,629One, attached: 18,647Two: 6663 or 4: 2,1035 to 9: 6,06110 to 19: 7,50820 to 49: 4,67750 or more: 29,969Mobile homes: 45Boats, RVs, vans, etc.: 37Housing units lacking complete plumbing facilities in 2022: 0.5%Housing units lacking complete kitchen facilities in 2022: 0.6%House/condo owner moved in on average 9 years ago
Renter moved in on average 1 years ago
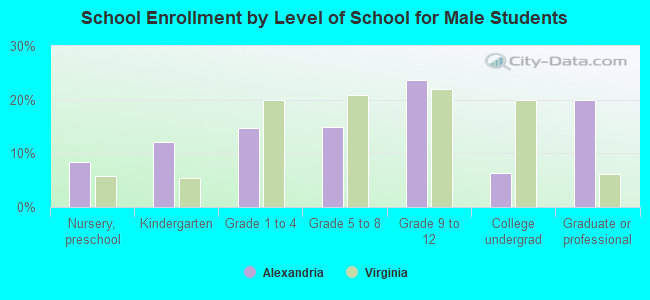
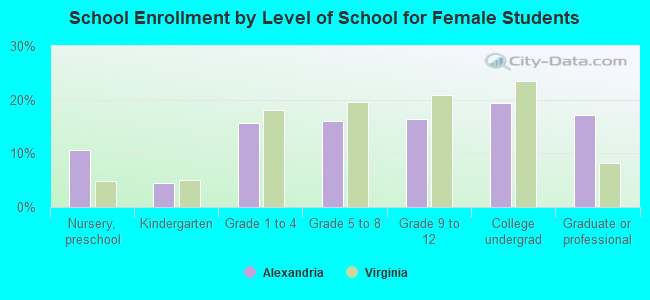
Private vs. public school enrollment:
Students in private schools in grades 1 to 8 (elementary and middle school): 1,766 Students in private schools in grades 9 to 12 (high school): 732 Students in private undergraduate colleges: 1,009