Atlanta, GA (Georgia) Houses and Residents
Estimated median house or condo value in 2022: $424,600 (it was $144,100 in 2000 )
Atlanta:
$424,600Georgia:
$297,400
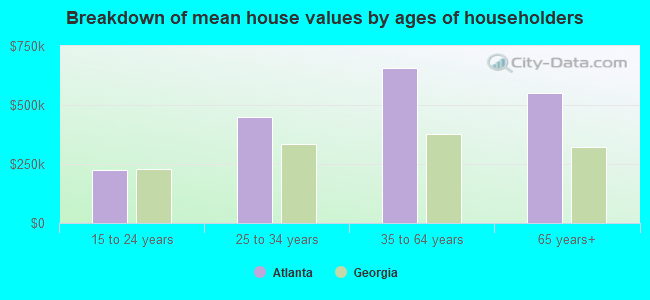
Lower value quartile - upper value quartile: $273,600 - $704,600Mean price in 2022: Detached houses: $673,143 Here:
$673,143State:
$376,364
Townhouses or other attached units: $475,155 Here:
$475,155State:
$341,709
In 2-unit structures: $386,963 Here:
$386,963State:
$269,631
In 3-to-4-unit structures: $318,643 Here:
$318,643State:
$250,092
In 5-or-more-unit structures: $457,641 Here:
$457,641State:
$370,730
Mobile homes: $118,293 Here:
$118,293State:
$102,413
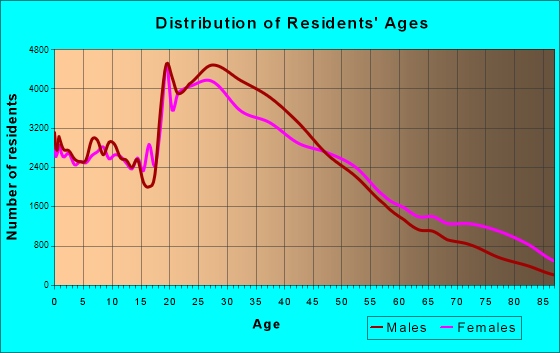
Total population: 456,002 (Urban population: 416,604, Rural population: 25 (all nonfarm) )
Houses: 260,102 (236,202 occupied: 108,180 owner occupied, 128,022 renter occupied )
% of renters here:
54%State:
34%
Housing density: 1,974 houses/condos per square mile
Median price asked for vacant for-sale houses and condos in 2022: $319,786.
Median contract rent in 2022: $1,477 (lower quartile is $929, upper quartile is $1,928)
Median rent asked for vacant for-rent units in 2022: $1,720
Median gross rent in Atlanta, GA in 2022: $1,611
Housing units in Atlanta with a mortgage: 77,859 (7,591 second mortgage, 236 home equity loan, 5,239 both second mortgage and home equity loan )Houses without a mortgage: 1,357
Median household income for houses/condos with a mortgage: $140,859
Median household income for apartments without a mortgage: $95,446
Median monthly housing costs: $1,650
Data:
Median house or condo value ($)
Median house or condo value ($ change since 2000)
Median house or condo value ($) - White
Median house or condo value ($) - Black or African American
Median house or condo value ($) - Asian
Median house or condo value ($) - Hispanic or Latino
Median house or condo value ($) - American Indian and Alaska Native
Median house or condo value ($) - Multirace
Median house or condo value ($) - Other Race
Median price asked for mobile homes ($)
Household density (households per square mile)
Mean house or condo value by units in structure - 1, detached ($)
Mean house or condo value by units in structure - 1, attached ($)
Mean house or condo value by units in structure - 2 ($)
Mean house or condo value by units in structure by units in structure - 3 or 4 ($)
Mean house or condo value by units in structure - 5 or more ($)
Mean house or condo value by units in structure - Boat, RV, van, etc. ($)
Mean house or condo value by units in structure - Mobile home ($)
Median contract rent ($)
Median contract rent - Lower quartile ($)
Median contract rent - Upper quartile ($)
Median gross rent ($)
Urban houses (%)
Rural houses (%)
Houses occupied (%)
Houses occupied (% change since 2000)
Houses owner occupied (%)
Houses owner occupied (% change since 2000)
Houses renter occupied (%)
Houses renter occupied (% change since 2000)
Vacant housing units - For rent (%)
Vacant housing units - For rent (% change since 2000)
Vacant housing units - For sale only (%)
Vacant housing units - For sale only (% change since 2000)
Vacant housing units - Rented or sold, not occupied (%)
Vacant housing units - Rented or sold, not occupied (% change since 2000)
Vacant housing units - For seasonal, recreational, or occasional use (%)
Vacant housing units - For seasonal, recreational, or occasional use (% change since 2000)
Vacant housing units - For migrant workers (%)
Vacant housing units - For migrant workers (% change since 2000)
Vacant housing units - Other vacant (%)
Vacant housing units - Other vacant (% change since 2000)
Median monthly housing costs ($)
Median household income for houses/condos with a mortgage ($)
Median household income for houses/condos without a mortgage ($)
Median household income ($)
Median household income ($) - White
Median household income ($) - Black or African American
Median household income ($) - Asian
Median household income ($) - Hispanic or Latino
Median household income ($) - American Indian and Alaska Native
Median household income ($) - Multirace
Median household income ($) - Other Race
Mortgage status - with mortgage (%)
Mortgage status - with second mortgage (%)
Mortgage status - with home equity loan (%)
Mortgage status - with both second mortgage and home equity loan (%)
Mortgage status - without a mortgage (%)
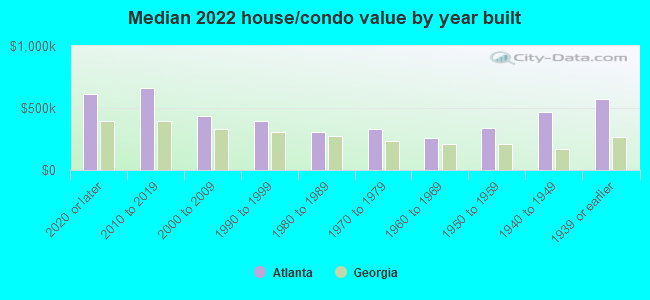
Median year house/condo built
Median year apartment built
Household type by relationship - Male householder living alone (%)
Household type by relationship - Male householder not living alone (%)
Household type by relationship - Female householder living alone (%)
Household type by relationship - Female householder not living alone (%)
Household type by relationship - Opposite-Sex spouse (%)
Household type by relationship - Same-Sex spouse (%)
Household type by relationship - Opposite-Sex unmarried partner (%)
Household type by relationship - Same-Sex unmarried partner (%)
Household type by relationship - In group quarters (%)
Size of family households - 2-person household (%)
Size of family households - 3-person household (%)
Size of family households - 4-person household (%)
Size of family households - 5-person household (%)
Size of family households - 6-person household (%)
Size of family households - 7-or-more-person household (%)
Size of nonfamily households - 1-person household (%)
Size of nonfamily households - 2-person household (%)
Size of nonfamily households - 3-person household (%)
Size of nonfamily households - 4-person household (%)
Size of nonfamily households - 5-person household (%)
Size of nonfamily households - 6-person household (%)
Size of nonfamily households - 7-or-moreperson household (%)
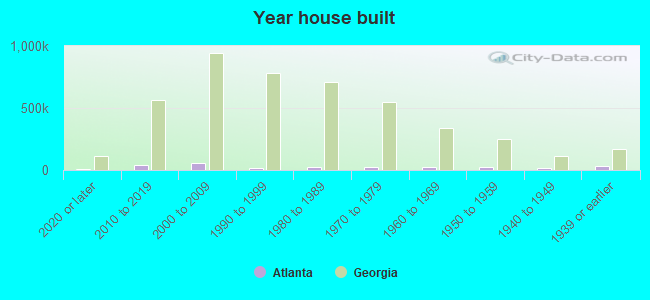
Year house built - Built 2010 or later (%)
Year house built - Built 2000 to 2009 (%)
Year house built - Built 1990 to 1999 (%)
Year house built - Built 1980 to 1989 (%)
Year house built - Built 1970 to 1979 (%)
Year house built - Built 1960 to 1969 (%)
Year house built - Built 1950 to 1959 (%)
Year house built - Built 1940 to 1949 (%)
Year house built - Built 1939 or earlier (%)
Median number of rooms in houses and condos
Median number of rooms in apartments
Median number of bedrooms in owner occupied houses
Mean number of bedrooms in owner occupied houses
Median number of bedrooms in renter occupied houses
Mean number of bedrooms in renter occupied houses
Median number of vehichles in owner occupied houses
Mean number of vehichles in owner occupied houses
Median number of vehichles in renter occupied houses
Mean number of vehichles in renter occupied houses
Rooms in owner-occupied houses - 1 room (%)
Rooms in owner-occupied houses - 2 rooms (%)
Rooms in owner-occupied houses - 3 rooms (%)
Rooms in owner-occupied houses - 4 rooms (%)
Rooms in owner-occupied houses - 5 rooms (%)
Rooms in owner-occupied houses - 6 rooms (%)
Rooms in owner-occupied houses - 7 rooms (%)
Rooms in owner-occupied houses - 8 rooms (%)
Rooms in owner-occupied houses - 9+ rooms (%)
Rooms in renter-occupied houses - 1 room (%)
Rooms in renter-occupied houses - 2 rooms (%)
Rooms in renter-occupied houses - 3 rooms (%)
Rooms in renter-occupied houses - 4 rooms (%)
Rooms in renter-occupied houses - 5 rooms (%)
Rooms in renter-occupied houses - 6 rooms (%)
Rooms in renter-occupied houses - 7 rooms (%)
Rooms in renter-occupied houses - 8 rooms (%)
Rooms in renter-occupied houses - 9+ rooms (%)
Bedrooms in owner-occupied houses - no bedrooms (%)
Bedrooms in owner-occupied houses - 1 bedroom (%)
Bedrooms in owner-occupied houses - 2 bedrooms (%)
Bedrooms in owner-occupied houses - 3 bedrooms (%)
Bedrooms in owner-occupied houses - 4 bedrooms (%)
Bedrooms in owner-occupied houses - 5+ bedrooms (%)
Bedrooms in renter-occupied houses - no bedrooms (%)
Bedrooms in renter-occupied houses - 1 bedroom (%)
Bedrooms in renter-occupied houses - 2 bedrooms (%)
Bedrooms in renter-occupied houses - 3 bedrooms (%)
Bedrooms in renter-occupied houses - 4 bedrooms (%)
Bedrooms in renter-occupied houses - 5+ bedrooms (%)
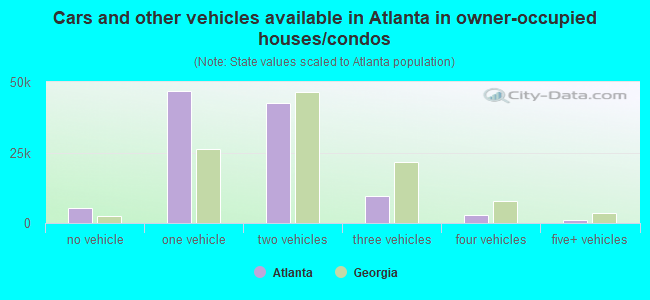
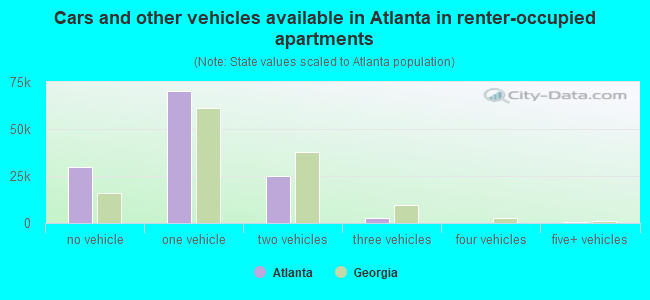
Vehicles available in owner-occupied houses - no vehicle available (%)
Vehicles available in owner-occupied houses - 1 vehicle available(%)
Vehicles available in owner-occupied houses - 2 Vehicles available (%)
Vehicles available in owner-occupied houses - 3 Vehicles available (%)
Vehicles available in owner-occupied houses - 4 Vehicles available (%)
Vehicles available in owner-occupied houses - 5+ Vehicles available (%)
Vehicles available in renter-occupied houses - no vehicle available (%)
Vehicles available in renter-occupied houses - 1 vehicle available (%)
Vehicles available in renter-occupied houses - 2 Vehicles available (%)
Vehicles available in renter-occupied houses - 3 Vehicles available (%)
Vehicles available in renter-occupied houses - 4 Vehicles available (%)
Vehicles available in renter-occupied houses - 5+ Vehicles available (%)
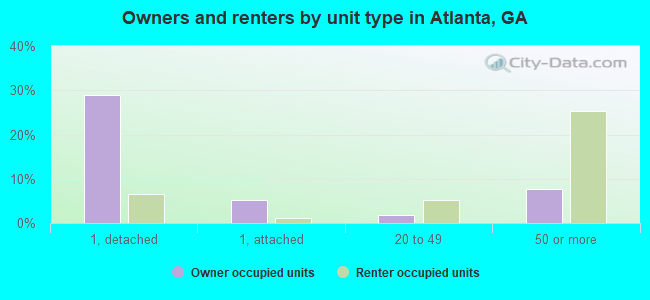
Housing units in structures - 1, detached (%)
Housing units in structures - 1, attached (%)
Housing units in structures - 2 (%)
Housing units in structures - 3 or 4 (%)
Housing units in structures - 5 to 9 (%)
Housing units in structures - 10 to 19 (%)
Housing units in structures - 20 to 49 (%)
Housing units in structures - 50 or more (%)
Housing units in structures - Mobile home (%)
Housing units in structures - Boat, RV, van, etc. (%)
Housing units in structures - Owners - 1, detached (%)
Housing units in structures - Owners - 1, attached (%)
Housing units in structures - Owners - 2 (%)
Housing units in structures - Owners - 3 or 4 (%)
Housing units in structures - Owners - 5 to 9 (%)
Housing units in structures - Owners - 10 to 19 (%)
Housing units in structures - Owners - 20 to 49 (%)
Housing units in structures - Owners - 50 or more (%)
Housing units in structures - Owners - Mobile home (%)
Housing units in structures - Owners - Boat, RV, van, etc. (%)
Housing units in structures - Renters - 1, detached (%)
Housing units in structures - Renters - 1, attached (%)
Housing units in structures - Renters - 2 (%)
Housing units in structures - Renters - 3 or 4 (%)
Housing units in structures - Renters - 5 to 9 (%)
Housing units in structures - Renters - 10 to 19 (%)
Housing units in structures - Renters - 20 to 49 (%)
Housing units in structures - Renters - 50 or more (%)
Housing units in structures - Renters - Mobile home (%)
Housing units in structures - Renters - Boat, RV, van, etc. (%)
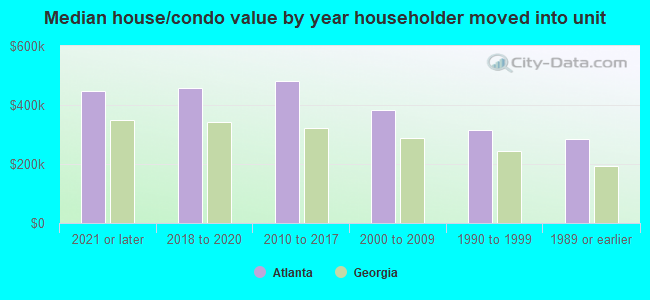
House/condo owner moved in on average (years ago)
Renter moved in on average (years ago)
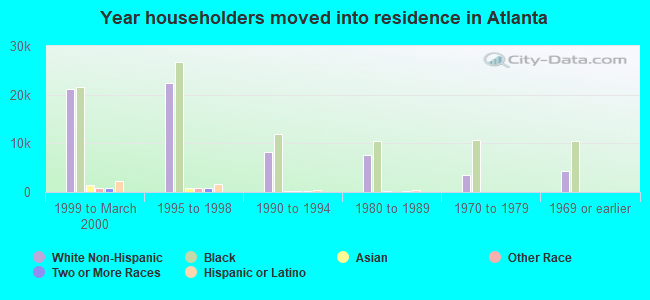
Year householder moved into unit - Moved in 1999 to March 2000 (%)
Year householder moved into unit - Moved in 1999 to March 2000 (%) - White
Year householder moved into unit - Moved in 1999 to March 2000 (%) - Black or African American
Year householder moved into unit - Moved in 1999 to March 2000 (%) - Asian
Year householder moved into unit - Moved in 1999 to March 2000 (%) - Hispanic or Latino
Year householder moved into unit - Moved in 1999 to March 2000 (%) - American Indian and Alaska Native
Year householder moved into unit - Moved in 1999 to March 2000 (%) - Multirace
Year householder moved into unit - Moved in 1999 to March 2000 (%) - Other Race
Year householder moved into unit - Moved in 1995 to 1998 (%)
Year householder moved into unit - Moved in 1995 to 1998 (%) - White
Year householder moved into unit - Moved in 1995 to 1998 (%) - Black or African American
Year householder moved into unit - Moved in 1995 to 1998 (%) - Asian
Year householder moved into unit - Moved in 1995 to 1998 (%) - Hispanic or Latino
Year householder moved into unit - Moved in 1995 to 1998 (%) - American Indian and Alaska Native
Year householder moved into unit - Moved in 1995 to 1998 (%) - Multirace
Year householder moved into unit - Moved in 1995 to 1998 (%) - Other Race
Year householder moved into unit - Moved in 1990 to 1994 (%)
Year householder moved into unit - Moved in 1990 to 1994 (%) - White
Year householder moved into unit - Moved in 1990 to 1994 (%) - Black or African American
Year householder moved into unit - Moved in 1990 to 1994 (%) - Asian
Year householder moved into unit - Moved in 1990 to 1994 (%) - Hispanic or Latino
Year householder moved into unit - Moved in 1990 to 1994 (%) - American Indian and Alaska Native
Year householder moved into unit - Moved in 1990 to 1994 (%) - Multirace
Year householder moved into unit - Moved in 1990 to 1994 (%) - Other Race
Year householder moved into unit - Moved in 1980 to 1989 (%)
Year householder moved into unit - Moved in 1980 to 1989 (%) - White
Year householder moved into unit - Moved in 1980 to 1989 (%) - Black or African American
Year householder moved into unit - Moved in 1980 to 1989 (%) - Asian
Year householder moved into unit - Moved in 1980 to 1989 (%) - Hispanic or Latino
Year householder moved into unit - Moved in 1980 to 1989 (%) - American Indian and Alaska Native
Year householder moved into unit - Moved in 1980 to 1989 (%) - Multirace
Year householder moved into unit - Moved in 1980 to 1989 (%) - Other Race
Year householder moved into unit - Moved in 1970 to 1979 (%)
Year householder moved into unit - Moved in 1970 to 1979 (%) - White
Year householder moved into unit - Moved in 1970 to 1979 (%) - Black or African American
Year householder moved into unit - Moved in 1970 to 1979 (%) - Asian
Year householder moved into unit - Moved in 1970 to 1979 (%) - Hispanic or Latino
Year householder moved into unit - Moved in 1970 to 1979 (%) - American Indian and Alaska Native
Year householder moved into unit - Moved in 1970 to 1979 (%) - Multirace
Year householder moved into unit - Moved in 1970 to 1979 (%) - Other Race
Year householder moved into unit - Moved in 1969 or earlier (%)
Year householder moved into unit - Moved in 1969 or earlier (%) - White
Year householder moved into unit - Moved in 1969 or earlier (%) - Black or African American
Year householder moved into unit - Moved in 1969 or earlier (%) - Asian
Year householder moved into unit - Moved in 1969 or earlier (%) - Hispanic or Latino
Year householder moved into unit - Moved in 1969 or earlier (%) - American Indian and Alaska Native
Year householder moved into unit - Moved in 1969 or earlier (%) - Multirace
Year householder moved into unit - Moved in 1969 or earlier (%) - Other Race
Housing units lacking complete plumbing facilities (%)
Housing units lacking complete kitchen facilities (%)
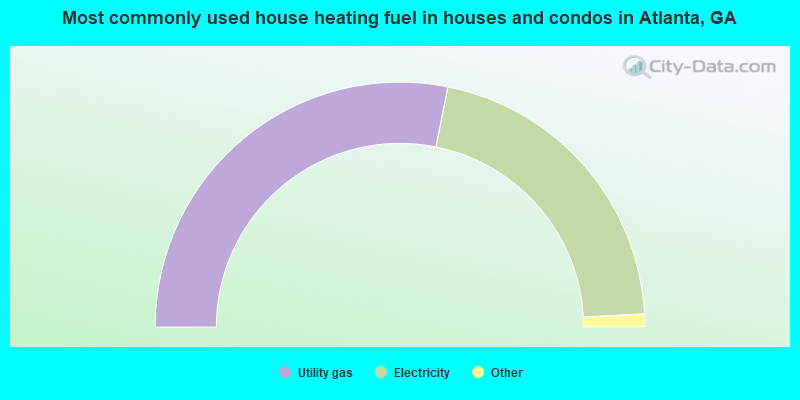
House heating fuel used in houses and condos - Utility gas (%)
House heating fuel used in houses and condos - Bottled, tank, or LP gas (%)
House heating fuel used in houses and condos - Electricity (%)
House heating fuel used in houses and condos - Fuel oil, kerosene, etc. (%)
House heating fuel used in houses and condos - Coal or coke (%)
House heating fuel used in houses and condos - Wood (%)
House heating fuel used in houses and condos - Solar energy (%)
House heating fuel used in houses and condos - Other fuel (%)
House heating fuel used in houses and condos - No fuel used (%)
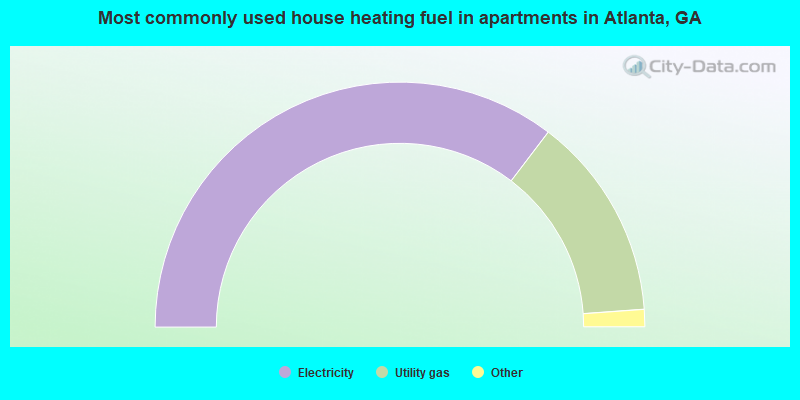
House heating fuel used in apartments - Utility gas (%)
House heating fuel used in apartments - Bottled, tank, or LP gas (%)
House heating fuel used in apartments - Electricity (%)
House heating fuel used in apartments - Fuel oil, kerosene, etc. (%)
House heating fuel used in apartments - Coal or coke (%)
House heating fuel used in apartments - Wood (%)
House heating fuel used in apartments - Solar energy (%)
House heating fuel used in apartments - Other fuel (%)
House heating fuel used in apartments - No fuel used (%)
Latest news about housing in Atlanta, GA collected exclusively by city-data.com from local newspapers, TV, and radio stations
Median year house/condo built: 1979Median year apartment built: 1995Household type by relationship:
Households: 499,121
Male householders: 107,269 (49,516 living alone ), Female householders: 128,933 (61,463 living alone )59,965 spouses (55,847 opposite-sex spouses ), 19,448 unmarried partners , (16,527 opposite-sex unmarried partners ), 107,554 children (104,274 natural , 1,568 adopted , 1,712 stepchildren ), 7,452 grandchildren , 5,787 brothers or sisters , 3,483 parents , 0 foster children , 5,030 other relatives , 24,521 non-relatives In group quarters: 29,679
Size of family households: 49,270 2-persons , 22,406 3-persons , 15,154 4-persons , 5,754 5-persons , 1,373 6-persons , 1,132 7-or-more-persons .
Size of nonfamily households: 110,979 1-person , 25,818 2-persons , 3,387 3-persons , 616 4-persons , 269 5-persons , 44 7-or-more-persons .
38,001 married couples with children. single-parent households (3,569 men , 36,028 women ).
89.1% of residents of Atlanta speak English at home. of residents speak Spanish at home (72% speak English very well , 13% speak English well , 11% speak English not well , 5% don't speak English at all ).of residents speak other Indo-European language at home (82% speak English very well , 14% speak English well , 3% speak English not well ).of residents speak Asian or Pacific Island language at home (69% speak English very well , 21% speak English well , 9% speak English not well , 1% don't speak English at all ).of residents speak other language at home (71% speak English very well , 23% speak English well , 6% speak English not well ).
Foreign born population: 42,609 (8.5%)of them are naturalized citizens )
Median number of rooms in houses and condos:
Median number of rooms in apartments
Owner-occupied Renter-occupied
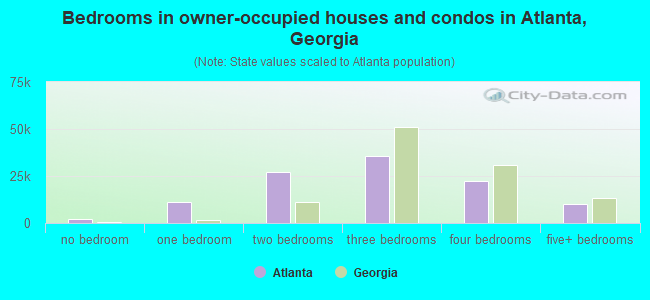
Bedrooms in owner-occupied houses and condos in Atlanta, Georgia
2,107 no bedroom 11,306 1 bedroom 26,944 2 bedrooms 35,655 3 bedrooms 22,316 4 bedrooms 9,852 5+ bedrooms
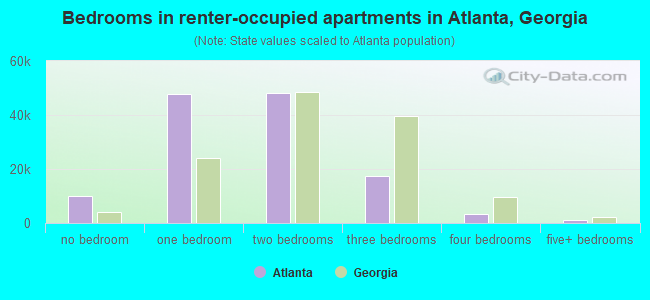
Bedrooms in renter-occupied apartments in Atlanta, Georgia
10,045 no bedroom 47,798 1 bedroom 48,162 2 bedrooms 17,448 3 bedrooms 3,301 4 bedrooms 1,268 5+ bedrooms
Owner-occupied Renter-occupied
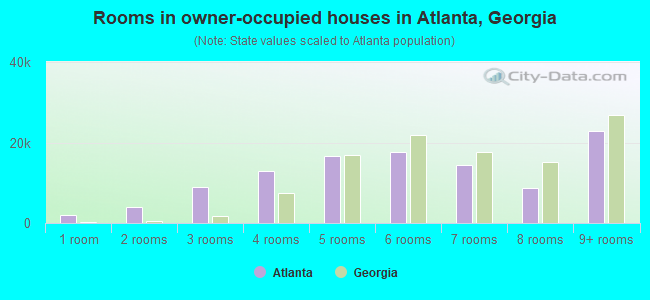
Rooms in owner-occupied houses in Atlanta, Georgia
1,992 1 room 4,057 2 rooms 8,895 3 rooms 12,972 4 rooms 16,563 5 rooms 17,664 6 rooms 14,394 7 rooms 8,810 8 rooms 22,833 9+ rooms
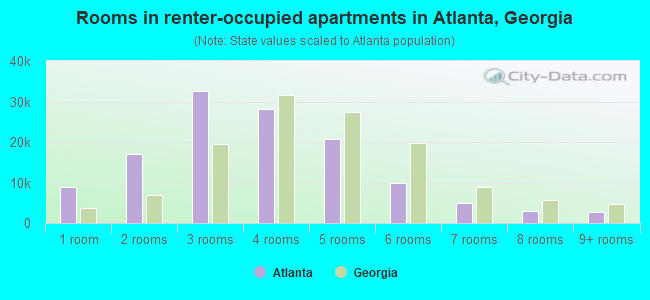
Rooms in renter-occupied apartments in Atlanta, Georgia
8,997 1 room 16,992 2 rooms 32,617 3 rooms 28,194 4 rooms 20,705 5 rooms 9,947 6 rooms 5,033 7 rooms 2,942 8 rooms 2,595 9+ rooms
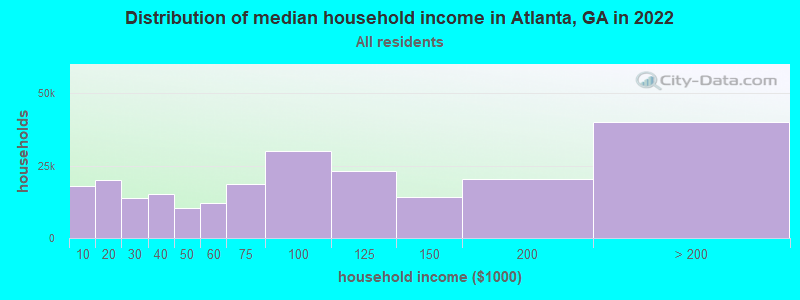
Atlanta, GA household income distribution 17,855 Less than $10,00020,049 $10,000 to $19,99913,918 $20,000 to $29,99915,291 $30,000 to $39,99910,321 $40,000 to $49,99912,031 $50,000 to $59,99918,538 $60,000 to $74,99930,167 $75,000 to $99,99923,287 $100,000 to $124,99914,314 $125,000 to $149,99920,307 $150,000 to $199,99940,124 $200,000 or more
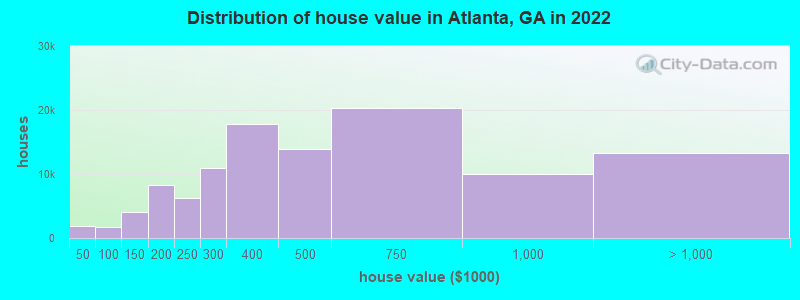
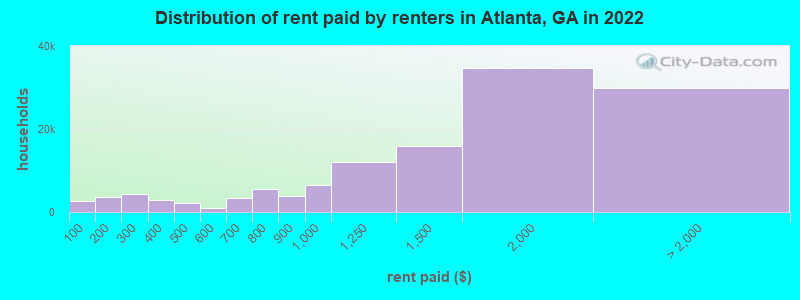
Home value of owner - occupied houses in 2022 in Atlanta, GA 632 Less than $10,000121 $10,000 to $14,999224 $15,000 to $19,999105 $20,000 to $24,999122 $25,000 to $29,999149 $30,000 to $34,999249 $35,000 to $39,999235 $40,000 to $49,999154 $50,000 to $59,999140 $60,000 to $69,999325 $70,000 to $79,999274 $80,000 to $89,999535 $90,000 to $99,9992,328 $100,000 to $124,9991,744 $125,000 to $149,9993,743 $150,000 to $174,9994,512 $175,000 to $199,9996,276 $200,000 to $249,99910,949 $250,000 to $299,99917,875 $300,000 to $399,99913,830 $400,000 to $499,99920,295 $500,000 to $749,99910,028 $750,000 to $999,9996,283 $1,000,000 to $1,499,9993,300 $1,500,000 to $1,999,9993,752 $2,000,000 or moreRent paid by renters in 2022 in Atlanta, GA 2,570 Less than $1002,277 $100 to $1491,225 $150 to $1991,848 $200 to $2492,488 $250 to $2992,444 $300 to $349512 $350 to $3991,510 $400 to $449741 $450 to $499617 $500 to $549402 $550 to $5991,522 $600 to $6491,756 $650 to $6991,477 $700 to $7494,060 $750 to $7993,797 $800 to $8996,411 $900 to $99912,025 $1,000 to $1,24915,938 $1,250 to $1,49934,615 $1,500 to $1,99914,841 $2,000 to $2,4995,123 $2,500 to $2,9993,054 $3,000 to $3,4993,047 $3,500 or more3,722 No cash rent
Percentage of workers working in this county: 76.4%Number of people working at home: 82,142 (29.8% of all workers )
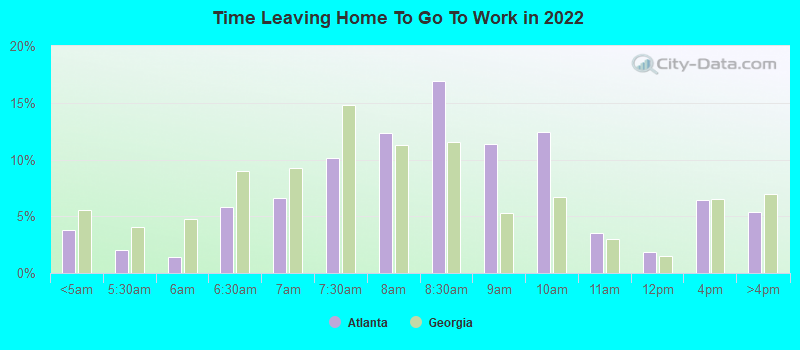
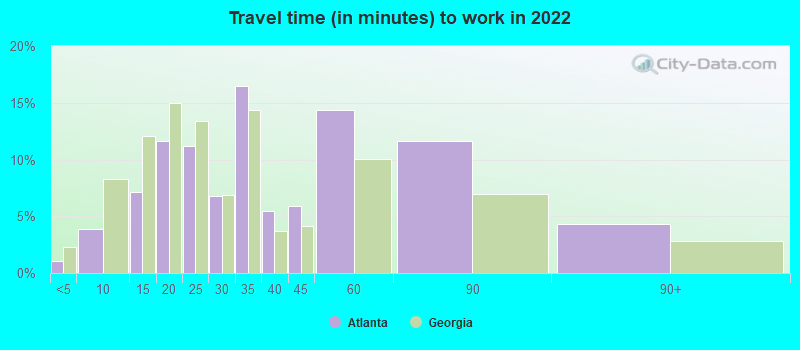
Travel time to work (commute)
Less than 5 minutes: 2,9745 to 9 minutes: 12,23110 to 14 minutes: 21,80615 to 19 minutes: 34,30420 to 24 minutes: 35,78225 to 29 minutes: 13,89530 to 34 minutes: 29,94435 to 39 minutes: 7,10340 to 44 minutes: 8,64645 to 59 minutes: 11,93360 to 89 minutes: 9,79690 or more minutes: 5,485
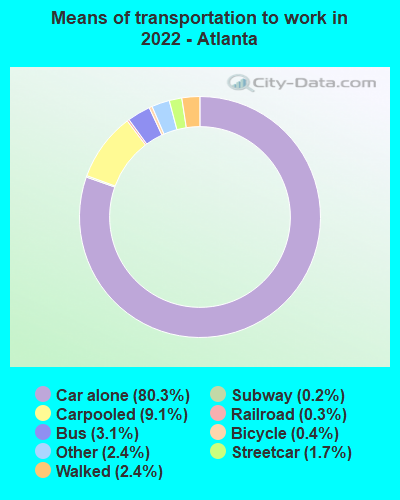
Means of transportation to work:
Drove a car alone: 355,283 (67.7%)Carpooled: 40,433 (7.7%)Bus : 13,768 (2.6%)Subway or elevated rail : 7,672 (1.5%)Long-distance train or commuter rail : 944 (0.2%)Light rail, streetcar or trolley : 1,263 (0.2%)Taxi: 10,652 (2.0%)Bicycle: 1,982 (0.4%)Walked: 10,575 (2.0%)Worked at home: 82,142 (15.7%)
Unemployment by race in 2022
Unemployment rate for White non-Hispanic residents 2.0% Males2.3% FemalesUnemployment rate for Black residents 7.7% Males8.5% FemalesUnemployment rate for American Indian and Alaska Native residents 2.5% FemalesUnemployment rate for Asian residents 0.6% Males1.4% FemalesUnemployment rate for other race residents 4.9% Males6.9% FemalesUnemployment rate for two or more race residents 4.7% Males3.9% FemalesUnemployment rate for Hispanic or Latino residents 7.9% Males4.5% Females
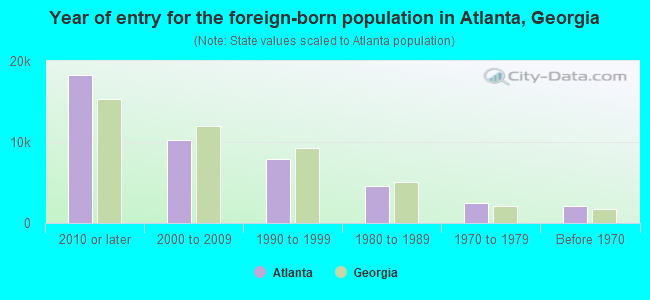
Year of entry for the foreign-born population in Atlanta, Georgia
18,232 2010 or later 10,247 2000 to 2009 7,928 1990 to 1999 4,538 1980 to 1989 2,435 1970 to 1979 2,053 Before 1970
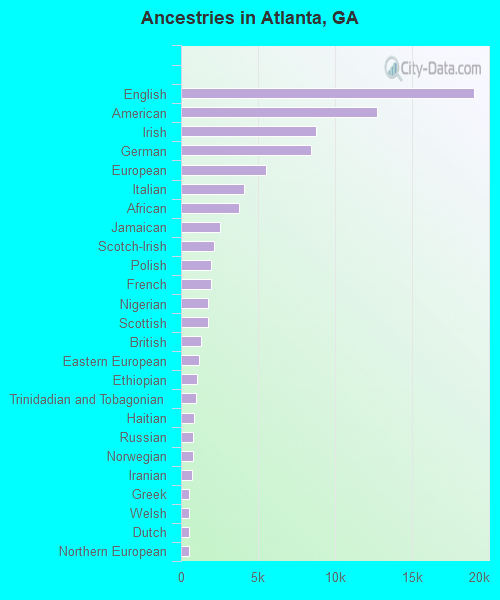
First ancestries reported:
English: 19,057 (6.6%)
American: 12,750 (4.4%)
Irish: 8,803 (3.1%)
German: 8,474 (2.9%)
European: 5,524 (1.9%)
Italian: 4,116 (1.4%)
African: 3,743 (1.3%)
Jamaican: 2,523 (0.9%)
Scotch-Irish: 2,136 (0.7%)
Polish: 1,960 (0.7%)
French: 1,926 (0.7%)
Nigerian: 1,745 (0.6%)
Scottish: 1,726 (0.6%)
British: 1,293 (0.4%)
Eastern European: 1,186 (0.4%)
Ethiopian: 1,061 (0.4%)
Trinidadian and Tobagonian: 1,005 (0.3%)
Haitian: 864 (0.3%)
Russian: 802 (0.3%)
Norwegian: 767 (0.3%)
Iranian: 728 (0.3%)
Greek: 551 (0.2%)
Welsh: 538 (0.2%)
Dutch: 524 (0.2%)
Northern European: 513 (0.2%)
Senegalese: 465 (0.2%)
Swedish: 438 (0.2%)
Ghanaian: 420 (0.1%)
Portuguese: 320 (0.1%)
Brazilian: 314 (0.1%)
Egyptian: 304 (0.1%)
French Canadian: 300 (0.1%)
Scandinavian: 297 (0.1%)
Canadian: 293 (0.1%)
Hungarian: 286 (0.10%)
West Indian: 286 (0.10%)
Romanian: 273 (0.09%)
South African: 259 (0.09%)
Guyanese: 259 (0.09%)
Ukrainian: 249 (0.09%)
Latvian: 232 (0.08%)
Lithuanian: 196 (0.07%)
Danish: 184 (0.06%)
Lebanese: 183 (0.06%)
British West Indian: 174 (0.06%)
Turkish: 172 (0.06%)
Austrian: 154 (0.05%)
Czech: 148 (0.05%)
Finnish: 148 (0.05%)
Moroccan: 143 (0.05%)
Kenyan: 132 (0.05%)
Slovak: 128 (0.04%)
Armenian: 118 (0.04%)
Swiss: 108 (0.04%)
Yugoslavian: 105 (0.04%)
Syrian: 103 (0.04%)
Croatian: 93 (0.03%)
Czechoslovakian: 87 (0.03%)
Belgian: 68 (0.02%)
Liberian: 65 (0.02%)
Afghan: 65 (0.02%)
Cajun: 61 (0.02%)
Arab: 60 (0.02%)
Somali: 53 (0.02%)
Bahamian: 52 (0.02%)
Maltese: 51 (0.02%)
Bulgarian: 49 (0.02%)
U.S. Virgin Islander: 46 (0.02%)
Slavic: 45 (0.02%)
Cape Verdean: 43 (0.01%)
Israeli: 34 (0.01%)
Luxembourger: 30 (0.01%)
Sudanese: 26 (0.01%)
Palestinian: 21 (0.01%)
Cypriot: 19 (0.01%)
Iraqi: 18 (0.01%)
Most common places of birth for foreign-born residents (%): India Atlanta:
12.4% (5,283)Georgia:
9.2% (103,325)
China, excluding Hong Kong and Taiwan Atlanta:
9.1% (3,877)Georgia:
3.5% (39,227)
Mexico Atlanta:
7.6% (3,231)Georgia:
20.0% (223,400)
Korea Atlanta:
5.0% (2,138)Georgia:
3.9% (43,756)
Jamaica Atlanta:
3.8% (1,613)Georgia:
4.6% (51,270)
Canada Atlanta:
3.0% (1,254)Georgia:
1.6% (17,851)
France Atlanta:
2.9% (1,211)Georgia:
0.3% (3,777)
Japan Atlanta:
2.6% (1,095)Georgia:
0.7% (7,969)
Colombia Atlanta:
2.3% (992)Georgia:
2.1% (23,813)
Ethiopia Atlanta:
2.2% (923)Georgia:
1.6% (17,643)
Germany Atlanta:
2.1% (903)Georgia:
1.7% (18,651)
United Kingdom, excluding England and Scotland Atlanta:
2.0% (869)Georgia:
0.8% (9,101)
Nigeria Atlanta:
2.0% (829)Georgia:
2.5% (27,846)
Brazil Atlanta:
1.8% (762)Georgia:
1.6% (18,211)
Trinidad and Tobago Atlanta:
1.8% (756)Georgia:
0.8% (8,684)
Iran Atlanta:
1.7% (710)Georgia:
0.6% (6,717)
Place of birth for U.S.-born residents:
This state: 231,181Other state: 215,424Northeast: 50,675Midwest: 41,628South: 104,964West: 18,157 79.7% of Atlanta residents lived in the same house 1 years ago.
Out of people who lived in different houses, 25.9% lived in this county.
Out of people who lived in different counties, 50.7% lived in Georgia.
Atlanta:
79.7%State average:
86.6%
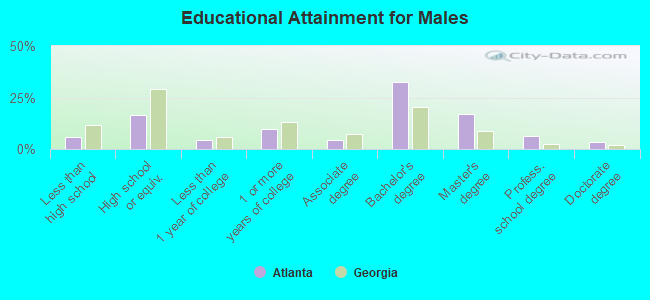
Education attainment for males 25 years and older:
No schooling: 1,034Nursery to 4th grade: 775th and 6th grade: 6177th and 8th grade: 1,5599th grade: 93510th grade: 65411th grade: 3,00412th grade, no diploma: 2,194High school graduate (or equivalency): 28,346Less than 1 year of college: 7,561Some college more than 1 year, no degree: 16,412Associate degree: 7,485Bachelor's degree: 55,343Master's degree: 28,992Professional school degree: 10,378Doctorate degree: 5,577
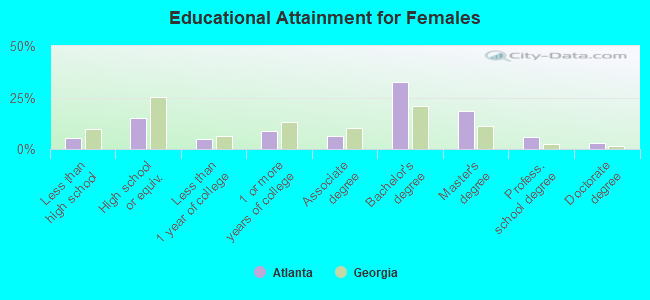
Education attainment for females 25 years and older:
No schooling: 1,090Nursery to 4th grade: 5405th and 6th grade: 6467th and 8th grade: 6489th grade: 73310th grade: 1,56311th grade: 1,54312th grade, no diploma: 2,744High school graduate (or equivalency): 26,348Less than 1 year of college: 8,514Some college more than 1 year, no degree: 15,437Associate degree: 11,479Bachelor's degree: 57,655Master's degree: 32,163Professional school degree: 10,109Doctorate degree: 5,259
Housing units in structures:
One, detached: 90,481One, attached: 16,050Two: 5,6123 or 4: 9,8815 to 9: 16,48410 to 19: 17,21520 to 49: 18,27450 or more: 85,304Mobile homes: 801Median worth of mobile homes: $98,526
Housing units lacking complete plumbing facilities in 2022: 1.4%Housing units lacking complete kitchen facilities in 2022: 1.6%House/condo owner moved in on average 7 years ago
Renter moved in on average 2 years ago
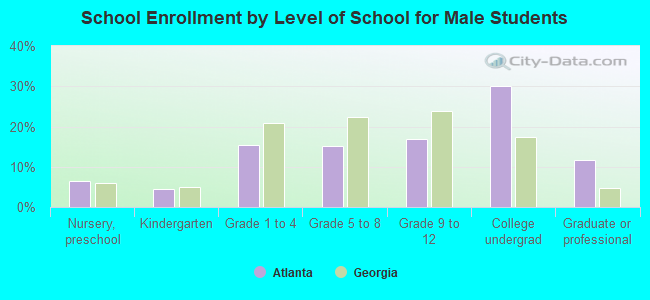
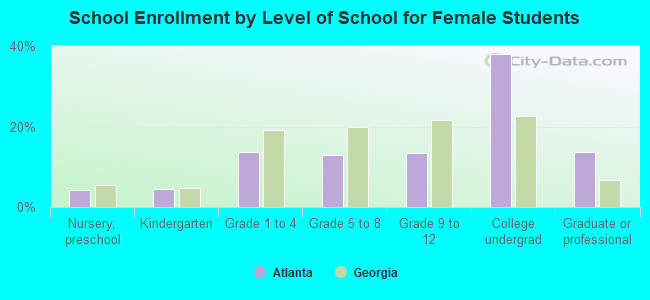
Private vs. public school enrollment:
Students in private schools in grades 1 to 8 (elementary and middle school): 6,760 Students in private schools in grades 9 to 12 (high school): 5,009 Students in private undergraduate colleges: 12,623