Avon, CT (Connecticut) Houses and Residents
| Avon: | $521,881 |
| Connecticut: | $347,200 |
Total population: 18,098 (Urban population: 14,650, Rural population: 1,182 (all nonfarm))
Houses: 6,480 (6,192 occupied: 5,311 owner occupied, 881 renter occupied)
| % of renters here: | 14% |
| State: | 34% |
Housing density: 280 houses/condos per square mile
Median price asked for vacant for-sale houses and condos in 2022 in this county: $360,195.
Median contract rent in 2022: $1,733 (lower quartile is $1,322, upper quartile is over $2,000)
Median rent asked for vacant for-rent units in 2022: $1,313
Median gross rent in Avon, CT in 2022: $1,907
Housing units in Avon with a mortgage: 3,643 (327 second mortgage, 537 home equity loan, 0 both second mortgage and home equity loan)
Houses without a mortgage: 1,079
Compare current foreclosures near Avon, CT:
| Photo | Address | Area | Beds / Baths | Price | Details |
|---|---|---|---|---|---|

|
#1
Reverknolls
Avon, CT 06001
|
2,798 sq. feet
|
3 baths 4 beds |
show details | |

|
#2
Haynes Rd
Avon, CT 06001
|
2,076 sq. feet
|
2 baths 4 beds |
show details | |

|
#3
Sunnyridge Rd
Avon, CT 06001
|
1,718 sq. feet
|
2 baths 3 beds |
show details | |

|
#4
Lovely St
Avon, CT 06001
|
1,080 sq. feet
|
1 baths 3 beds |
show details | |

|
#5
Wellington Hgts Rd
Avon, CT 06001
|
1,632 sq. feet
|
1 baths 2 beds |
show details | |

|
#6
Shirecrest
Avon, CT 06001
|
2,000 sq. feet
|
3 baths 2 beds |
show details | |

|
#7
Old Farms Xing
Avon, CT 06001
|
- sq. feet
|
- baths - beds |
show details | |

|
#8
Avonwood Rd Apt A8
Avon, CT 06001
|
- sq. feet
|
- baths - beds |
show details | |

|
#9
W Avon Rd
Avon, CT 06001
|
- sq. feet
|
- baths - beds |
show details | |

|
#10
Roosevelt St
New Britain, CT 06051
|
1,536 sq. feet
|
2 baths 3 beds |
$299,900
|
show details |
| Photo | Address | Area | Beds / Baths | Price | Details |
|---|---|---|---|---|---|

|
#11
Allen St
Bristol, CT 06010
|
1,092 sq. feet
|
1 baths 3 beds |
$215,000
|
show details |

|
#12
Woodbine St
Torrington, CT 06790
|
2,756 sq. feet
|
3 baths 6 beds |
$419,900
|
show details |

|
#13
Old New Hartford Rd
Winsted, CT 06098
|
1,560 sq. feet
|
1 baths 4 beds |
$319,900
|
show details |

|
#14
Spring St
Glastonbury, CT 06033
|
1,284 sq. feet
|
1 baths 3 beds |
$296,400
|
show details |

|
#15
Dowd Ave
Canton, CT 06019
|
1,190 sq. feet
|
1 baths 2 beds |
$239,900
|
show details |

|
#16
Peck St
Berlin, CT 06037
|
608 sq. feet
|
1 baths 1 beds |
$144,900
|
show details |

|
#17
Clinton Hill Rd
Wolcott, CT 06716
|
1,828 sq. feet
|
1 baths 3 beds |
$240,000
|
show details |

|
#18
Winthrop Blvd
Cromwell, CT 06416
|
1,092 sq. feet
|
1 baths 3 beds |
$220,000
|
show details |

|
#19
Newberry Rd
South Windsor, CT 06074
|
3,386 sq. feet
|
2 baths 4 beds |
$649,900
|
show details |

|
#20
Mountain Rd
Windsor, CT 06095
|
1,144 sq. feet
|
2 baths 3 beds |
$230,000
|
show details |
| Photo | Address | Area | Beds / Baths | Price | Details |
|---|---|---|---|---|---|

|
#21
Glendale Cir
Windsor Locks, CT 06096
|
1,277 sq. feet
|
1 baths 2 beds |
show details | |

|
#22
Carter Rd
Plymouth, CT 06782
|
2,192 sq. feet
|
2 baths 3 beds |
show details | |

|
#23
21 Webster St
New Britain, CT 06051
|
3 sq. feet
|
2 baths 6 beds |
show details | |

|
#24
White Pine Rd
Torrington, CT 06790
|
1,536 sq. feet
|
2 baths 3 beds |
show details | |

|
#25
Cheshire St
Hartford, CT 06114
|
3,279 sq. feet
|
2 baths 4 beds |
show details | |

|
#26
Elmira Ave
Torrington, CT 06790
|
1,242 sq. feet
|
2 baths 3 beds |
show details | |

|
#27
Butternut Ln
Rocky Hill, CT 06067
|
1,176 sq. feet
|
1 baths 2 beds |
show details | |

|
#28
Main St
Newington, CT 06111
|
1,512 sq. feet
|
1 baths 4 beds |
show details | |

|
#29
City Ave
New Britain, CT 06051
|
1,932 sq. feet
|
1 baths 3 beds |
show details | |

|
#30
Marcia Dr
Torrington, CT 06790
|
1,496 sq. feet
|
2 baths 4 beds |
show details |
| Photo | Address | Area | Beds / Baths | Price | Details |
|---|---|---|---|---|---|

|
#31
Horne Cir
Southington, CT 06489
|
1,902 sq. feet
|
2 baths 4 beds |
show details | |

|
#32
Bell Ct Apt C1
East Hartford, CT 06108
|
890 sq. feet
|
1 baths 2 beds |
show details | |

|
#33
Main St
Newington, CT 06111
|
1,880 sq. feet
|
1 baths 3 beds |
show details | |

|
#34
Hollister Dr
East Hartford, CT 06118
|
1,300 sq. feet
|
1 baths 3 beds |
show details | |

|
#35
Litchfield Rd
Harwinton, CT 06791
|
2,216 sq. feet
|
1 baths 3 beds |
show details | |

|
#36
Cornwall St
Hartford, CT 06112
|
1,248 sq. feet
|
1 baths 3 beds |
show details | |

|
#37
Kennedy Rd
Windsor, CT 06095
|
1,399 sq. feet
|
2 baths 4 beds |
show details | |

|
#38
Broadview Ter
Hartford, CT 06106
|
1,821 sq. feet
|
2 baths 7 beds |
show details | |

|
#39
237 Ridgefield Stree
Hartford, CT 06112
|
- sq. feet
|
3 baths 6 beds |
show details | |

|
#40
Harvest Ln
Windsor, CT 06095
|
1,322 sq. feet
|
2 baths 3 beds |
show details |
| Photo | Address | Area | Beds / Baths | Price | Details |
|---|---|---|---|---|---|

|
#41
Benton St
Winsted, CT 06098
|
1,109 sq. feet
|
2 baths 2 beds |
show details | |

|
#42
Farms Village Rd
Wethersfield, CT 06109
|
1,820 sq. feet
|
1 baths 4 beds |
show details | |

|
#43
Farmington Chase Cre
Farmington, CT 06032
|
1,317 sq. feet
|
1 baths 2 beds |
show details | |

|
#44
Hopkins Dr
Newington, CT 06111
|
1,371 sq. feet
|
2 baths 2 beds |
show details | |

|
#45
Pond St
New Britain, CT 06051
|
2,400 sq. feet
|
2 baths 6 beds |
show details | |

|
#46
Oakland Rd
South Windsor, CT 06074
|
1,040 sq. feet
|
1 baths 2 beds |
show details | |

|
#47
Deepwood Dr
Manchester, CT 06040
|
734 sq. feet
|
1 baths 2 beds |
show details | |

|
#48
Melinda Ln
Bristol, CT 06010
|
- sq. feet
|
2 baths 4 beds |
show details | |

|
#49
Churchill Dr
Newington, CT 06111
|
1,116 sq. feet
|
1 baths 2 beds |
show details | |

|
Check over 1 million property listings on Foreclosure.com!
|
browse all offers | |||
Latest news about housing in Avon, CT collected exclusively by city-data.com from local newspapers, TV, and radio stations


Household type by relationship:
Households: 865,787- In family households: 715,089 (143,179 male householders, 84,652 female householders)
161,327 spouses, 258,438 children (243,975 natural, 5,783 adopted, 8,680 stepchildren), 15,602 grandchildren, 8,779 brothers or sisters, 9,385 parents, foster children, 10,085 other relatives, 18,701 non-relatives
- In nonfamily households: 150,698 (54,155 male householders (41,831 living alone)), 68,868 female householders (58,693 living alone)), 27,675 nonrelatives
- In group quarters: 28,227 (15,383 institutionalized population)
135,700 married couples with children.
56,984 single-parent households (8,611 men, 48,373 women).
90.7% of residents of Avon speak English at home.
1.6% of residents speak Spanish at home (77% speak English very well, 13% speak English well, 10% speak English not well).
5.8% of residents speak other Indo-European language at home (79% speak English very well, 19% speak English well, 2% speak English not well).
1.7% of residents speak Asian or Pacific Island language at home (51% speak English very well, 22% speak English well, 27% speak English not well).
0.2% of residents speak other language at home (100% speak English very well).
Foreign born population: 1,802 (10.8%)
(78.0% of them are naturalized citizens)
| Here: | 7.5 |
| State: | 6.5 |
| Here: | 4.1 |
| State: | 4.0 |
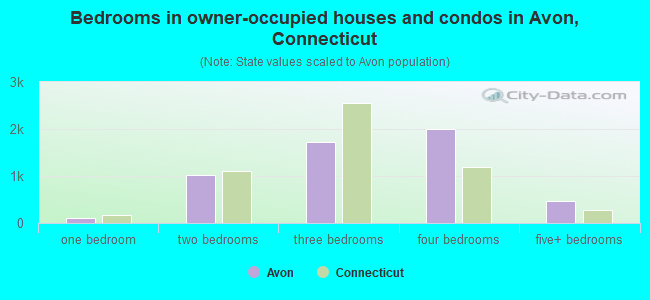
- Bedrooms in owner-occupied houses and condos in Avon, Connecticut
- 0no bedroom
- 1001 bedroom
- 1,0202 bedrooms
- 1,7213 bedrooms
- 1,9964 bedrooms
- 4745+ bedrooms
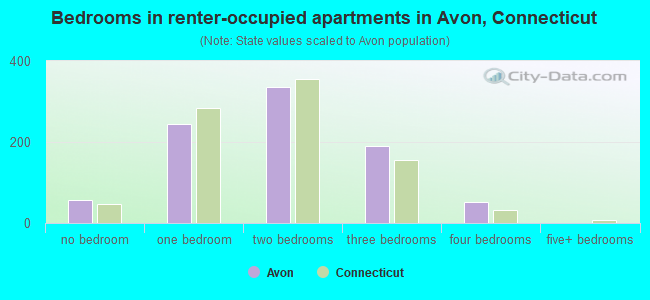
- Bedrooms in renter-occupied apartments in Avon, Connecticut
- 56no bedroom
- 2451 bedroom
- 3372 bedrooms
- 1903 bedrooms
- 534 bedrooms
- 05+ bedrooms
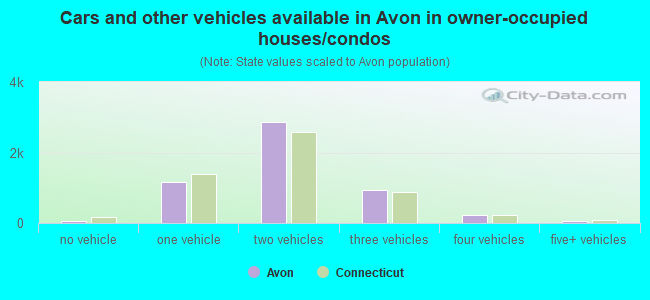
- Cars and other vehicles available in Avon in owner-occupied houses/condos
- 62no vehicle
- 1,1601 vehicle
- 2,8652 vehicles
- 9473 vehicles
- 2154 vehicles
- 625+ vehicles
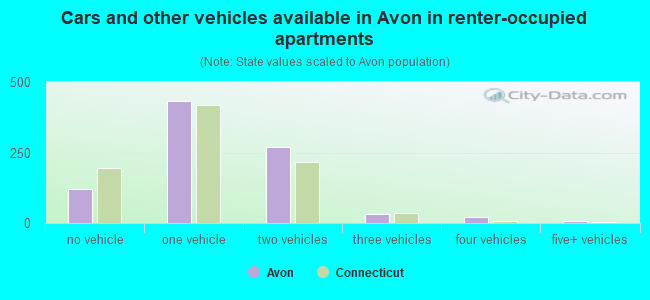
- Cars and other vehicles available in Avon in renter-occupied apartments
- 120no vehicle
- 4331 vehicle
- 2702 vehicles
- 313 vehicles
- 204 vehicles
- 75+ vehicles
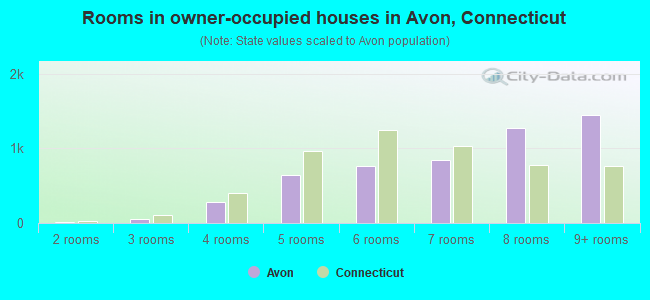
- Rooms in owner-occupied houses in Avon, Connecticut
- 01 room
- 152 rooms
- 503 rooms
- 2824 rooms
- 6385 rooms
- 7646 rooms
- 8467 rooms
- 1,2708 rooms
- 1,4469+ rooms
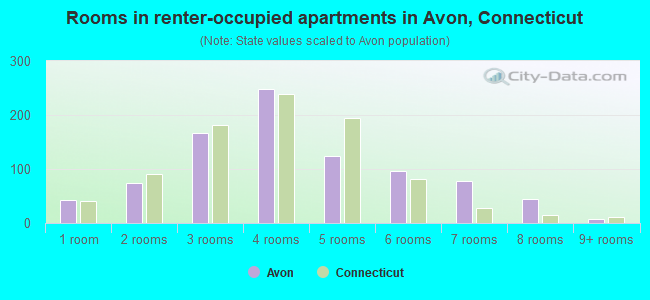
- Rooms in renter-occupied apartments in Avon, Connecticut
- 421 room
- 742 rooms
- 1663 rooms
- 2484 rooms
- 1255 rooms
- 966 rooms
- 777 rooms
- 458 rooms
- 89+ rooms
Avon, CT household income distribution

- 110,275Less than $10,000
- 126,206$10,000 to $19,999
- 140,796$20,000 to $29,999
- 123,435$30,000 to $39,999
- 124,409$40,000 to $49,999
- 120,195$50,000 to $59,999
- 163,375$60,000 to $74,999
- 257,289$75,000 to $99,999
- 195,680$100,000 to $124,999
- 156,081$125,000 to $149,999
- 212,056$150,000 to $199,999
- 306,743$200,000 or more
Percentage of workers working in this county: 86.3%
Number of people working at home: 1,381 (15.7% of all workers)
Travel time to work (commute)
- Less than 5 minutes: 184
- 5 to 9 minutes: 732
- 10 to 14 minutes: 1,211
- 15 to 19 minutes: 825
- 20 to 24 minutes: 1,204
- 25 to 29 minutes: 720
- 30 to 34 minutes: 1,305
- 35 to 39 minutes: 361
- 40 to 44 minutes: 301
- 45 to 59 minutes: 402
- 60 to 89 minutes: 142
- 90 or more minutes: 107
Means of transportation to work:
- Drove a car alone: 7,057 (88.8%)
- Carpooled: 299 (3.8%)
- Bus or trolley bus: 44 (0.6%)
- Subway or elevated: 7 (0.1%)
- Railroad: 7 (0.1%)
- Taxi: 8 (0.1%)
- Bicycle: 6 (0.1%)
- Walked: 45 (0.6%)
- Other means: 21 (0.3%)
- Worked at home: 449 (5.7%)
- Year of entry for the foreign-born population in Avon, Connecticut
- 2131995 to March 2000
- 1451990 to 1994
- 411985 to 1989
- 1491980 to 1984
- 911975 to 1979
- 1051970 to 1974
- 1041965 to 1969
- 323Before 1965
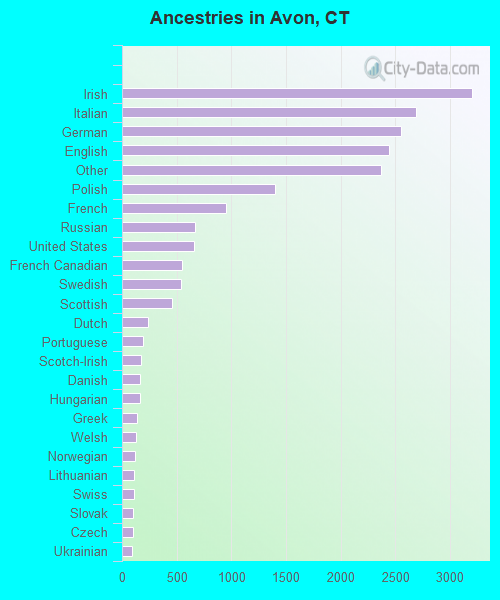
First ancestries reported:
- Irish: 3,198 (15.7%)
- Italian: 2,690 (13.2%)
- German: 2,557 (12.5%)
- English: 2,446 (12.0%)
- Other: 2,368 (11.6%)
- Polish: 1,401 (6.9%)
- French: 950 (4.7%)
- Russian: 667 (3.3%)
- United States: 655 (3.2%)
- French Canadian: 549 (2.7%)
- Swedish: 536 (2.6%)
- Scottish: 454 (2.2%)
- Dutch: 242 (1.2%)
- Portuguese: 192 (0.9%)
- Scotch-Irish: 173 (0.8%)
- Danish: 168 (0.8%)
- Hungarian: 167 (0.8%)
- Greek: 136 (0.7%)
- Welsh: 129 (0.6%)
- Norwegian: 119 (0.6%)
- Lithuanian: 110 (0.5%)
- Swiss: 106 (0.5%)
- Slovak: 104 (0.5%)
- Czech: 100 (0.5%)
- Ukrainian: 92 (0.5%)
- Arab: 48 (0.2%)
- West Indian: 37 (0.2%)
- Subsaharan African: 26 (0.1%)
Most common places of birth for foreign-born residents (%):
| Avon: | 9.1% (107) |
| Connecticut: | 5.2% (19,083) |
| Avon: | 8.0% (94) |
| Connecticut: | 6.9% (25,507) |
| Avon: | 7.3% (85) |
| Connecticut: | 7.0% (26,023) |
| Avon: | 6.4% (75) |
| Connecticut: | 4.1% (15,108) |
| Avon: | 6.1% (72) |
| Connecticut: | 4.4% (16,395) |
| Avon: | 5.5% (64) |
| Connecticut: | 1.5% (5,508) |
| Avon: | 4.4% (52) |
| Connecticut: | 0.9% (3,472) |
| Avon: | 4.2% (49) |
| Connecticut: | 2.5% (9,358) |
| Avon: | 3.8% (45) |
| Connecticut: | 0.6% (2,220) |
| Avon: | 3.8% (45) |
| Connecticut: | 1.4% (5,021) |
| Avon: | 3.4% (40) |
| Connecticut: | 3.6% (13,234) |
| Avon: | 3.2% (37) |
| Connecticut: | 2.1% (7,596) |
| Avon: | 2.9% (34) |
| Connecticut: | 3.1% (11,432) |
| Avon: | 2.0% (24) |
| Connecticut: | 1.1% (3,919) |
| Avon: | 2.0% (23) |
| Connecticut: | 1.7% (6,247) |
| Avon: | 1.8% (21) |
| Connecticut: | 3.2% (12,009) |
| Avon: | 1.7% (20) |
| Connecticut: | 1.8% (6,680) |
| Avon: | 1.6% (19) |
| Connecticut: | 0.3% (1,269) |
Place of birth for U.S.-born residents:
- This state: 7,511
- Other state: 7,016
- Northeast: 4,539
- Midwest: 1,090
- South: 993
- West: 394
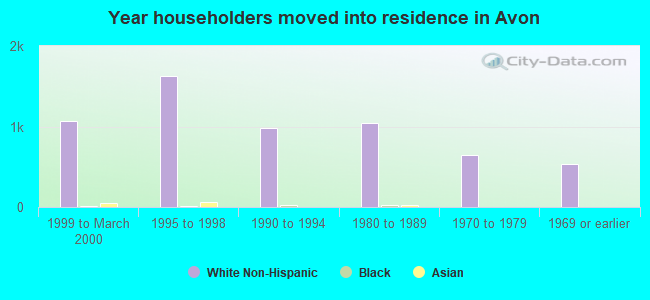
58% of Avon residents lived in the same house 5 years ago.
Out of people who lived in different houses, 58% lived in this county.
Out of people who lived in different counties, 30% lived in Connecticut.
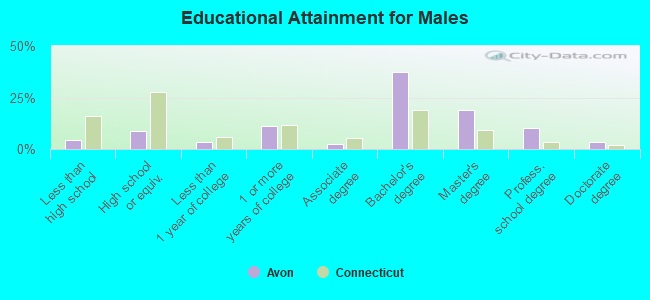
Education attainment for males 25 years and older:
- No schooling: 0
- Nursery to 4th grade: 14
- 5th and 6th grade: 0
- 7th and 8th grade: 27
- 9th grade: 29
- 10th grade: 45
- 11th grade: 53
- 12th grade, no diploma: 47
- High school graduate (or equivalency): 465
- Less than 1 year of college: 176
- Some college more than 1 year, no degree: 571
- Associate degree: 128
- Bachelor's degree: 1,950
- Master's degree: 974
- Professional school degree: 527
- Doctorate degree: 185
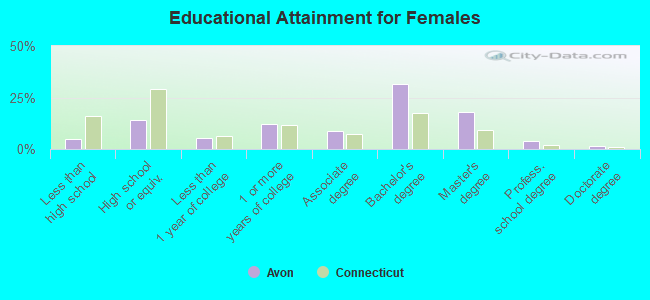
Education attainment for females 25 years and older:
- No schooling: 0
- Nursery to 4th grade: 0
- 5th and 6th grade: 17
- 7th and 8th grade: 96
- 9th grade: 74
- 10th grade: 26
- 11th grade: 22
- 12th grade, no diploma: 63
- High school graduate (or equivalency): 831
- Less than 1 year of college: 312
- Some college more than 1 year, no degree: 715
- Associate degree: 509
- Bachelor's degree: 1,864
- Master's degree: 1,074
- Professional school degree: 230
- Doctorate degree: 89
Housing units in structures:
- One, detached: 4,677
- One, attached: 628
- Two: 126
- 3 or 4: 471
- 5 to 9: 58
- 10 to 19: 86
- 20 to 49: 176
- 50 or more: 251
- Boats, RVs, vans, etc.: 7
Housing units lacking complete kitchen facilities: 0.2%
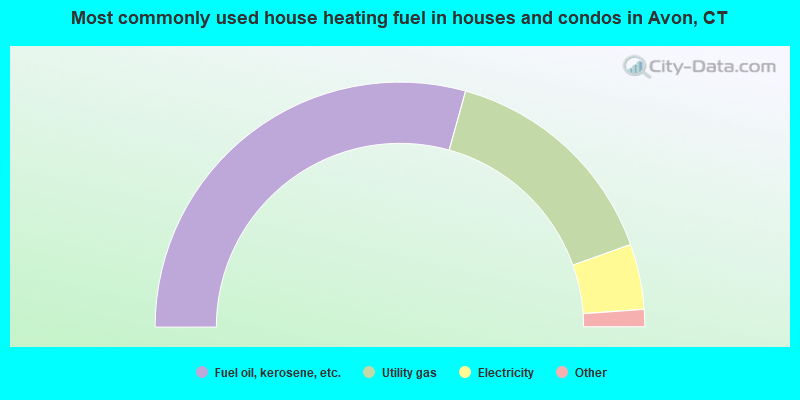
- 58.6%Fuel oil, kerosene, etc.
- 30.4%Utility gas
- 8.6%Electricity
- 1.3%Bottled, tank, or LP gas
- 0.9%Wood
- 0.2%Other fuel
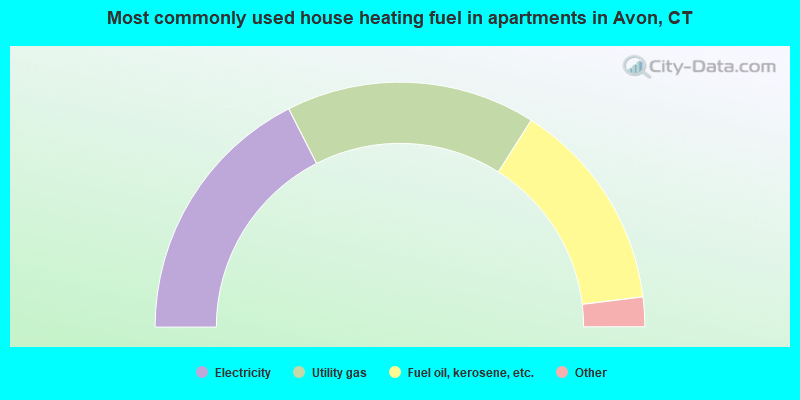
- 35.0%Electricity
- 33.0%Utility gas
- 28.1%Fuel oil, kerosene, etc.
- 2.2%Bottled, tank, or LP gas
- 0.9%Coal or coke
- 0.8%Other fuel
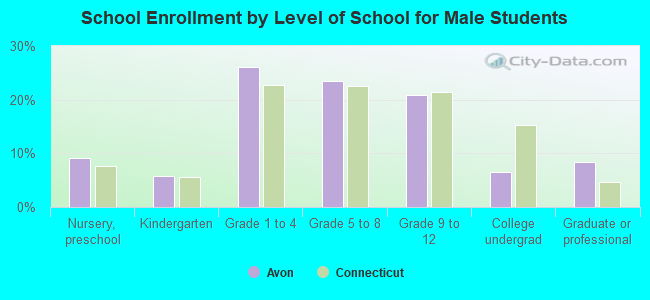
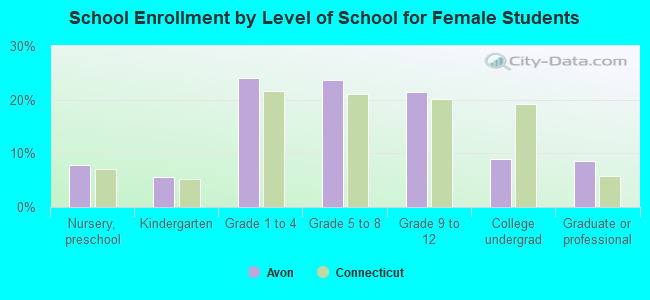
Private vs. public school enrollment:
| Here: | 4.3% |
| Connecticut: | 9.9% |
| Here: | 17.2% |
| Connecticut: | 11.0% |
| Here: | 26.3% |
| Connecticut: | 33.4% |