Baltimore, MD (Maryland) Houses and Residents
Estimated median house or condo value in 2022: $210,300 (it was $69,900 in 2000 )
Baltimore:
$210,300Maryland:
$398,100
Lower value quartile - upper value quartile: $127,000 - $317,400Mean price in 2022: Detached houses: $367,547 Here:
$367,547State:
$526,819
Townhouses or other attached units: $220,903 Here:
$220,903State:
$328,305
In 2-unit structures: $334,144 Here:
$334,144State:
$346,599
In 3-to-4-unit structures: $230,838 Here:
$230,838State:
$295,378
In 5-or-more-unit structures: $349,796 Here:
$349,796State:
$350,378
Mobile homes: $133,518 Here:
$133,518State:
$89,353
Occupied boats, RVs, vans, etc.: $352,745 Here:
$352,745State:
$254,500
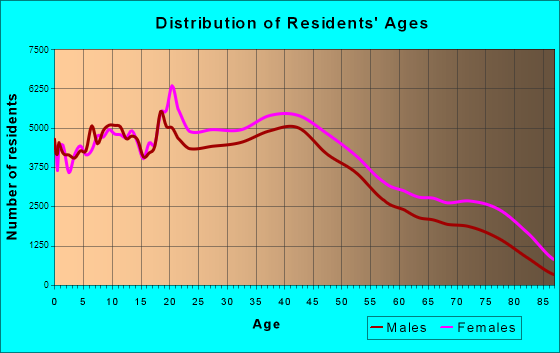
Total population: 622,793 (All urban)
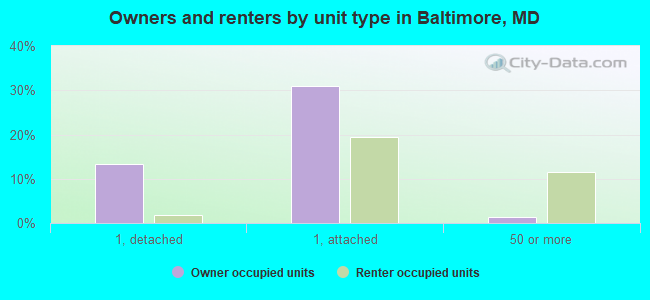
Houses: 293,879 (254,707 occupied: 121,217 owner occupied, 133,490 renter occupied )
% of renters here:
52%State:
32%
Housing density: 3,637 houses/condos per square mile
Median price asked for vacant for-sale houses and condos in 2022: $205,371.
Median contract rent in 2022: $1,043 (lower quartile is $737, upper quartile is $1,368)
Median rent asked for vacant for-rent units in 2022: $1,004
Median gross rent in Baltimore, MD in 2022: $1,235
Housing units in Baltimore with a mortgage: 77,968 (7,463 second mortgage, 477 home equity loan, 5,400 both second mortgage and home equity loan )Houses without a mortgage: 1,679
Median household income for houses/condos with a mortgage: $93,759
Median household income for apartments without a mortgage: $57,361
Median monthly housing costs: $1,250
Data:
Median house or condo value ($)
Median house or condo value ($ change since 2000)
Median house or condo value ($) - White
Median house or condo value ($) - Black or African American
Median house or condo value ($) - Asian
Median house or condo value ($) - Hispanic or Latino
Median house or condo value ($) - American Indian and Alaska Native
Median house or condo value ($) - Multirace
Median house or condo value ($) - Other Race
Median price asked for mobile homes ($)
Household density (households per square mile)
Mean house or condo value by units in structure - 1, detached ($)
Mean house or condo value by units in structure - 1, attached ($)
Mean house or condo value by units in structure - 2 ($)
Mean house or condo value by units in structure by units in structure - 3 or 4 ($)
Mean house or condo value by units in structure - 5 or more ($)
Mean house or condo value by units in structure - Boat, RV, van, etc. ($)
Mean house or condo value by units in structure - Mobile home ($)
Median contract rent ($)
Median contract rent - Lower quartile ($)
Median contract rent - Upper quartile ($)
Median gross rent ($)
Urban houses (%)
Rural houses (%)
Houses occupied (%)
Houses occupied (% change since 2000)
Houses owner occupied (%)
Houses owner occupied (% change since 2000)
Houses renter occupied (%)
Houses renter occupied (% change since 2000)
Vacant housing units - For rent (%)
Vacant housing units - For rent (% change since 2000)
Vacant housing units - For sale only (%)
Vacant housing units - For sale only (% change since 2000)
Vacant housing units - Rented or sold, not occupied (%)
Vacant housing units - Rented or sold, not occupied (% change since 2000)
Vacant housing units - For seasonal, recreational, or occasional use (%)
Vacant housing units - For seasonal, recreational, or occasional use (% change since 2000)
Vacant housing units - For migrant workers (%)
Vacant housing units - For migrant workers (% change since 2000)
Vacant housing units - Other vacant (%)
Vacant housing units - Other vacant (% change since 2000)
Median monthly housing costs ($)
Median household income for houses/condos with a mortgage ($)
Median household income for houses/condos without a mortgage ($)
Median household income ($)
Median household income ($) - White
Median household income ($) - Black or African American
Median household income ($) - Asian
Median household income ($) - Hispanic or Latino
Median household income ($) - American Indian and Alaska Native
Median household income ($) - Multirace
Median household income ($) - Other Race
Mortgage status - with mortgage (%)
Mortgage status - with second mortgage (%)
Mortgage status - with home equity loan (%)
Mortgage status - with both second mortgage and home equity loan (%)
Mortgage status - without a mortgage (%)
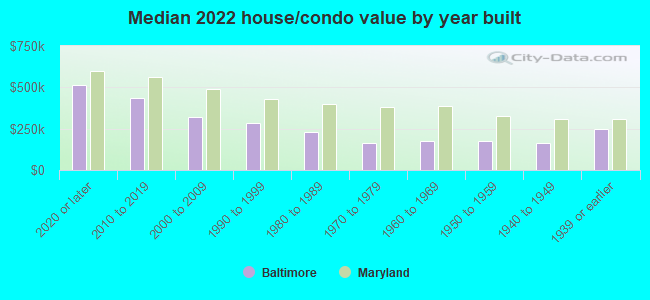
Median year house/condo built
Median year apartment built
Household type by relationship - Male householder living alone (%)
Household type by relationship - Male householder not living alone (%)
Household type by relationship - Female householder living alone (%)
Household type by relationship - Female householder not living alone (%)
Household type by relationship - Opposite-Sex spouse (%)
Household type by relationship - Same-Sex spouse (%)
Household type by relationship - Opposite-Sex unmarried partner (%)
Household type by relationship - Same-Sex unmarried partner (%)
Household type by relationship - In group quarters (%)
Size of family households - 2-person household (%)
Size of family households - 3-person household (%)
Size of family households - 4-person household (%)
Size of family households - 5-person household (%)
Size of family households - 6-person household (%)
Size of family households - 7-or-more-person household (%)
Size of nonfamily households - 1-person household (%)
Size of nonfamily households - 2-person household (%)
Size of nonfamily households - 3-person household (%)
Size of nonfamily households - 4-person household (%)
Size of nonfamily households - 5-person household (%)
Size of nonfamily households - 6-person household (%)
Size of nonfamily households - 7-or-moreperson household (%)
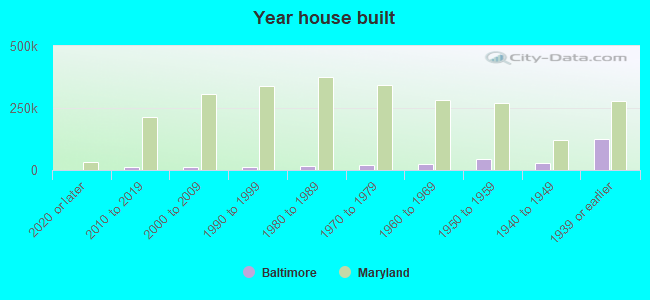
Year house built - Built 2010 or later (%)
Year house built - Built 2000 to 2009 (%)
Year house built - Built 1990 to 1999 (%)
Year house built - Built 1980 to 1989 (%)
Year house built - Built 1970 to 1979 (%)
Year house built - Built 1960 to 1969 (%)
Year house built - Built 1950 to 1959 (%)
Year house built - Built 1940 to 1949 (%)
Year house built - Built 1939 or earlier (%)
Median number of rooms in houses and condos
Median number of rooms in apartments
Median number of bedrooms in owner occupied houses
Mean number of bedrooms in owner occupied houses
Median number of bedrooms in renter occupied houses
Mean number of bedrooms in renter occupied houses
Median number of vehichles in owner occupied houses
Mean number of vehichles in owner occupied houses
Median number of vehichles in renter occupied houses
Mean number of vehichles in renter occupied houses
Rooms in owner-occupied houses - 1 room (%)
Rooms in owner-occupied houses - 2 rooms (%)
Rooms in owner-occupied houses - 3 rooms (%)
Rooms in owner-occupied houses - 4 rooms (%)
Rooms in owner-occupied houses - 5 rooms (%)
Rooms in owner-occupied houses - 6 rooms (%)
Rooms in owner-occupied houses - 7 rooms (%)
Rooms in owner-occupied houses - 8 rooms (%)
Rooms in owner-occupied houses - 9+ rooms (%)
Rooms in renter-occupied houses - 1 room (%)
Rooms in renter-occupied houses - 2 rooms (%)
Rooms in renter-occupied houses - 3 rooms (%)
Rooms in renter-occupied houses - 4 rooms (%)
Rooms in renter-occupied houses - 5 rooms (%)
Rooms in renter-occupied houses - 6 rooms (%)
Rooms in renter-occupied houses - 7 rooms (%)
Rooms in renter-occupied houses - 8 rooms (%)
Rooms in renter-occupied houses - 9+ rooms (%)
Bedrooms in owner-occupied houses - no bedrooms (%)
Bedrooms in owner-occupied houses - 1 bedroom (%)
Bedrooms in owner-occupied houses - 2 bedrooms (%)
Bedrooms in owner-occupied houses - 3 bedrooms (%)
Bedrooms in owner-occupied houses - 4 bedrooms (%)
Bedrooms in owner-occupied houses - 5+ bedrooms (%)
Bedrooms in renter-occupied houses - no bedrooms (%)
Bedrooms in renter-occupied houses - 1 bedroom (%)
Bedrooms in renter-occupied houses - 2 bedrooms (%)
Bedrooms in renter-occupied houses - 3 bedrooms (%)
Bedrooms in renter-occupied houses - 4 bedrooms (%)
Bedrooms in renter-occupied houses - 5+ bedrooms (%)
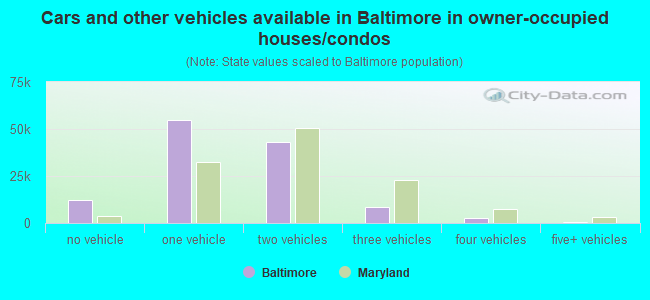
Vehicles available in owner-occupied houses - no vehicle available (%)
Vehicles available in owner-occupied houses - 1 vehicle available(%)
Vehicles available in owner-occupied houses - 2 Vehicles available (%)
Vehicles available in owner-occupied houses - 3 Vehicles available (%)
Vehicles available in owner-occupied houses - 4 Vehicles available (%)
Vehicles available in owner-occupied houses - 5+ Vehicles available (%)
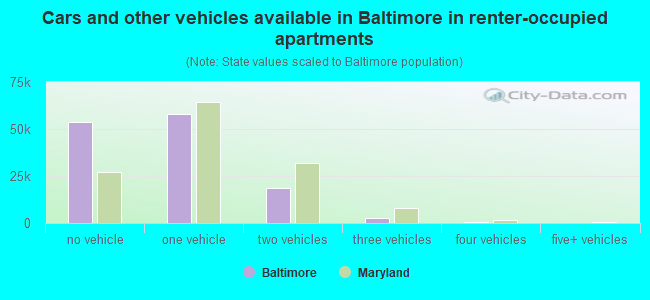
Vehicles available in renter-occupied houses - no vehicle available (%)
Vehicles available in renter-occupied houses - 1 vehicle available (%)
Vehicles available in renter-occupied houses - 2 Vehicles available (%)
Vehicles available in renter-occupied houses - 3 Vehicles available (%)
Vehicles available in renter-occupied houses - 4 Vehicles available (%)
Vehicles available in renter-occupied houses - 5+ Vehicles available (%)
Housing units in structures - 1, detached (%)
Housing units in structures - 1, attached (%)
Housing units in structures - 2 (%)
Housing units in structures - 3 or 4 (%)
Housing units in structures - 5 to 9 (%)
Housing units in structures - 10 to 19 (%)
Housing units in structures - 20 to 49 (%)
Housing units in structures - 50 or more (%)
Housing units in structures - Mobile home (%)
Housing units in structures - Boat, RV, van, etc. (%)
Housing units in structures - Owners - 1, detached (%)
Housing units in structures - Owners - 1, attached (%)
Housing units in structures - Owners - 2 (%)
Housing units in structures - Owners - 3 or 4 (%)
Housing units in structures - Owners - 5 to 9 (%)
Housing units in structures - Owners - 10 to 19 (%)
Housing units in structures - Owners - 20 to 49 (%)
Housing units in structures - Owners - 50 or more (%)
Housing units in structures - Owners - Mobile home (%)
Housing units in structures - Owners - Boat, RV, van, etc. (%)
Housing units in structures - Renters - 1, detached (%)
Housing units in structures - Renters - 1, attached (%)
Housing units in structures - Renters - 2 (%)
Housing units in structures - Renters - 3 or 4 (%)
Housing units in structures - Renters - 5 to 9 (%)
Housing units in structures - Renters - 10 to 19 (%)
Housing units in structures - Renters - 20 to 49 (%)
Housing units in structures - Renters - 50 or more (%)
Housing units in structures - Renters - Mobile home (%)
Housing units in structures - Renters - Boat, RV, van, etc. (%)
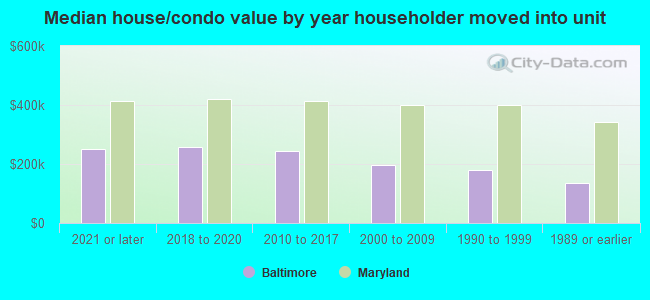
House/condo owner moved in on average (years ago)
Renter moved in on average (years ago)
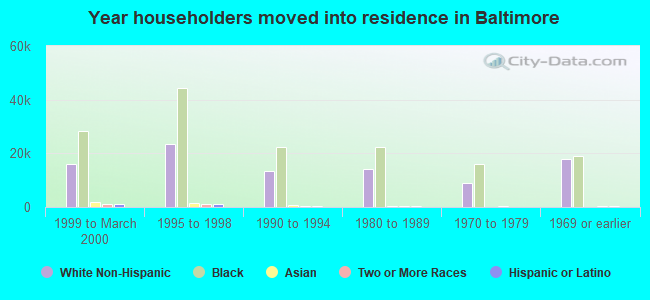
Year householder moved into unit - Moved in 1999 to March 2000 (%)
Year householder moved into unit - Moved in 1999 to March 2000 (%) - White
Year householder moved into unit - Moved in 1999 to March 2000 (%) - Black or African American
Year householder moved into unit - Moved in 1999 to March 2000 (%) - Asian
Year householder moved into unit - Moved in 1999 to March 2000 (%) - Hispanic or Latino
Year householder moved into unit - Moved in 1999 to March 2000 (%) - American Indian and Alaska Native
Year householder moved into unit - Moved in 1999 to March 2000 (%) - Multirace
Year householder moved into unit - Moved in 1999 to March 2000 (%) - Other Race
Year householder moved into unit - Moved in 1995 to 1998 (%)
Year householder moved into unit - Moved in 1995 to 1998 (%) - White
Year householder moved into unit - Moved in 1995 to 1998 (%) - Black or African American
Year householder moved into unit - Moved in 1995 to 1998 (%) - Asian
Year householder moved into unit - Moved in 1995 to 1998 (%) - Hispanic or Latino
Year householder moved into unit - Moved in 1995 to 1998 (%) - American Indian and Alaska Native
Year householder moved into unit - Moved in 1995 to 1998 (%) - Multirace
Year householder moved into unit - Moved in 1995 to 1998 (%) - Other Race
Year householder moved into unit - Moved in 1990 to 1994 (%)
Year householder moved into unit - Moved in 1990 to 1994 (%) - White
Year householder moved into unit - Moved in 1990 to 1994 (%) - Black or African American
Year householder moved into unit - Moved in 1990 to 1994 (%) - Asian
Year householder moved into unit - Moved in 1990 to 1994 (%) - Hispanic or Latino
Year householder moved into unit - Moved in 1990 to 1994 (%) - American Indian and Alaska Native
Year householder moved into unit - Moved in 1990 to 1994 (%) - Multirace
Year householder moved into unit - Moved in 1990 to 1994 (%) - Other Race
Year householder moved into unit - Moved in 1980 to 1989 (%)
Year householder moved into unit - Moved in 1980 to 1989 (%) - White
Year householder moved into unit - Moved in 1980 to 1989 (%) - Black or African American
Year householder moved into unit - Moved in 1980 to 1989 (%) - Asian
Year householder moved into unit - Moved in 1980 to 1989 (%) - Hispanic or Latino
Year householder moved into unit - Moved in 1980 to 1989 (%) - American Indian and Alaska Native
Year householder moved into unit - Moved in 1980 to 1989 (%) - Multirace
Year householder moved into unit - Moved in 1980 to 1989 (%) - Other Race
Year householder moved into unit - Moved in 1970 to 1979 (%)
Year householder moved into unit - Moved in 1970 to 1979 (%) - White
Year householder moved into unit - Moved in 1970 to 1979 (%) - Black or African American
Year householder moved into unit - Moved in 1970 to 1979 (%) - Asian
Year householder moved into unit - Moved in 1970 to 1979 (%) - Hispanic or Latino
Year householder moved into unit - Moved in 1970 to 1979 (%) - American Indian and Alaska Native
Year householder moved into unit - Moved in 1970 to 1979 (%) - Multirace
Year householder moved into unit - Moved in 1970 to 1979 (%) - Other Race
Year householder moved into unit - Moved in 1969 or earlier (%)
Year householder moved into unit - Moved in 1969 or earlier (%) - White
Year householder moved into unit - Moved in 1969 or earlier (%) - Black or African American
Year householder moved into unit - Moved in 1969 or earlier (%) - Asian
Year householder moved into unit - Moved in 1969 or earlier (%) - Hispanic or Latino
Year householder moved into unit - Moved in 1969 or earlier (%) - American Indian and Alaska Native
Year householder moved into unit - Moved in 1969 or earlier (%) - Multirace
Year householder moved into unit - Moved in 1969 or earlier (%) - Other Race
Housing units lacking complete plumbing facilities (%)
Housing units lacking complete kitchen facilities (%)
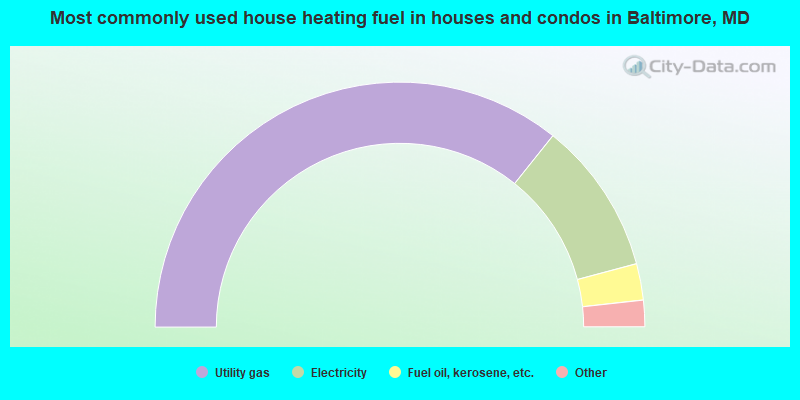
House heating fuel used in houses and condos - Utility gas (%)
House heating fuel used in houses and condos - Bottled, tank, or LP gas (%)
House heating fuel used in houses and condos - Electricity (%)
House heating fuel used in houses and condos - Fuel oil, kerosene, etc. (%)
House heating fuel used in houses and condos - Coal or coke (%)
House heating fuel used in houses and condos - Wood (%)
House heating fuel used in houses and condos - Solar energy (%)
House heating fuel used in houses and condos - Other fuel (%)
House heating fuel used in houses and condos - No fuel used (%)
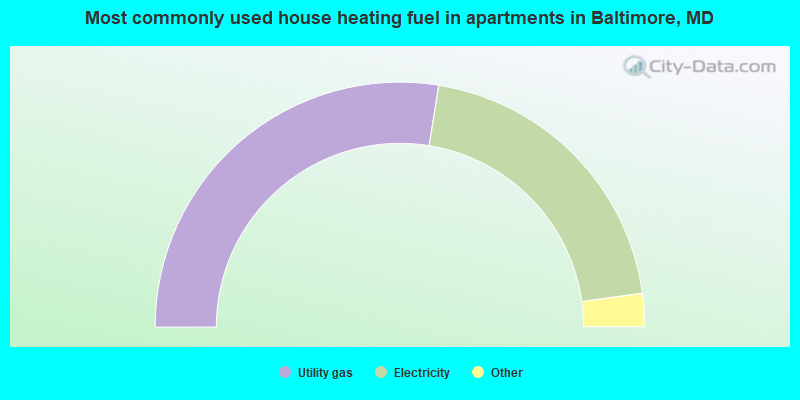
House heating fuel used in apartments - Utility gas (%)
House heating fuel used in apartments - Bottled, tank, or LP gas (%)
House heating fuel used in apartments - Electricity (%)
House heating fuel used in apartments - Fuel oil, kerosene, etc. (%)
House heating fuel used in apartments - Coal or coke (%)
House heating fuel used in apartments - Wood (%)
House heating fuel used in apartments - Solar energy (%)
House heating fuel used in apartments - Other fuel (%)
House heating fuel used in apartments - No fuel used (%)
Latest news about housing in Baltimore, MD collected exclusively by city-data.com from local newspapers, TV, and radio stations
Median year house/condo built: 1942Median year apartment built: 1959Household type by relationship:
Households: 569,931
Male householders: 102,661 (47,652 living alone ), Female householders: 152,046 (61,670 living alone )59,114 spouses (56,875 opposite-sex spouses ), 19,105 unmarried partners , (18,068 opposite-sex unmarried partners ), 147,028 children (139,389 natural , 3,263 adopted , 4,376 stepchildren ), 17,137 grandchildren , 10,495 brothers or sisters , 6,994 parents , 113 foster children , 14,211 other relatives , 22,578 non-relatives In group quarters: 18,449
Size of family households: 59,740 2-persons , 29,243 3-persons , 17,897 4-persons , 9,408 5-persons , 3,241 6-persons , 2,347 7-or-more-persons .
Size of nonfamily households: 109,322 1-person , 19,898 2-persons , 2,279 3-persons , 596 4-persons , 331 5-persons , 405 7-or-more-persons .
48,537 married couples with children. single-parent households (7,763 men , 40,559 women ).
89.0% of residents of Baltimore speak English at home. of residents speak Spanish at home (51% speak English very well , 20% speak English well , 24% speak English not well , 5% don't speak English at all ).of residents speak other Indo-European language at home (65% speak English very well , 22% speak English well , 12% speak English not well ).of residents speak Asian or Pacific Island language at home (59% speak English very well , 25% speak English well , 13% speak English not well , 4% don't speak English at all ).of residents speak other language at home (65% speak English very well , 26% speak English well , 4% speak English not well , 4% don't speak English at all ).
Foreign born population: 55,144 (9.7%)of them are naturalized citizens )
Median number of rooms in houses and condos:
Median number of rooms in apartments
Owner-occupied Renter-occupied
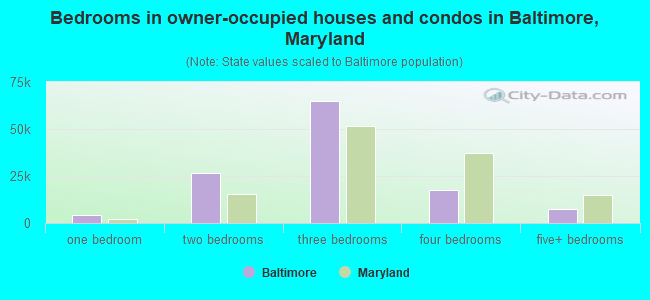
Bedrooms in owner-occupied houses and condos in Baltimore, Maryland
244 no bedroom 4,384 1 bedroom 26,588 2 bedrooms 65,000 3 bedrooms 17,571 4 bedrooms 7,430 5+ bedrooms
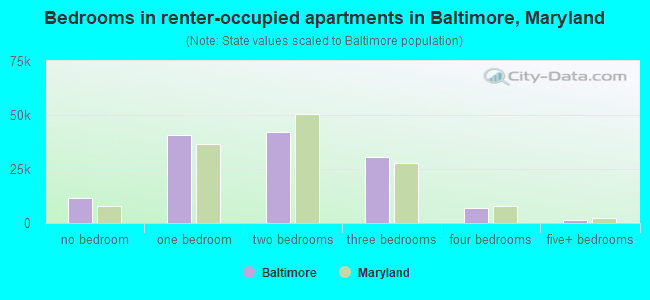
Bedrooms in renter-occupied apartments in Baltimore, Maryland
11,387 no bedroom 40,622 1 bedroom 42,354 2 bedrooms 30,590 3 bedrooms 6,973 4 bedrooms 1,564 5+ bedrooms
Owner-occupied Renter-occupied
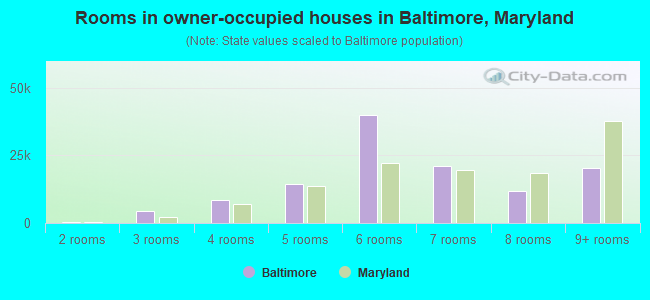
Rooms in owner-occupied houses in Baltimore, Maryland
244 1 room 495 2 rooms 4,423 3 rooms 8,499 4 rooms 14,490 5 rooms 39,913 6 rooms 21,093 7 rooms 11,847 8 rooms 20,213 9+ rooms
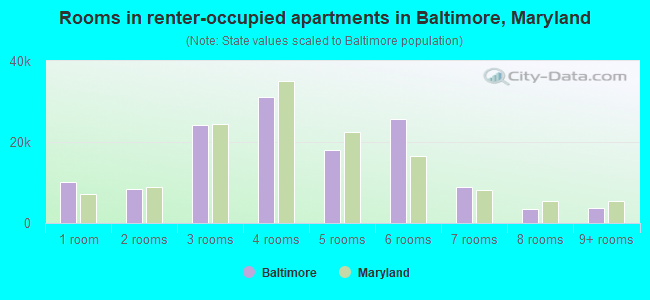
Rooms in renter-occupied apartments in Baltimore, Maryland
10,020 1 room 8,294 2 rooms 24,142 3 rooms 31,226 4 rooms 18,077 5 rooms 25,628 6 rooms 8,823 7 rooms 3,579 8 rooms 3,701 9+ rooms
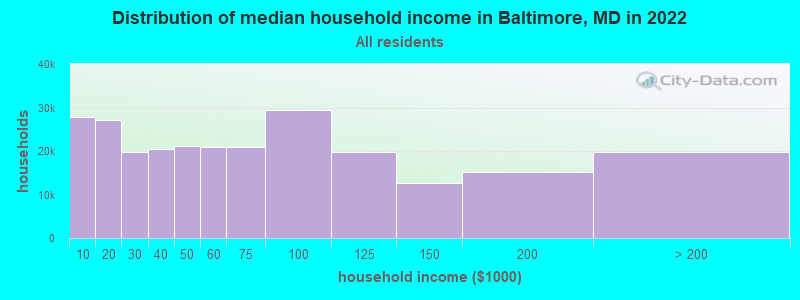
Baltimore, MD household income distribution 27,773 Less than $10,00027,076 $10,000 to $19,99919,777 $20,000 to $29,99920,381 $30,000 to $39,99921,084 $40,000 to $49,99921,002 $50,000 to $59,99920,964 $60,000 to $74,99929,328 $75,000 to $99,99919,716 $100,000 to $124,99912,606 $125,000 to $149,99915,233 $150,000 to $199,99919,767 $200,000 or more
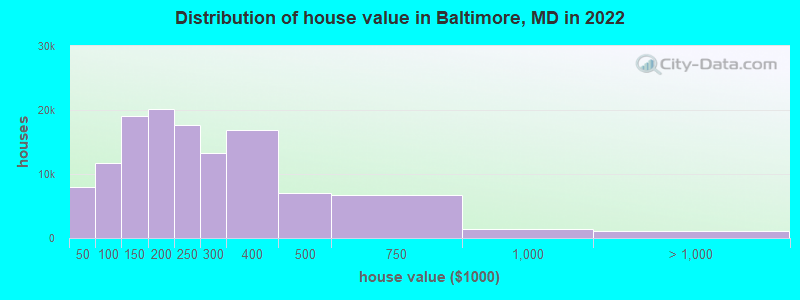
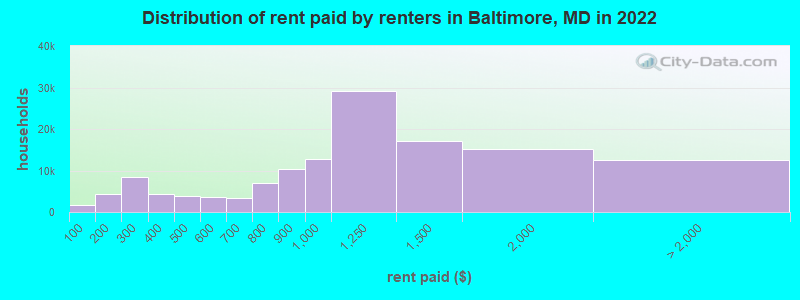
Home value of owner - occupied houses in 2022 in Baltimore, MD 1,632 Less than $10,000623 $10,000 to $14,9991,413 $15,000 to $19,9991,446 $20,000 to $24,99974 $25,000 to $29,999673 $30,000 to $34,999153 $35,000 to $39,9991,885 $40,000 to $49,9991,895 $50,000 to $59,9991,609 $60,000 to $69,9991,770 $70,000 to $79,9992,597 $80,000 to $89,9992,031 $90,000 to $99,99911,950 $100,000 to $124,9997,048 $125,000 to $149,99911,759 $150,000 to $174,9998,399 $175,000 to $199,99917,674 $200,000 to $249,99913,349 $250,000 to $299,99916,901 $300,000 to $399,9997,040 $400,000 to $499,9996,782 $500,000 to $749,9991,376 $750,000 to $999,999694 $1,000,000 to $1,499,999124 $1,500,000 to $1,999,999320 $2,000,000 or moreRent paid by renters in 2022 in Baltimore, MD 1,753 Less than $1002,379 $100 to $1491,935 $150 to $1996,654 $200 to $2491,758 $250 to $2992,371 $300 to $3491,854 $350 to $3992,330 $400 to $4491,516 $450 to $4991,728 $500 to $5491,818 $550 to $5991,526 $600 to $6491,766 $650 to $6993,873 $700 to $7493,055 $750 to $79910,355 $800 to $89912,824 $900 to $99929,249 $1,000 to $1,24917,120 $1,250 to $1,49915,106 $1,500 to $1,9995,404 $2,000 to $2,4991,731 $2,500 to $2,999600 $3,000 to $3,499378 $3,500 or more4,407 No cash rent
Percentage of workers working in this county: 65.7%Number of people working at home: 48,227 (17.7% of all workers )
Travel time to work (commute)
Less than 5 minutes: 3,1525 to 9 minutes: 12,35210 to 14 minutes: 21,52515 to 19 minutes: 36,85020 to 24 minutes: 42,38825 to 29 minutes: 16,88530 to 34 minutes: 38,21335 to 39 minutes: 5,12340 to 44 minutes: 7,06845 to 59 minutes: 17,03060 to 89 minutes: 14,00090 or more minutes: 9,100
Means of transportation to work:
Drove a car alone: 239,556 (65.5%)Carpooled: 29,293 (8.0%)Bus : 22,275 (6.1%)Subway or elevated rail : 4,839 (1.3%)Long-distance train or commuter rail : 1,322 (0.4%)Light rail, streetcar or trolley : 577 (0.2%)Ferryboat: 313 (0.1%)Taxi: 5,934 (1.6%)Bicycle: 1,582 (0.4%)Walked: 11,856 (3.2%)Worked at home: 48,227 (13.2%)
Unemployment by race in 2022
Unemployment rate for White non-Hispanic residents 5.2% Males3.0% FemalesUnemployment rate for Black residents 7.6% Males5.8% FemalesUnemployment rate for American Indian and Alaska Native residents 0.4% Males11.0% FemalesUnemployment rate for Asian residents 3.9% Males2.8% FemalesUnemployment rate for other race residents 2.5% Males4.2% FemalesUnemployment rate for two or more race residents 6.4% Males6.5% FemalesUnemployment rate for Hispanic or Latino residents 2.0% Males2.7% Females
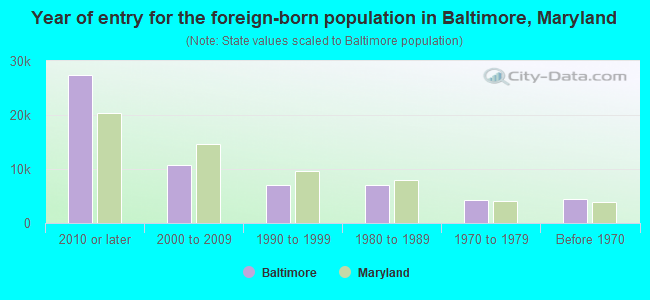
Year of entry for the foreign-born population in Baltimore, Maryland
27,377 2010 or later 10,650 2000 to 2009 7,115 1990 to 1999 6,975 1980 to 1989 4,172 1970 to 1979 4,434 Before 1970
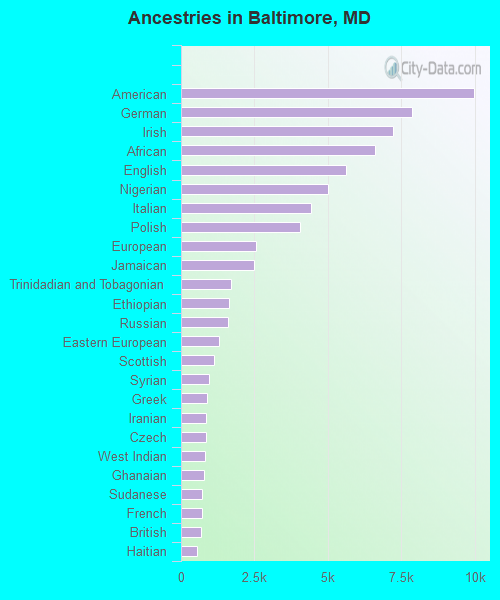
First ancestries reported:
American: 9,993 (2.7%)
German: 7,866 (2.1%)
Irish: 7,210 (2.0%)
African: 6,610 (1.8%)
English: 5,619 (1.5%)
Nigerian: 5,014 (1.4%)
Italian: 4,437 (1.2%)
Polish: 4,041 (1.1%)
European: 2,551 (0.7%)
Jamaican: 2,475 (0.7%)
Trinidadian and Tobagonian: 1,715 (0.5%)
Ethiopian: 1,649 (0.5%)
Russian: 1,600 (0.4%)
Eastern European: 1,285 (0.4%)
Scottish: 1,118 (0.3%)
Syrian: 940 (0.3%)
Greek: 871 (0.2%)
Iranian: 855 (0.2%)
Czech: 852 (0.2%)
West Indian: 810 (0.2%)
Ghanaian: 771 (0.2%)
Sudanese: 731 (0.2%)
French: 705 (0.2%)
British: 677 (0.2%)
Haitian: 552 (0.2%)
Hungarian: 506 (0.1%)
Scotch-Irish: 500 (0.1%)
Swedish: 465 (0.1%)
Kenyan: 462 (0.1%)
Brazilian: 457 (0.1%)
Ukrainian: 448 (0.1%)
Guyanese: 428 (0.1%)
Egyptian: 274 (0.07%)
Norwegian: 254 (0.07%)
Northern European: 233 (0.06%)
Moroccan: 209 (0.06%)
Lebanese: 209 (0.06%)
Swiss: 204 (0.06%)
Liberian: 203 (0.06%)
Canadian: 196 (0.05%)
Lithuanian: 195 (0.05%)
Romanian: 194 (0.05%)
Iraqi: 194 (0.05%)
Barbadian: 184 (0.05%)
Turkish: 182 (0.05%)
Arab: 177 (0.05%)
Portuguese: 175 (0.05%)
Dutch: 163 (0.04%)
Welsh: 154 (0.04%)
Scandinavian: 148 (0.04%)
Danish: 138 (0.04%)
Belgian: 131 (0.04%)
Finnish: 128 (0.03%)
Slovak: 116 (0.03%)
Austrian: 110 (0.03%)
Sierra Leonean: 108 (0.03%)
Armenian: 103 (0.03%)
Yugoslavian: 82 (0.02%)
Israeli: 77 (0.02%)
Cajun: 74 (0.02%)
Bahamian: 73 (0.02%)
French Canadian: 72 (0.02%)
Latvian: 62 (0.02%)
Czechoslovakian: 62 (0.02%)
Palestinian: 61 (0.02%)
British West Indian: 57 (0.02%)
Zimbabwean: 50 (0.01%)
Serbian: 50 (0.01%)
Dutch West Indian: 49 (0.01%)
Slavic: 49 (0.01%)
Bulgarian: 46 (0.01%)
South African: 44 (0.01%)
Afghan: 43 (0.01%)
Jordanian: 42 (0.01%)
Cape Verdean: 38 (0.01%)
Maltese: 38 (0.01%)
Croatian: 32 (0.01%)
Pennsylvania German: 29 (0.01%)
Ugandan: 28 (0.01%)
U.S. Virgin Islander: 22 (0.01%)
Most common places of birth for foreign-born residents (%): Nigeria Baltimore:
7.9% (4,020)Maryland:
4.6% (44,825)
Jamaica Baltimore:
5.5% (2,789)Maryland:
2.8% (27,444)
El Salvador Baltimore:
4.8% (2,415)Maryland:
12.0% (115,412)
Honduras Baltimore:
4.6% (2,358)Maryland:
2.5% (24,026)
Trinidad and Tobago Baltimore:
4.2% (2,130)Maryland:
1.2% (11,481)
China, excluding Hong Kong and Taiwan Baltimore:
4.0% (2,008)Maryland:
4.6% (44,742)
Mexico Baltimore:
3.7% (1,884)Maryland:
3.5% (34,065)
India Baltimore:
3.6% (1,808)Maryland:
6.4% (61,725)
Guatemala Baltimore:
3.5% (1,772)Maryland:
4.4% (42,350)
Philippines Baltimore:
2.5% (1,279)Maryland:
3.8% (36,698)
Dominican Republic Baltimore:
2.5% (1,252)Maryland:
1.4% (13,947)
Ethiopia Baltimore:
2.2% (1,140)Maryland:
3.2% (30,870)
Ecuador Baltimore:
2.2% (1,100)Maryland:
0.6% (6,211)
Korea Baltimore:
2.1% (1,079)Maryland:
3.4% (32,635)
Germany Baltimore:
1.8% (914)Maryland:
1.2% (11,265)
Kenya Baltimore:
1.7% (880)Maryland:
0.8% (7,497)
Iran Baltimore:
1.7% (856)Maryland:
1.3% (12,074)
West Indies Baltimore:
1.6% (795)Maryland:
0.1% (920)
Nepal Baltimore:
1.6% (795)Maryland:
1.1% (10,205)
Place of birth for U.S.-born residents:
This state: 367,151Other state: 142,277Northeast: 52,337Midwest: 17,092South: 58,528West: 14,320 87.3% of Baltimore residents lived in the same house 1 years ago.
Out of people who lived in different houses, 35.6% lived in this county.
Out of people who lived in different counties, 49.8% lived in Maryland.
Baltimore:
87.3%State average:
88.5%
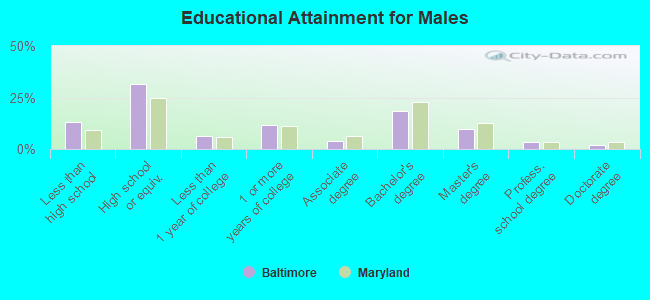
Education attainment for males 25 years and older:
No schooling: 2,484Nursery to 4th grade: 3925th and 6th grade: 9787th and 8th grade: 2,9149th grade: 2,78810th grade: 4,62911th grade: 5,53412th grade, no diploma: 3,723High school graduate (or equivalency): 57,393Less than 1 year of college: 11,739Some college more than 1 year, no degree: 20,785Associate degree: 7,039Bachelor's degree: 33,200Master's degree: 17,832Professional school degree: 5,919Doctorate degree: 3,532
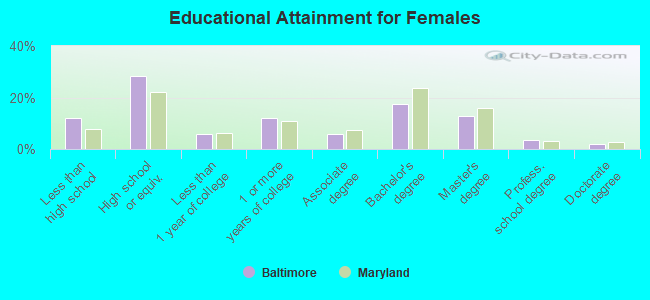
Education attainment for females 25 years and older:
No schooling: 3,879Nursery to 4th grade: 5905th and 6th grade: 1,6307th and 8th grade: 2,4059th grade: 2,36810th grade: 4,65711th grade: 5,77112th grade, no diploma: 5,107High school graduate (or equivalency): 62,493Less than 1 year of college: 12,621Some college more than 1 year, no degree: 26,261Associate degree: 12,953Bachelor's degree: 38,351Master's degree: 28,197Professional school degree: 7,591Doctorate degree: 4,680
Housing units in structures:
One, detached: 42,126One, attached: 152,504Two: 11,5963 or 4: 14,2475 to 9: 14,36610 to 19: 11,48620 to 49: 10,71850 or more: 36,201Mobile homes: 570Boats, RVs, vans, etc.: 65Median worth of mobile homes: $81,219
Housing units lacking complete plumbing facilities in 2022: 4.3%Housing units lacking complete kitchen facilities in 2022: 5.6%House/condo owner moved in on average 13 years ago
Renter moved in on average 3 years ago
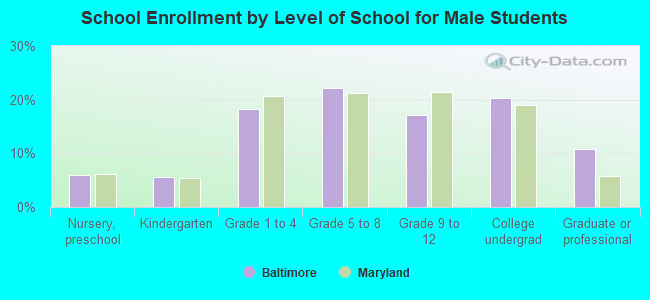
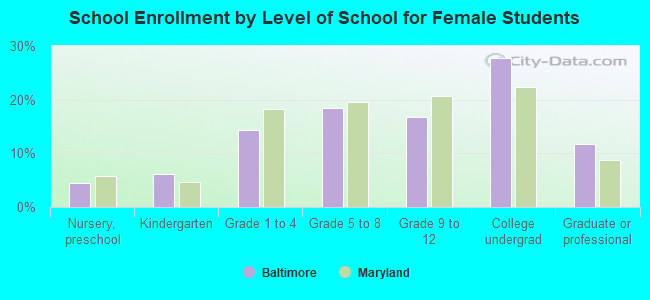
Private vs. public school enrollment:
Students in private schools in grades 1 to 8 (elementary and middle school): 6,242 Students in private schools in grades 9 to 12 (high school): 3,202 Students in private undergraduate colleges: 10,908