Housing density: 1,475 houses/condos per square mile
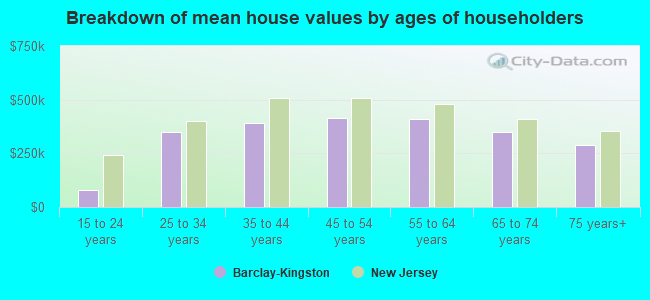
Median price asked for vacant for-sale houses and condos in 2022 in this county: $280,676.
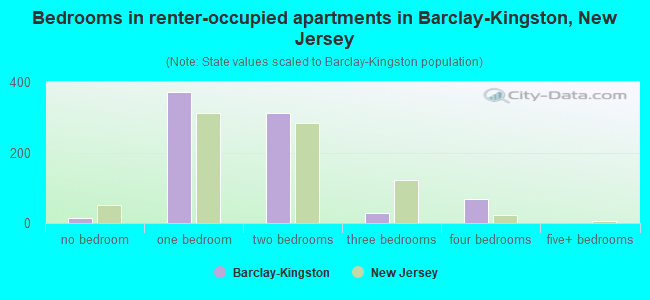
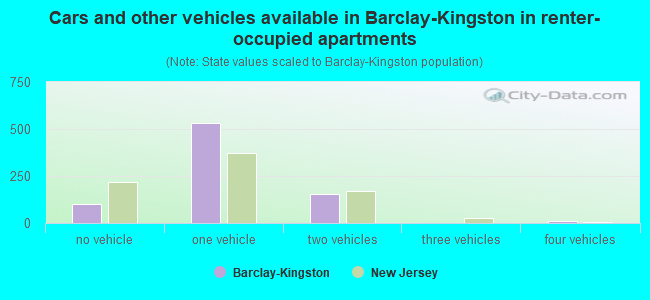
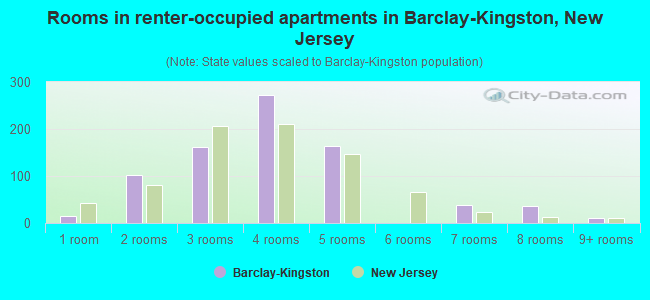
Median contract rent in 2022: $1,579 (lower quartile is $1,340, upper quartile is $1,797)
Median rent asked for vacant for-rent units in 2022: $1,499
Median gross rent in Barclay-Kingston, NJ in 2022: $1,597
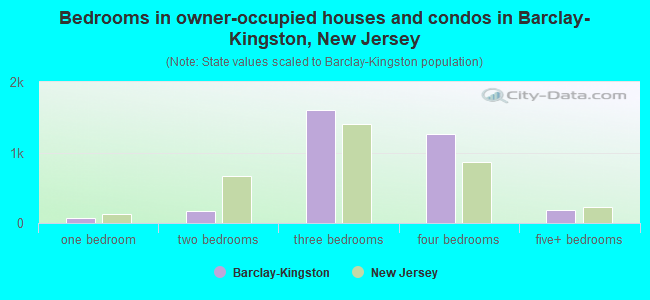
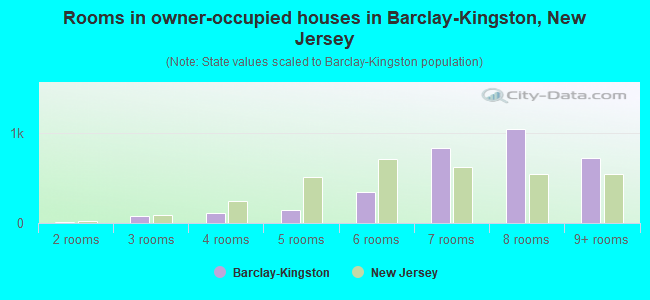
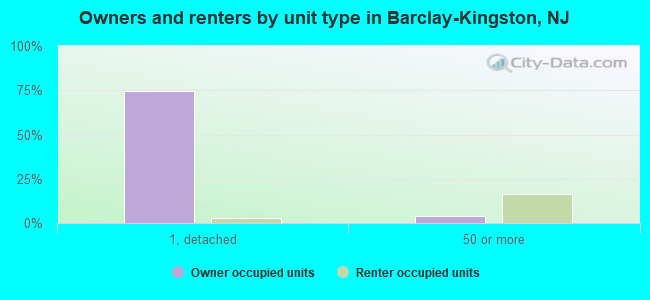
Housing units in Barclay-Kingston with a mortgage: 2,075 (186 second mortgage, 362 home equity loan, 8 both second mortgage and home equity loan) Houses without a mortgage: 974
Compare current foreclosures near Barclay-Kingston, NJ:
In family households: 431,734 (82,185 male householders, 47,758 female householders)
88,462 spouses, 162,028 children (152,370 natural, 3,447 adopted, 6,211 stepchildren), 13,516 grandchildren, 6,342 brothers or sisters, 5,878 parents, foster children, 8,583 other relatives, 13,287 non-relatives
In nonfamily households: 74,509 (26,856 male householders (20,736 living alone)), 34,181 female householders (29,446 living alone)), 13,472 nonrelatives
In group quarters: 7,414 (5,604 institutionalized population)
84,681 married couples with children.
35,421 single-parent households (6,804 men, 28,617 women).
88.3% of residents of Barclay-Kingston speak English at home.
1.3% of residents speak Spanish at home (71% speak English very well, 23% speak English well, 6% speak English not well).
4.0% of residents speak other Indo-European language at home (75% speak English very well, 17% speak English well, 9% speak English not well).
5.4% of residents speak Asian or Pacific Island language at home (75% speak English very well, 23% speak English well, 2% speak English not well).
1.0% of residents speak other language at home (61% speak English very well, 39% speak English well).
Foreign born population: 1,786 (16.1%)
(82.4% of them are naturalized citizens)
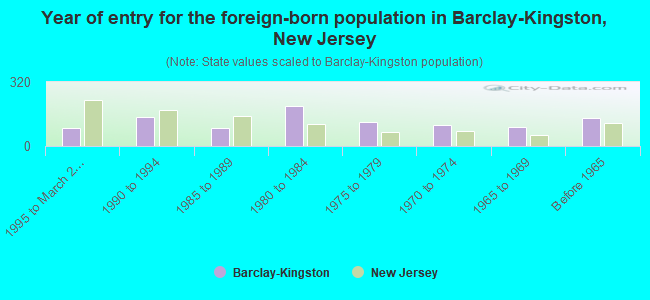
Year of entry for the foreign-born population in Barclay-Kingston, New Jersey
921995 to March 2000
1441990 to 1994
921985 to 1989
1981980 to 1984
1211975 to 1979
1051970 to 1974
961965 to 1969
138Before 1965
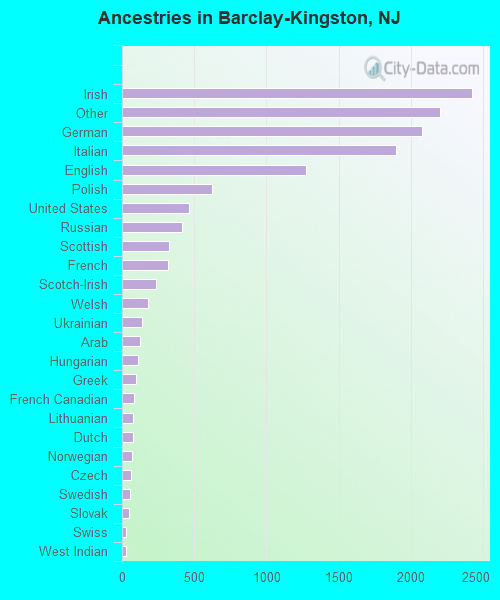
First ancestries reported:
Irish: 2,420 (18.0%)
Other: 2,201 (16.4%)
German: 2,077 (15.5%)
Italian: 1,895 (14.1%)
English: 1,275 (9.5%)
Polish: 623 (4.6%)
United States: 462 (3.4%)
Russian: 413 (3.1%)
Scottish: 324 (2.4%)
French: 318 (2.4%)
Scotch-Irish: 233 (1.7%)
Welsh: 178 (1.3%)
Ukrainian: 136 (1.0%)
Arab: 125 (0.9%)
Hungarian: 114 (0.8%)
Greek: 94 (0.7%)
French Canadian: 85 (0.6%)
Lithuanian: 78 (0.6%)
Dutch: 73 (0.5%)
Norwegian: 68 (0.5%)
Czech: 64 (0.5%)
Swedish: 52 (0.4%)
Slovak: 47 (0.4%)
Swiss: 26 (0.2%)
West Indian: 25 (0.2%)
Subsaharan African: 14 (0.1%)
Danish: 6 (0.04%)
Most common places of birth for foreign-born residents (%):
Philippines
Barclay-Kingston:
33.2% (327)
New Jersey:
4.7% (69,773)
India
Barclay-Kingston:
7.7% (76)
New Jersey:
8.1% (119,497)
Korea
Barclay-Kingston:
6.4% (63)
New Jersey:
3.5% (51,970)
Canada
Barclay-Kingston:
4.9% (48)
New Jersey:
1.1% (16,333)
Greece
Barclay-Kingston:
4.3% (42)
New Jersey:
0.8% (12,403)
Taiwan
Barclay-Kingston:
4.0% (39)
New Jersey:
1.2% (18,066)
United Kingdom
Barclay-Kingston:
3.4% (34)
New Jersey:
2.1% (30,355)
Jordan
Barclay-Kingston:
3.2% (32)
New Jersey:
0.2% (3,320)
Austria
Barclay-Kingston:
2.7% (27)
New Jersey:
0.2% (3,548)
Germany
Barclay-Kingston:
2.7% (27)
New Jersey:
2.3% (33,531)
Vietnam
Barclay-Kingston:
2.6% (26)
New Jersey:
0.9% (13,337)
Russia
Barclay-Kingston:
2.5% (25)
New Jersey:
1.4% (20,243)
China, excluding Hong Kong and Taiwan
Barclay-Kingston:
1.9% (19)
New Jersey:
2.7% (40,092)
Pakistan
Barclay-Kingston:
1.7% (17)
New Jersey:
1.1% (16,052)
Lebanon
Barclay-Kingston:
1.7% (17)
New Jersey:
0.3% (4,774)
Italy
Barclay-Kingston:
1.6% (16)
New Jersey:
4.0% (58,395)
Bangladesh
Barclay-Kingston:
1.5% (15)
New Jersey:
0.4% (5,929)
Place of birth for U.S.-born residents:
This state: 3,985
Other state: 5,715
Northeast: 4,721
Midwest: 290
South: 530
West: 174
67% of Barclay-Kingston residents lived in the same house 5 years ago. Out of people who lived in different houses, 61% lived in this county. Out of people who lived in different counties, 49% lived in New Jersey.
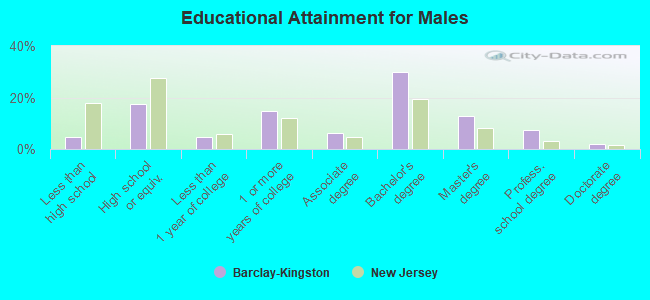
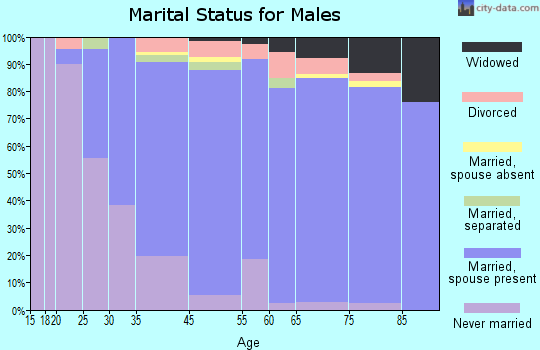
Education attainment for males 25 years and older:
No schooling: 7
Nursery to 4th grade: 0
5th and 6th grade: 11
7th and 8th grade: 14
9th grade: 36
10th grade: 9
11th grade: 28
12th grade, no diploma: 63
High school graduate (or equivalency): 607
Less than 1 year of college: 167
Some college more than 1 year, no degree: 517
Associate degree: 219
Bachelor's degree: 1,054
Master's degree: 449
Professional school degree: 260
Doctorate degree: 66
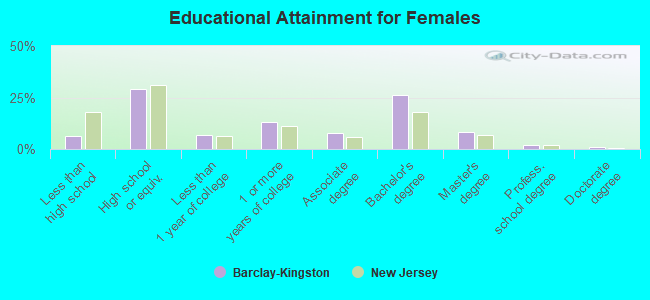
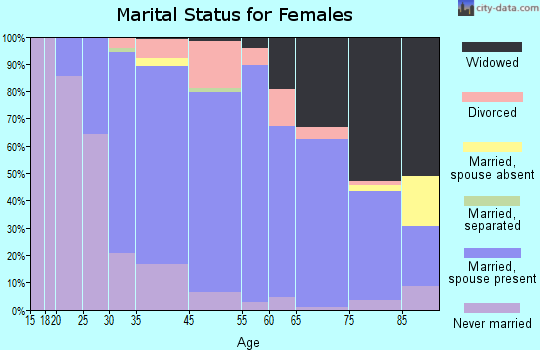
Education attainment for females 25 years and older: