Bartlett, TX (Texas) Houses and Residents
| Bartlett: | $192,065 |
| Texas: | $275,400 |
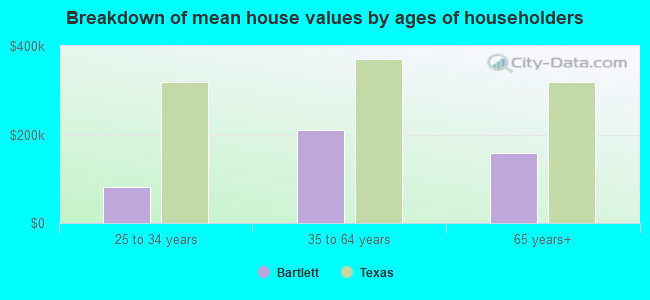
Mean price in 2022:
Detached houses: $196,560
Here: $196,560 State: $369,058 Mobile homes: $190,146
Here: $190,146 State: $124,413
Total population: 2,751 (Urban population: 1,571 (all inside urban clusters), Rural population: 108 (all nonfarm))
Houses: 711 (613 occupied: 474 owner occupied, 149 renter occupied)
| % of renters here: | 24% |
| State: | 38% |
Housing density: 583 houses/condos per square mile
Median price asked for vacant for-sale houses and condos in 2022: $65,901.
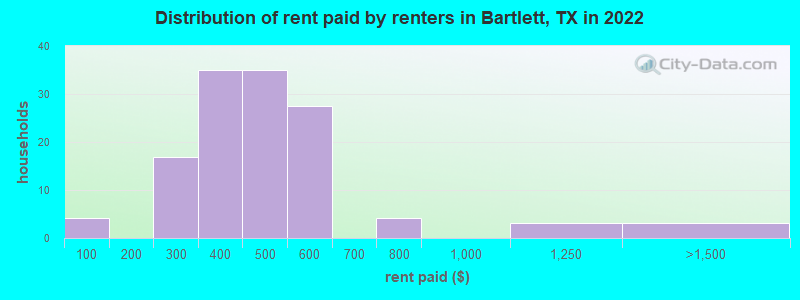
Median contract rent in 2022: $469 (lower quartile is $351, upper quartile is $615)
Median rent asked for vacant for-rent units in 2022: $239
Median gross rent in Bartlett, TX in 2022: $817
Housing units in Bartlett with a mortgage: 263 (15 second mortgage, 0 home equity loan, 13 both second mortgage and home equity loan)
Houses without a mortgage: 0
Median household income for houses/condos with a mortgage: $66,097
Median household income for apartments without a mortgage: $65,711
Median monthly housing costs: $858
Compare current foreclosures near Bartlett, TX:
| Photo | Address | Area | Beds / Baths | Price | Details |
|---|---|---|---|---|---|

|
#1
W Pietzsch St
Bartlett, TX 76511
|
1,816 sq. feet
|
3 baths 4 beds |
show details | |

|
#2
W Jackson St
Bartlett, TX 76511
|
- sq. feet
|
- baths - beds |
show details | |

|
#3
Lucy St
Bartlett, TX 76511
|
- sq. feet
|
- baths - beds |
show details | |

|
#4
Buckmeadow Dr
Georgetown, TX 78628
|
1,668 sq. feet
|
2 baths - beds |
show details | |

|
#5
Silver Cv
Jarrell, TX 76537
|
2,113 sq. feet
|
2 baths - beds |
show details | |

|
#6
W Rio Grande St
Taylor, TX 76574
|
1,260 sq. feet
|
1 baths - beds |
show details | |

|
#7
County Road 313
Jarrell, TX 76537
|
1,735 sq. feet
|
2 baths - beds |
show details | |

|
#8
Edgewood Dr
Georgetown, TX 78628
|
3,060 sq. feet
|
2 baths - beds |
show details | |

|
#9
Wisteria Dr
Georgetown, TX 78626
|
997 sq. feet
|
2 baths - beds |
show details | |

|
#10
N Interstate 35 # 1109
Georgetown, TX 78628
|
1,809 sq. feet
|
1 baths - beds |
show details |
| Photo | Address | Area | Beds / Baths | Price | Details |
|---|---|---|---|---|---|

|
#11
Shale Dr
Jarrell, TX 76537
|
1,787 sq. feet
|
2 baths - beds |
show details | |

|
#12
Double Creek Dr
Jarrell, TX 76537
|
1,700 sq. feet
|
2 baths - beds |
show details | |

|
#13
Squirrel Hollow Dr
Georgetown, TX 78628
|
2,036 sq. feet
|
2 baths - beds |
show details | |

|
#14
Davis St
Taylor, TX 76574
|
952 sq. feet
|
1 baths - beds |
show details | |

|
#15
Mill Creek Dr
Salado, TX 76571
|
- sq. feet
|
2 baths - beds |
show details | |

|
#16
Countryside Ct
Georgetown, TX 78626
|
2,016 sq. feet
|
- baths - beds |
show details | |

|
#17
Gunther Way
Taylor, TX 76574
|
- sq. feet
|
- baths - beds |
show details | |

|
#18
Onna St
Taylor, TX 76574
|
- sq. feet
|
- baths - beds |
show details | |

|
#19
Parque Cir
Georgetown, TX 78626
|
- sq. feet
|
- baths - beds |
show details | |

|
#20
Bull Run Apt D
Taylor, TX 76574
|
- sq. feet
|
- baths - beds |
show details |
| Photo | Address | Area | Beds / Baths | Price | Details |
|---|---|---|---|---|---|

|
#21
Farm To Market 110
Georgetown, TX 78626
|
- sq. feet
|
- baths - beds |
show details | |

|
#22
Cliffbrake Way
Georgetown, TX 78626
|
- sq. feet
|
- baths - beds |
show details | |

|
#23
State Highway 195, Apt 7201
Georgetown, TX 78633
|
- sq. feet
|
- baths - beds |
show details | |

|
#24
Scenic Oaks Dr
Georgetown, TX 78628
|
- sq. feet
|
- baths - beds |
show details | |

|
#25
Farm To Market 971
Georgetown, TX 78626
|
1,120 sq. feet
|
- baths - beds |
show details | |

|
#26
E State Highway 29
Georgetown, TX 78626
|
- sq. feet
|
- baths - beds |
show details | |

|
#27
Bainbridge Rd
Temple, TX 76502
|
- sq. feet
|
- baths - beds |
show details | |

|
#28
Meadow Crest Dr
Salado, TX 76571
|
- sq. feet
|
- baths - beds |
show details | |

|
#29
Woodward Ct
Jarrell, TX 76537
|
- sq. feet
|
- baths - beds |
show details | |

|
#30
Fighting Seabees Run
Jarrell, TX 76537
|
- sq. feet
|
- baths - beds |
show details |
| Photo | Address | Area | Beds / Baths | Price | Details |
|---|---|---|---|---|---|

|
#31
Barbary Coast Ln
Jarrell, TX 76537
|
- sq. feet
|
- baths - beds |
show details | |

|
#32
Circle Way
Jarrell, TX 76537
|
- sq. feet
|
- baths - beds |
show details | |

|
#33
Wonderful Life Way
Jarrell, TX 76537
|
- sq. feet
|
- baths - beds |
show details | |

|
#34
Wonderful Life Way
Jarrell, TX 76537
|
- sq. feet
|
- baths - beds |
show details | |

|
#35
Stag Rd
Holland, TX 76534
|
- sq. feet
|
- baths - beds |
show details | |

|
#36
Sapphire Ln
Jarrell, TX 76537
|
- sq. feet
|
- baths - beds |
show details | |

|
#37
Yearwood Ln
Jarrell, TX 76537
|
- sq. feet
|
- baths - beds |
show details | |

|
#38
Ibis Falls Loop
Jarrell, TX 76537
|
- sq. feet
|
- baths - beds |
show details | |

|
#39
Ibis Falls Loop
Jarrell, TX 76537
|
- sq. feet
|
- baths - beds |
show details | |

|
#40
Rainey Dr
Jarrell, TX 76537
|
- sq. feet
|
- baths - beds |
show details |
| Photo | Address | Area | Beds / Baths | Price | Details |
|---|---|---|---|---|---|

|
#41
Barney 13b
Jarrell, TX 76537
|
- sq. feet
|
- baths - beds |
show details | |

|
#42
Druse Ln
Jarrell, TX 76537
|
- sq. feet
|
- baths - beds |
show details | |

|
#43
Creekway Ln S
Georgetown, TX 78626
|
- sq. feet
|
- baths - beds |
show details | |

|
#44
Ibis Falls Loop
Jarrell, TX 76537
|
- sq. feet
|
- baths - beds |
show details | |

|
#45
Fm 972
Georgetown, TX 78626
|
- sq. feet
|
- baths - beds |
show details | |

|
#46
Freedom Loop
Belton, TX 76513
|
- sq. feet
|
- baths - beds |
show details | |

|
#47
Twin Oaks Dr
Belton, TX 76513
|
- sq. feet
|
- baths - beds |
show details | |

|
#48
Valley Park
Temple, TX 76502
|
- sq. feet
|
- baths - beds |
show details | |

|
#49
Farm To Market 971
Granger, TX 76530
|
- sq. feet
|
- baths - beds |
show details | |

|
Check over 1 million property listings on Foreclosure.com!
|
browse all offers | |||

Latest news about housing in Bartlett, TX collected exclusively by city-data.com from local newspapers, TV, and radio stations

 | Mid-Century Modernist Homes (193 replies) |
| Elyson vs. Jordan Ranch (161 replies) |
| Austin-- Gone But Not Forgotten... (224 replies) |
| Bartlett, TX - Tell me about Bartlett (6 replies) |
| How much do homes in the inner loop cost (in safe parts)? (15 replies) |
| Cane Island - Thoughts? (154 replies) |

Median year apartment built: 1969
Household type by relationship:
Households: 1,625- Male householders: 305 (105 living alone), Female householders: 299 (43 living alone)
359 spouses (359 opposite-sex spouses), 28 unmarried partners, (28 opposite-sex unmarried partners), 401 children (384 natural, 0 adopted, 16 stepchildren), 70 grandchildren, 10 brothers or sisters, 10 parents, 6 foster children, 26 other relatives, 22 non-relatives
- In group quarters: 83
Size of family households: 223 2-persons, 61 3-persons, 117 4-persons, 33 5-persons, 11 6-persons.
Size of nonfamily households: 163 1-person, 16 2-persons, 2 3-persons.
172 married couples with children.
87 single-parent households (16 men, 71 women).
67.0% of residents of Bartlett speak English at home.
31.9% of residents speak Spanish at home (68% speak English very well, 20% speak English well, 4% speak English not well, 7% don't speak English at all).
1.5% of residents speak other Indo-European language at home (100% speak English very well).
Foreign born population: 211 (13.0%)
(49.8% of them are naturalized citizens)
| Here: | 5.4 |
| State: | 6.3 |
| Here: | 4.1 |
| State: | 4.0 |
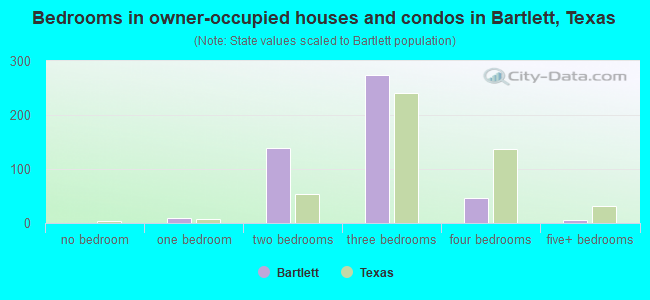
- Bedrooms in owner-occupied houses and condos in Bartlett, Texas
- 0no bedroom
- 101 bedroom
- 1382 bedrooms
- 2743 bedrooms
- 474 bedrooms
- 65+ bedrooms
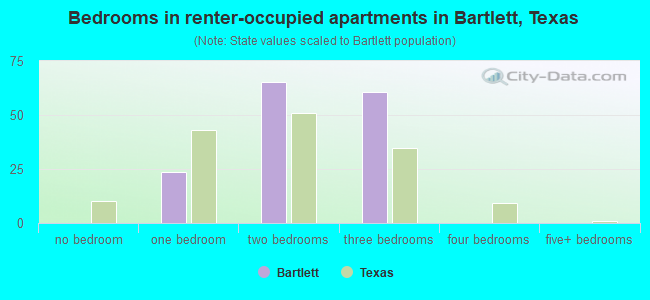
- Bedrooms in renter-occupied apartments in Bartlett, Texas
- 0no bedroom
- 241 bedroom
- 652 bedrooms
- 613 bedrooms
- 04 bedrooms
- 05+ bedrooms
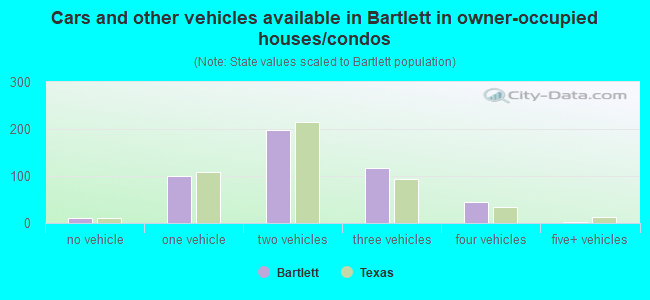
- Cars and other vehicles available in Bartlett in owner-occupied houses/condos
- 11no vehicle
- 1011 vehicle
- 1982 vehicles
- 1183 vehicles
- 444 vehicles
- 35+ vehicles
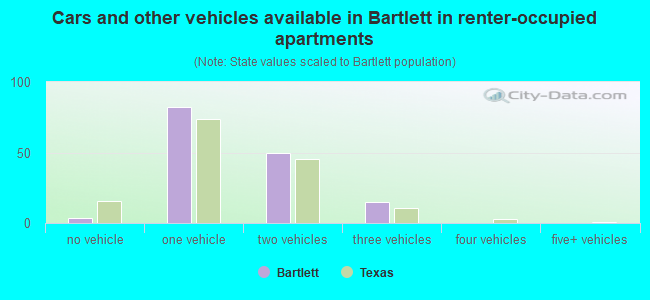
- Cars and other vehicles available in Bartlett in renter-occupied apartments
- 3no vehicle
- 821 vehicle
- 492 vehicles
- 153 vehicles
- 04 vehicles
- 05+ vehicles
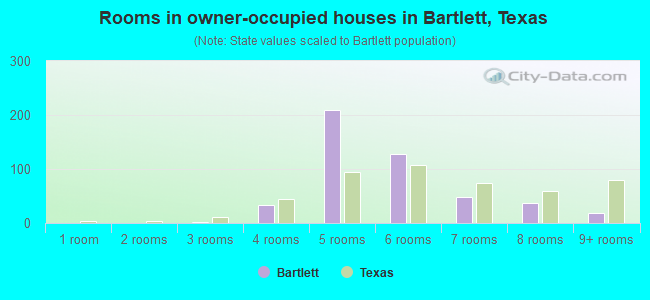
- Rooms in owner-occupied houses in Bartlett, Texas
- 01 room
- 02 rooms
- 23 rooms
- 334 rooms
- 2105 rooms
- 1276 rooms
- 487 rooms
- 378 rooms
- 189+ rooms
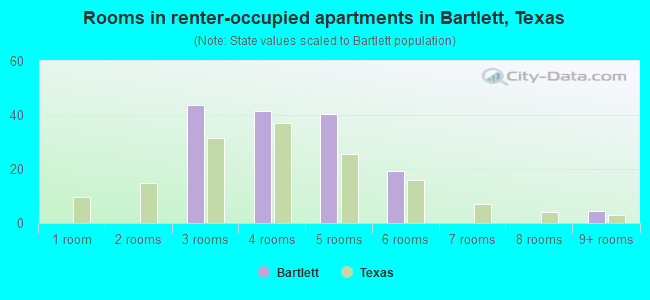
- Rooms in renter-occupied apartments in Bartlett, Texas
- 01 room
- 02 rooms
- 443 rooms
- 424 rooms
- 405 rooms
- 196 rooms
- 07 rooms
- 08 rooms
- 49+ rooms
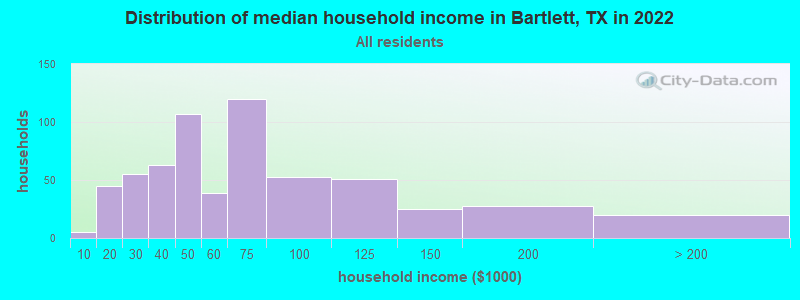
Bartlett, TX household income distribution

- 5Less than $10,000
- 45$10,000 to $19,999
- 55$20,000 to $29,999
- 63$30,000 to $39,999
- 107$40,000 to $49,999
- 39$50,000 to $59,999
- 120$60,000 to $74,999
- 53$75,000 to $99,999
- 51$100,000 to $124,999
- 25$125,000 to $149,999
- 28$150,000 to $199,999
- 20$200,000 or more
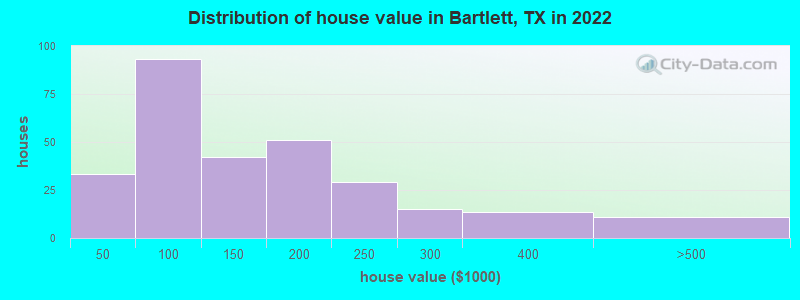
Home value of owner - occupied houses in 2022 in Bartlett, TX
-
- 18$30,000 to $34,999
- 15$35,000 to $39,999
- 41$50,000 to $59,999
- 4$60,000 to $69,999
- 32$70,000 to $79,999
- 7$80,000 to $89,999
- 8$90,000 to $99,999
- 30$100,000 to $124,999
- 11$125,000 to $149,999
- 35$150,000 to $174,999
- 15$175,000 to $199,999
- 29$200,000 to $249,999
- 14$250,000 to $299,999
- 13$300,000 to $399,999
- 11$400,000 to $499,999
Rent paid by renters in 2022 in Bartlett, TX
-
- 4Less than $100
- 2$200 to $249
- 13$250 to $299
- 35$300 to $349
- 35$400 to $449
- 27$550 to $599
- 4$750 to $799
- 3$1,000 to $1,249
- 3$1,250 to $1,499
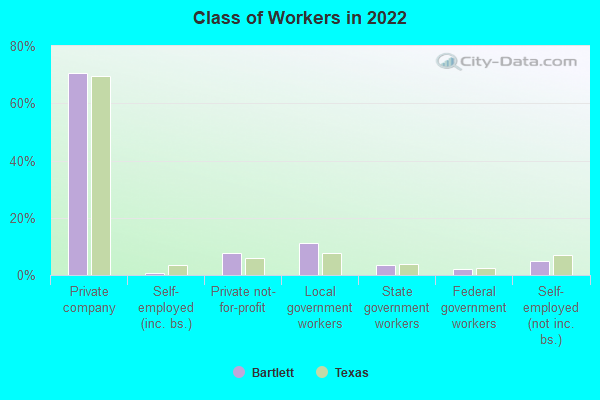
Percentage of workers working in this county: 53.3%
Number of people working at home: 48 (6.0% of all workers)
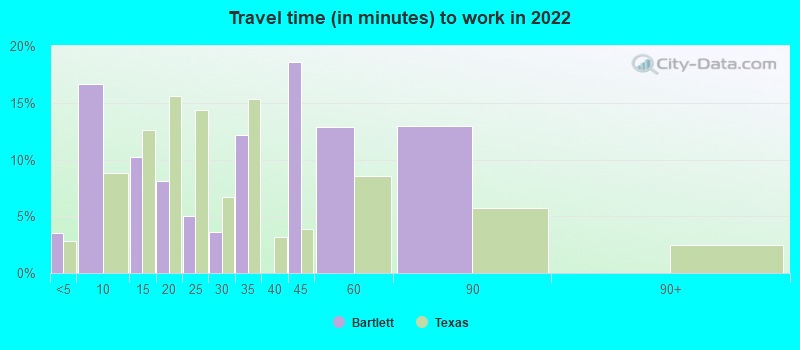
Travel time to work (commute)
- Less than 5 minutes: 85
- 5 to 9 minutes: 48
- 10 to 14 minutes: 4
- 15 to 19 minutes: 37
- 20 to 24 minutes: 104
- 25 to 29 minutes: 5
- 30 to 34 minutes: 172
- 35 to 39 minutes: 33
- 40 to 44 minutes: 33
- 45 to 59 minutes: 81
- 60 to 89 minutes: 73
- 90 or more minutes: 3
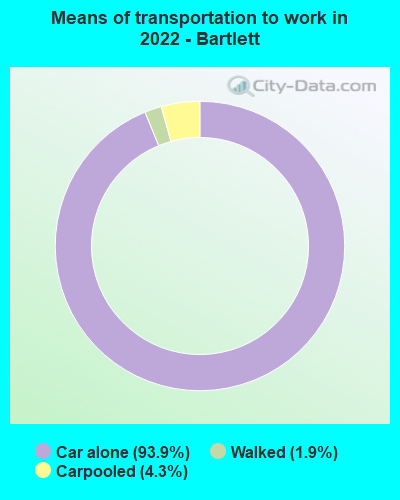
Means of transportation to work:
- Drove a car alone: 366 (80.8%)
- Carpooled: 16 (3.5%)
- Walked: 7 (1.5%)
- Worked at home: 95 (21.0%)
- Unemployment by race in 2022
- Unemployment rate for White non-Hispanic residents
- 2.1%Females
- Unemployment rate for two or more race residents
- 11.7%Males
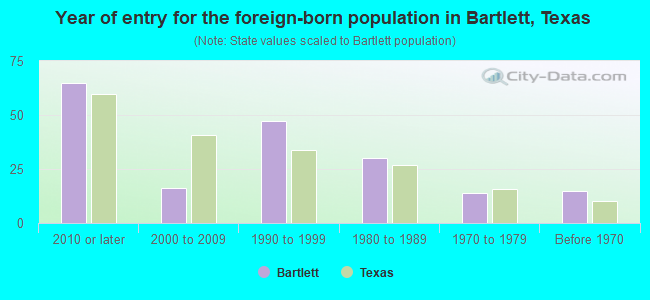
- Year of entry for the foreign-born population in Bartlett, Texas
- 652010 or later
- 162000 to 2009
- 471990 to 1999
- 301980 to 1989
- 141970 to 1979
- 15Before 1970
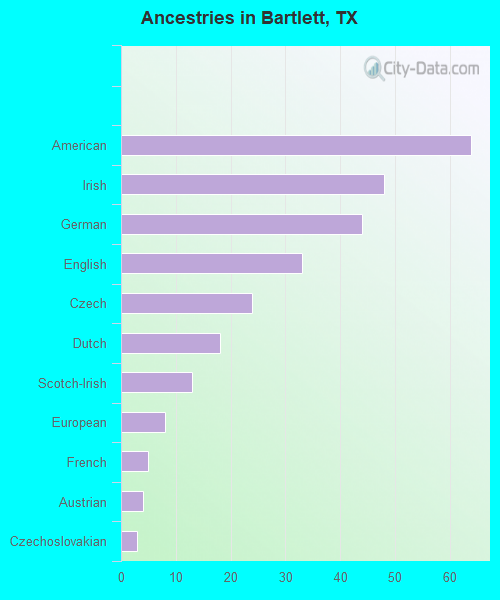
First ancestries reported:
- American: 64 (6.9%)
- Irish: 48 (5.1%)
- German: 44 (4.7%)
- English: 33 (3.5%)
- Czech: 24 (2.6%)
- Dutch: 18 (1.9%)
- Scotch-Irish: 13 (1.4%)
- European: 8 (0.9%)
- French: 5 (0.5%)
- Austrian: 4 (0.4%)
- Czechoslovakian: 3 (0.3%)
Most common places of birth for foreign-born residents (%):
| Bartlett: | 93.7% (163) |
| Texas: | 48.4% (2,411,723) |
| Bartlett: | 1.7% (3) |
| Texas: | 0.0% (2,147) |
Place of birth for U.S.-born residents:
- This state: 1,149
- Other state: 221
- Northeast: 46
- Midwest: 59
- South: 40
- West: 76
82.4% of Bartlett residents lived in the same house 1 years ago.
Out of people who lived in different houses, 31.4% lived in this county.
Out of people who lived in different counties, 43.2% lived in Texas.
| Bartlett: | 82.4% |
| State average: | 85.7% |
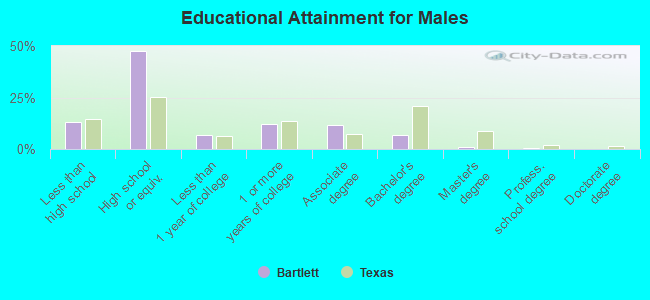
Education attainment for males 25 years and older:
- No schooling: 7
- Nursery to 4th grade: 11
- 5th and 6th grade: 2
- 7th and 8th grade: 3
- 9th grade: 8
- 10th grade: 27
- 11th grade: 11
- 12th grade, no diploma: 8
- High school graduate (or equivalency): 280
- Less than 1 year of college: 41
- Some college more than 1 year, no degree: 73
- Associate degree: 70
- Bachelor's degree: 41
- Master's degree: 5
- Professional school degree: 4
- Doctorate degree: 0
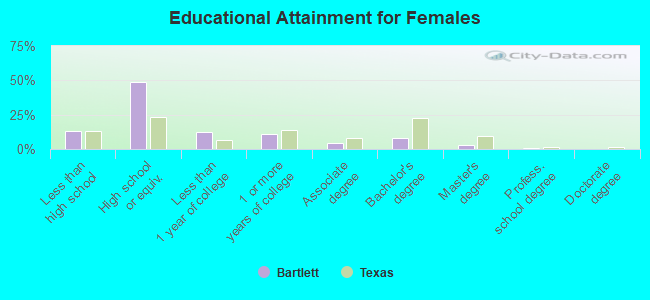
Education attainment for females 25 years and older:
- No schooling: 6
- Nursery to 4th grade: 0
- 5th and 6th grade: 16
- 7th and 8th grade: 12
- 9th grade: 22
- 10th grade: 7
- 11th grade: 0
- 12th grade, no diploma: 2
- High school graduate (or equivalency): 240
- Less than 1 year of college: 60
- Some college more than 1 year, no degree: 53
- Associate degree: 20
- Bachelor's degree: 39
- Master's degree: 13
- Professional school degree: 4
- Doctorate degree: 0


Housing units in structures:
- One, detached: 564
- One, attached: 13
- Two: 62
- 3 or 4: 3
- 50 or more: 4
- Mobile homes: 62
Housing units lacking complete kitchen facilities in 2022: 4.7%
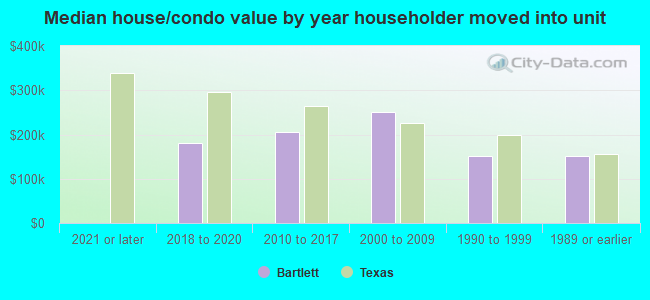
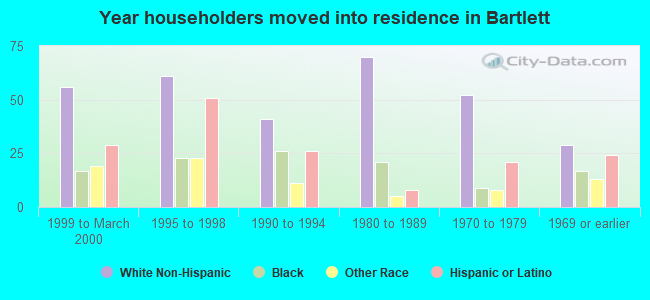
House/condo owner moved in on average 13 years ago
Renter moved in on average 5 years ago
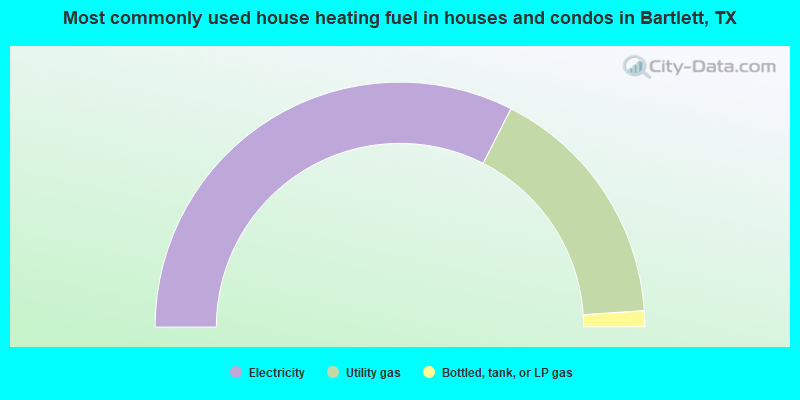
- 65.0%Electricity
- 32.9%Utility gas
- 2.1%Bottled, tank, or LP gas
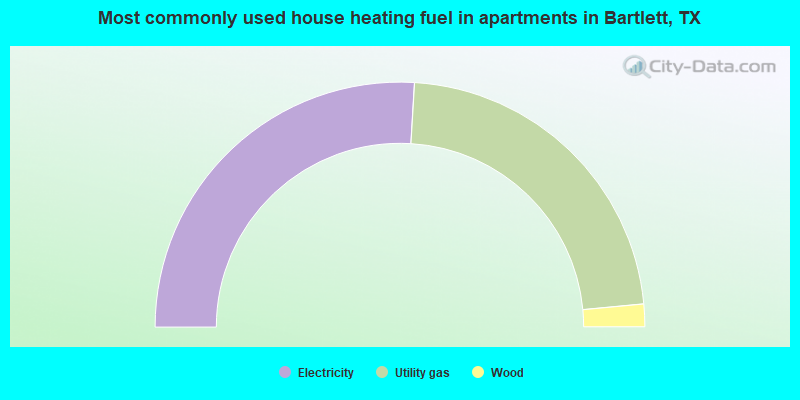
- 51.9%Electricity
- 45.1%Utility gas
- 3.0%Wood
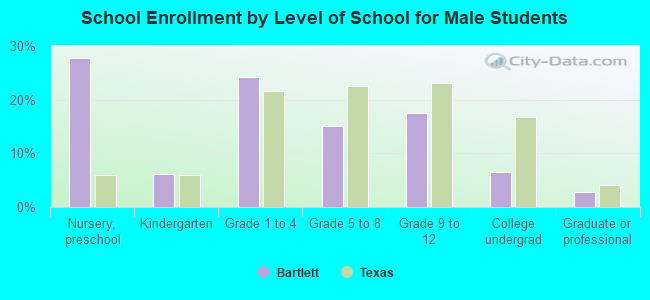
Private vs. public school enrollment:
| Here: | 0.0% |
| Texas: | 8.8% |
| Here: | 0.0% |
| Texas: | 8.0% |
| Here: | 18.2% |
| Texas: | 16.2% |