Bartonville, TX (Texas) Houses and Residents
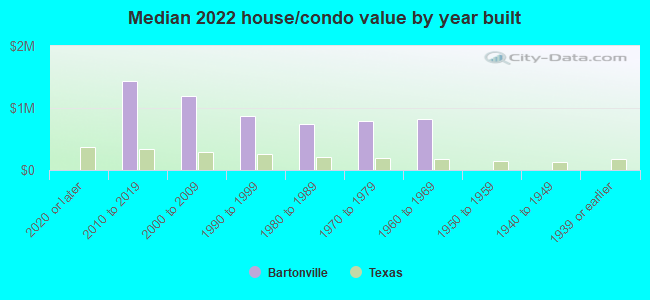
| Bartonville: | $1,007,706 |
| Texas: | $275,400 |
Mean price in 2022:
Detached houses: $1,143,113
Here: $1,143,113 State: $369,058 Mobile homes: $172,629
Here: $172,629 State: $124,413
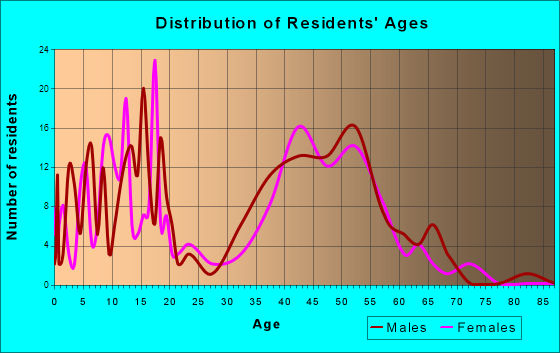
Total population: 1,659 (Urban population: 0, Rural population: 1,199 (9 farm, 1,190 nonfarm))
Houses: 727 (711 occupied: 656 owner occupied, 61 renter occupied)
| % of renters here: | 9% |
| State: | 38% |
Housing density: 121 houses/condos per square mile
Median price asked for vacant for-sale houses and condos in 2022 in this county: $270,827.
Median contract rent in 2022: $1,418 (lower quartile is $947, upper quartile is $1,813)
Median gross rent in Bartonville, TX in 2022: $1,643
Housing units in Bartonville with a mortgage: 355 (14 second mortgage, 0 home equity loan, 8 both second mortgage and home equity loan)
Houses without a mortgage: 0
Median household income for houses/condos with a mortgage: $166,552
Median household income for apartments without a mortgage: $159,417
Median monthly housing costs: $2,578
Compare current foreclosures near Bartonville, TX:
| Photo | Address | Area | Beds / Baths | Price | Details |
|---|---|---|---|---|---|

|
#1
Demarsh Lane
Denton, TX 76210
|
3,576 sq. feet
|
3 baths 4 beds |
$589,900
|
show details |

|
#2
Brazos Dr
Carrollton, TX 75007
|
- sq. feet
|
2 baths 3 beds |
show details | |

|
#3
Thornberry Dr
Fort Worth, TX 76137
|
3,369 sq. feet
|
3 baths 4 beds |
show details | |

|
#4
Lamp Post Dr
Little Elm, TX 75068
|
1,480 sq. feet
|
2 baths 3 beds |
show details | |

|
#5
Peppercorn Dr
Euless, TX 76039
|
2,552 sq. feet
|
2 baths 3 beds |
show details | |

|
#6
Franklin Dr
Aubrey, TX 76227
|
2,040 sq. feet
|
2 baths 3 beds |
show details | |

|
#7
Fair Field Dr
Grapevine, TX 76051
|
2,779 sq. feet
|
2 baths 3 beds |
show details | |

|
#8
Superbloom Ave
Justin, TX 76247
|
3,079 sq. feet
|
3 baths 5 beds |
show details | |

|
#9
Joe Pool Dr
Little Elm, TX 75068
|
1,456 sq. feet
|
2 baths 3 beds |
show details | |

|
#10
Arbor Lake Rd
Rhome, TX 76078
|
- sq. feet
|
2 baths 4 beds |
show details |
| Photo | Address | Area | Beds / Baths | Price | Details |
|---|---|---|---|---|---|

|
#11
N Park Dr
Fort Worth, TX 76148
|
1,513 sq. feet
|
2 baths 3 beds |
show details | |

|
#12
Harvest Moon Trl
Denton, TX 76210
|
1,892 sq. feet
|
2 baths 3 beds |
show details | |

|
#13
Harney Dr
Keller, TX 76244
|
2,027 sq. feet
|
2 baths 4 beds |
show details | |

|
#14
Frances Ann Ct
Haslet, TX 76052
|
2,632 sq. feet
|
2 baths 3 beds |
show details | |

|
#15
Sun Creek Dr
Little Elm, TX 75068
|
2,717 sq. feet
|
2 baths 3 beds |
show details | |

|
#16
Little Ranch Rd
North Richland Hills, TX 76182
|
2,889 sq. feet
|
3 baths 5 beds |
show details | |

|
#17
Bursey Rd
North Richland Hills, TX 76182
|
2,696 sq. feet
|
3 baths 4 beds |
show details | |

|
#18
Post Oak Ln
Carrollton, TX 75007
|
2,111 sq. feet
|
2 baths 4 beds |
show details | |

|
#19
Marshall Rd
Southlake, TX 76092
|
4,977 sq. feet
|
5 baths 5 beds |
show details | |

|
#20
Winetree Ct
Coppell, TX 75019
|
1,496 sq. feet
|
2 baths 3 beds |
show details |
| Photo | Address | Area | Beds / Baths | Price | Details |
|---|---|---|---|---|---|

|
#21
Larimar Dr
Aubrey, TX 76227
|
1,855 sq. feet
|
2 baths 3 beds |
show details | |

|
#22
13th St
Argyle, TX 76226
|
3,817 sq. feet
|
4 baths 5 beds |
show details | |

|
#23
Sienna Trl
Lewisville, TX 75067
|
1,849 sq. feet
|
2 baths 3 beds |
show details | |

|
#24
Regina Ct
Colleyville, TX 76034
|
3,703 sq. feet
|
4 baths 5 beds |
show details | |

|
#25
Big Horn Way
Fort Worth, TX 76137
|
3,237 sq. feet
|
3 baths 5 beds |
show details | |

|
#26
Ramada Trl
Justin, TX 76247
|
2,609 sq. feet
|
2 baths 4 beds |
show details | |

|
#27
Chris Dr
Keller, TX 76244
|
3,001 sq. feet
|
2 baths 4 beds |
show details | |

|
#28
Thistle Sage Ct
Irving, TX 75063
|
1,557 sq. feet
|
3 baths 3 beds |
show details | |

|
#29
Haverly Court
Keller, TX 76244
|
3,279 sq. feet
|
3 baths 4 beds |
show details | |

|
#30
Madison Cir
Lewisville, TX 75067
|
2,011 sq. feet
|
2 baths 3 beds |
show details |
| Photo | Address | Area | Beds / Baths | Price | Details |
|---|---|---|---|---|---|

|
#31
Zebra Finch Dr
Little Elm, TX 75068
|
- sq. feet
|
3 baths 5 beds |
show details | |

|
#32
Gillespie Drive
Justin, TX 76247
|
- sq. feet
|
2 baths 3 beds |
show details | |

|
#33
Leather Strap Dr
Haslet, TX 76052
|
3,021 sq. feet
|
2 baths 4 beds |
show details | |

|
#34
Meadowlark Dr
Rhome, TX 76078
|
1,782 sq. feet
|
2 baths 4 beds |
show details | |

|
#35
Redbud Cir
Carrollton, TX 75006
|
1,223 sq. feet
|
2 baths 3 beds |
show details | |

|
#36
Middleglen Ct
Haslet, TX 76052
|
3,376 sq. feet
|
2 baths 3 beds |
show details | |

|
#37
Trail Edge Dr
Grapevine, TX 76051
|
1,600 sq. feet
|
2 baths 3 beds |
show details | |

|
#38
Royal Oaks Pl
Lake Dallas, TX 75065
|
2,103 sq. feet
|
2 baths 3 beds |
show details | |

|
#39
Chinaberry Dr
Lewisville, TX 75077
|
1,647 sq. feet
|
2 baths 3 beds |
show details | |

|
#40
Barnhill Ln
Frisco, TX 75034
|
4,157 sq. feet
|
3 baths 4 beds |
show details |
| Photo | Address | Area | Beds / Baths | Price | Details |
|---|---|---|---|---|---|

|
#41
Evening Star Ct
Irving, TX 75063
|
2,152 sq. feet
|
3 baths 3 beds |
show details | |

|
#42
E Hickory St
Denton, TX 76205
|
989 sq. feet
|
1 baths 2 beds |
show details | |

|
#43
Cactus Flower Dr
Fort Worth, TX 76131
|
2,071 sq. feet
|
2 baths 4 beds |
show details | |

|
#44
Forest Street
Aubrey, TX 76227
|
2,429 sq. feet
|
2 baths 3 beds |
show details | |

|
#45
Mistletoe Dr
Argyle, TX 76226
|
3,796 sq. feet
|
4 baths 4 beds |
show details | |

|
#46
Forest St
Aubrey, TX 76227
|
- sq. feet
|
2 baths 3 beds |
show details | |

|
#47
Shoreham Cir
The Colony, TX 75056
|
4,012 sq. feet
|
3 baths 4 beds |
show details | |

|
#48
Silverwood Trl
Keller, TX 76244
|
2,401 sq. feet
|
2 baths 4 beds |
show details | |

|
#49
Dalton St
Keller, TX 76244
|
3,634 sq. feet
|
4 baths 5 beds |
show details | |

|
Check over 1 million property listings on Foreclosure.com!
|
browse all offers | |||

Latest news about housing in Bartonville, TX collected exclusively by city-data.com from local newspapers, TV, and radio stations

 | Why Homes in the Exurbs Aren't Built to Last (103 replies) |
| Homes with land? (25 replies) |
| What is considered the fanciest Dallas suburb? (105 replies) |
| Interested in Copper Canyon, TX (21 replies) |
| Any suburbs actively limiting growth? (46 replies) |
| What's up with the garages in the back? (176 replies) |
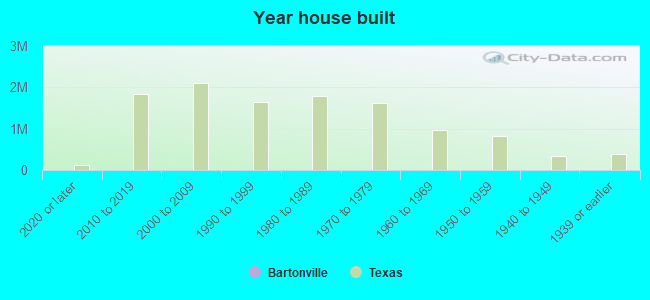
Median year apartment built: 1991
Household type by relationship:
Households: 2,090- Male householders: 377 (23 living alone), Female householders: 332 (70 living alone)
576 spouses (576 opposite-sex spouses), 50 unmarried partners, (27 opposite-sex unmarried partners), 680 children (625 natural, 35 adopted, 19 stepchildren), 6 grandchildren, 7 brothers or sisters, 11 parents, 0 foster children, 17 other relatives, 30 non-relatives
Size of family households: 275 2-persons, 105 3-persons, 103 4-persons, 68 5-persons, 9 6-persons, 15 7-or-more-persons.
Size of nonfamily households: 95 1-person, 39 2-persons.
487 married couples with children.
21 single-parent households (8 men, 13 women).
85.9% of residents of Bartonville speak English at home.
10.8% of residents speak Spanish at home (87% speak English very well, 5% speak English well, 3% speak English not well, 5% don't speak English at all).
1.4% of residents speak other Indo-European language at home (100% speak English very well).
1.1% of residents speak Asian or Pacific Island language at home (81% speak English very well, 10% speak English well, 10% speak English not well).
0.4% of residents speak other language at home (100% speak English very well).
Foreign born population: 166 (7.9%)
(44.0% of them are naturalized citizens)
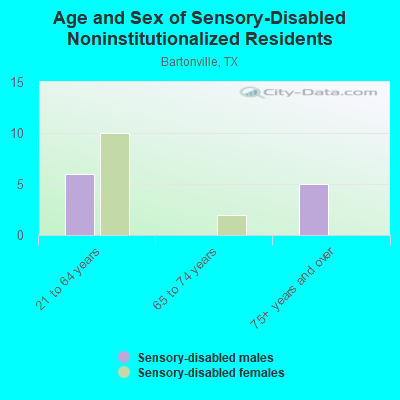
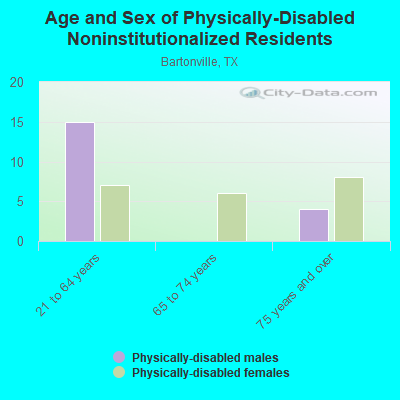
| Here: | 10.0 |
| State: | 6.3 |
| Here: | 4.5 |
| State: | 4.0 |
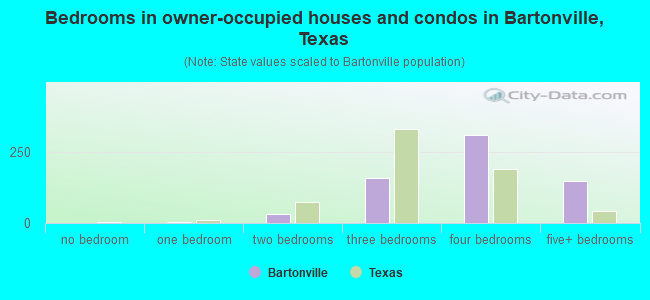
- Bedrooms in owner-occupied houses and condos in Bartonville, Texas
- 0no bedroom
- 51 bedroom
- 322 bedrooms
- 1603 bedrooms
- 3104 bedrooms
- 1485+ bedrooms
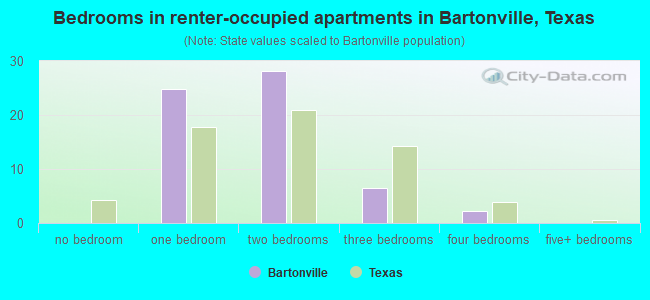
- Bedrooms in renter-occupied apartments in Bartonville, Texas
- 0no bedroom
- 251 bedroom
- 282 bedrooms
- 63 bedrooms
- 24 bedrooms
- 05+ bedrooms
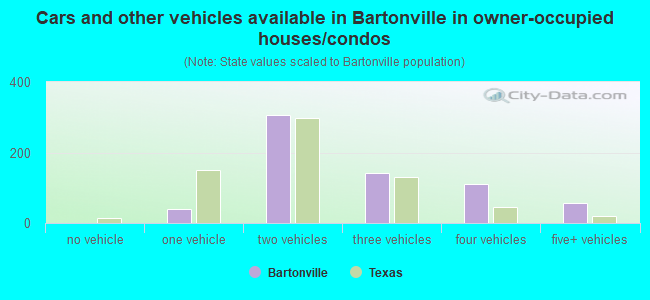
- Cars and other vehicles available in Bartonville in owner-occupied houses/condos
- 0no vehicle
- 401 vehicle
- 3052 vehicles
- 1423 vehicles
- 1114 vehicles
- 585+ vehicles
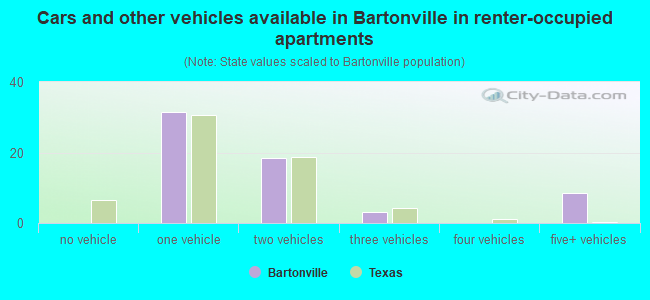
- Cars and other vehicles available in Bartonville in renter-occupied apartments
- 0no vehicle
- 311 vehicle
- 182 vehicles
- 33 vehicles
- 04 vehicles
- 95+ vehicles
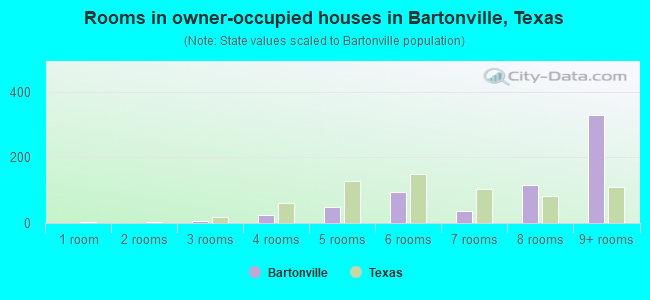
- Rooms in owner-occupied houses in Bartonville, Texas
- 01 room
- 02 rooms
- 53 rooms
- 244 rooms
- 505 rooms
- 956 rooms
- 377 rooms
- 1168 rooms
- 3309+ rooms
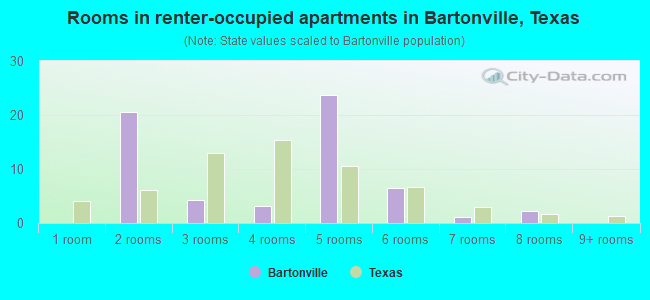
- Rooms in renter-occupied apartments in Bartonville, Texas
- 01 room
- 212 rooms
- 43 rooms
- 34 rooms
- 245 rooms
- 66 rooms
- 17 rooms
- 28 rooms
- 09+ rooms
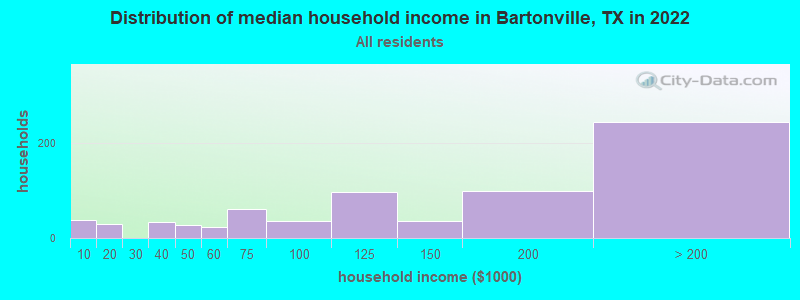
Bartonville, TX household income distribution

- 37Less than $10,000
- 30$10,000 to $19,999
- 34$30,000 to $39,999
- 27$40,000 to $49,999
- 24$50,000 to $59,999
- 60$60,000 to $74,999
- 36$75,000 to $99,999
- 96$100,000 to $124,999
- 35$125,000 to $149,999
- 98$150,000 to $199,999
- 244$200,000 or more
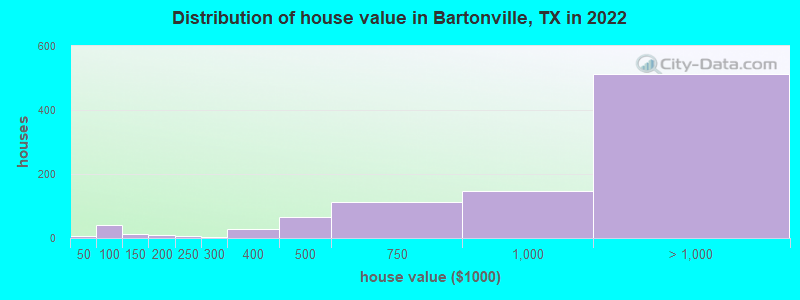
Home value of owner - occupied houses in 2022 in Bartonville, TX
-
- 7Less than $10,000
- 3$50,000 to $59,999
- 29$70,000 to $79,999
- 7$90,000 to $99,999
- 10$100,000 to $124,999
- 6$150,000 to $174,999
- 1$175,000 to $199,999
- 5$200,000 to $249,999
- 2$250,000 to $299,999
- 27$300,000 to $399,999
- 67$400,000 to $499,999
- 114$500,000 to $749,999
- 146$750,000 to $999,999
- 301$1,000,000 to $1,499,999
- 54$1,500,000 to $1,999,999
- 154$2,000,000 or more
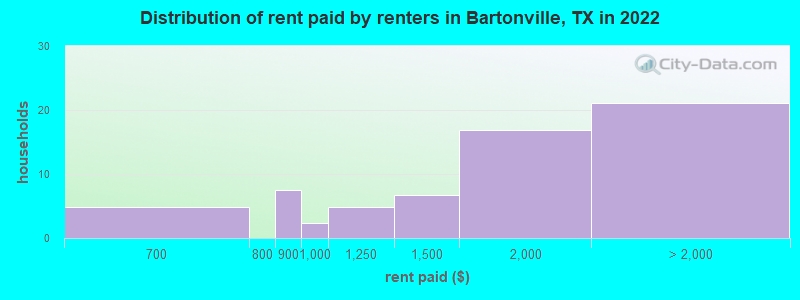
Rent paid by renters in 2022 in Bartonville, TX
-
- 4$600 to $649
- 7$800 to $899
- 2$900 to $999
- 4$1,000 to $1,249
- 6$1,250 to $1,499
- 16$1,500 to $1,999
- 2$3,000 to $3,499
- 18No cash rent
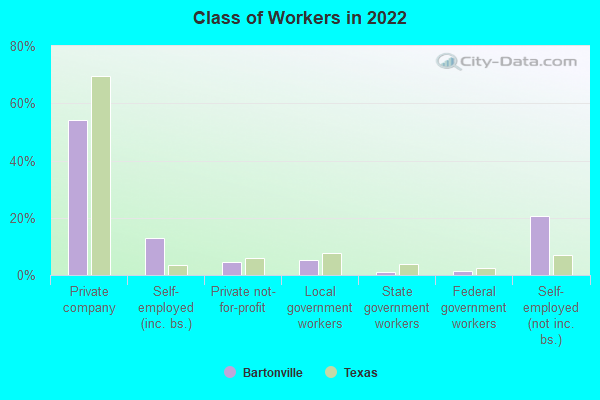
Percentage of workers working in this county: 73.2%
Number of people working at home: 375 (40.7% of all workers)
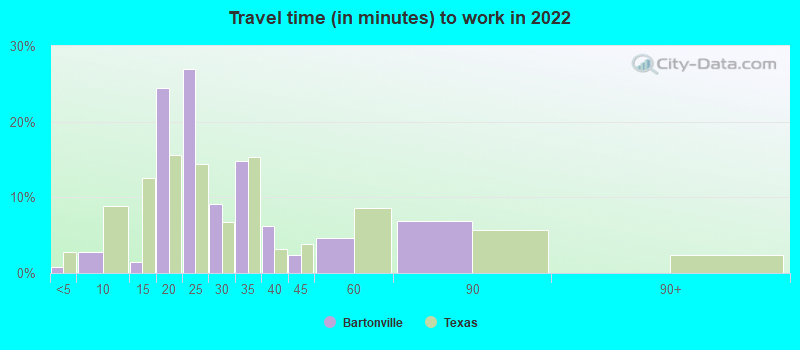
Travel time to work (commute)
- Less than 5 minutes: 11
- 5 to 9 minutes: 15
- 10 to 14 minutes: 36
- 15 to 19 minutes: 77
- 20 to 24 minutes: 73
- 25 to 29 minutes: 52
- 30 to 34 minutes: 119
- 35 to 39 minutes: 1
- 40 to 44 minutes: 33
- 45 to 59 minutes: 107
- 60 to 89 minutes: 49
- 90 or more minutes: 16
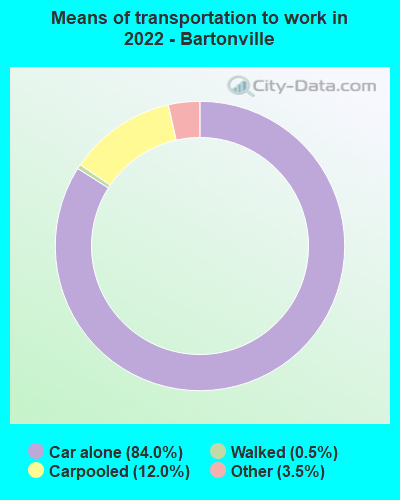
Means of transportation to work:
- Drove a car alone: 803 (60.5%)
- Carpooled: 97 (7.3%)
- Taxi: 36 (2.7%)
- Walked: 3 (0.2%)
- Worked at home: 375 (28.2%)
- Unemployment by race in 2022
- Unemployment rate for White non-Hispanic residents
- 1.2%Males
- 2.7%Females
- Unemployment rate for Black residents
- 100.0%Males
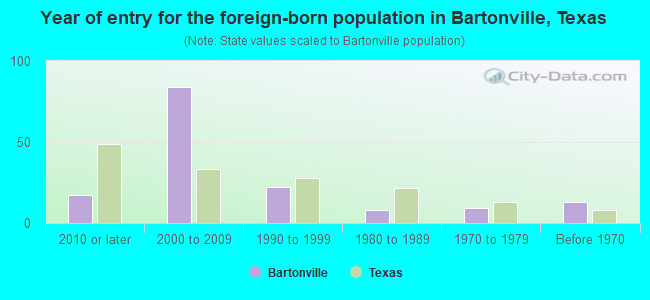
- Year of entry for the foreign-born population in Bartonville, Texas
- 172010 or later
- 842000 to 2009
- 221990 to 1999
- 81980 to 1989
- 91970 to 1979
- 13Before 1970
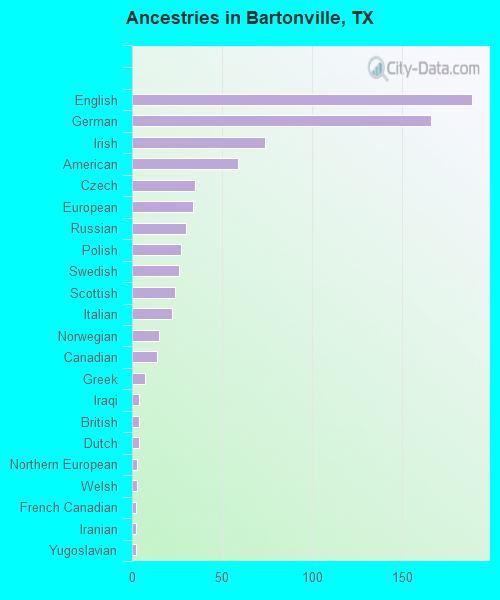
First ancestries reported:
- English: 189 (18.6%)
- German: 166 (16.4%)
- Irish: 74 (7.3%)
- American: 59 (5.8%)
- Czech: 35 (3.5%)
- European: 34 (3.4%)
- Russian: 30 (3.0%)
- Polish: 27 (2.7%)
- Swedish: 26 (2.6%)
- Scottish: 24 (2.4%)
- Italian: 22 (2.2%)
- Norwegian: 15 (1.5%)
- Canadian: 14 (1.4%)
- Greek: 7 (0.7%)
- Iraqi: 4 (0.4%)
- British: 4 (0.4%)
- Dutch: 4 (0.4%)
- Northern European: 3 (0.3%)
- Welsh: 3 (0.3%)
- French Canadian: 2 (0.2%)
- Iranian: 2 (0.2%)
- Yugoslavian: 2 (0.2%)
Most common places of birth for foreign-born residents (%):
| Bartonville: | 52.6% (82) |
| Texas: | 48.4% (2,411,723) |
| Bartonville: | 9.0% (14) |
| Texas: | 1.1% (55,371) |
| Bartonville: | 7.1% (11) |
| Texas: | 0.2% (8,227) |
| Bartonville: | 5.8% (9) |
| Texas: | 0.8% (37,989) |
| Bartonville: | 3.2% (5) |
| Texas: | 0.1% (4,593) |
| Bartonville: | 2.6% (4) |
| Texas: | 0.5% (26,598) |
| Bartonville: | 2.6% (4) |
| Texas: | 0.1% (4,334) |
| Bartonville: | 2.6% (4) |
| Texas: | 0.4% (20,885) |
| Bartonville: | 2.6% (4) |
| Texas: | 3.7% (184,770) |
| Bartonville: | 1.9% (3) |
| Texas: | 0.5% (26,969) |
| Bartonville: | 1.9% (3) |
| Texas: | 2.3% (115,558) |
Place of birth for U.S.-born residents:
- This state: 945
- Other state: 921
- Northeast: 177
- Midwest: 253
- South: 269
- West: 218
84.1% of Bartonville residents lived in the same house 1 years ago.
Out of people who lived in different houses, 24.9% lived in this county.
Out of people who lived in different counties, 75.5% lived in Texas.
| Bartonville: | 84.1% |
| State average: | 85.7% |
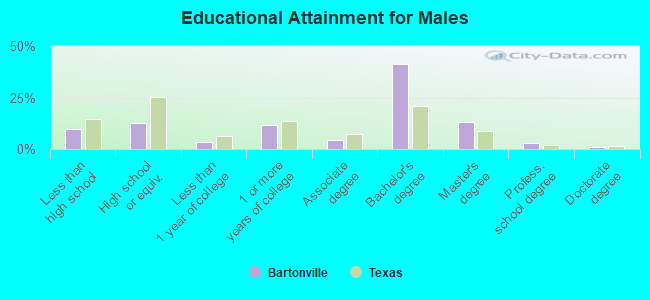
Education attainment for males 25 years and older:
- No schooling: 16
- Nursery to 4th grade: 0
- 5th and 6th grade: 32
- 7th and 8th grade: 12
- 9th grade: 0
- 10th grade: 0
- 11th grade: 7
- 12th grade, no diploma: 0
- High school graduate (or equivalency): 86
- Less than 1 year of college: 23
- Some college more than 1 year, no degree: 82
- Associate degree: 31
- Bachelor's degree: 285
- Master's degree: 91
- Professional school degree: 21
- Doctorate degree: 7
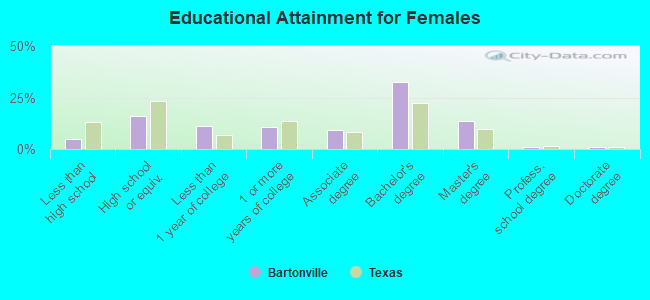
Education attainment for females 25 years and older:
- No schooling: 25
- Nursery to 4th grade: 0
- 5th and 6th grade: 0
- 7th and 8th grade: 0
- 9th grade: 0
- 10th grade: 1
- 11th grade: 7
- 12th grade, no diploma: 4
- High school graduate (or equivalency): 120
- Less than 1 year of college: 84
- Some college more than 1 year, no degree: 80
- Associate degree: 70
- Bachelor's degree: 244
- Master's degree: 101
- Professional school degree: 7
- Doctorate degree: 7
Housing units in structures:
- One, detached: 643
- One, attached: 18
- 10 to 19: 3
- Mobile homes: 63
Median worth of mobile homes: $148,681
Housing units lacking complete kitchen facilities in 2022: 1.2%
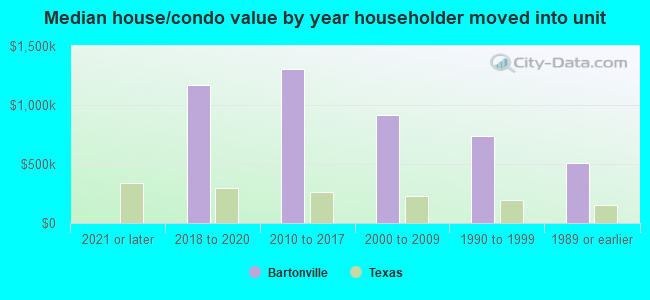
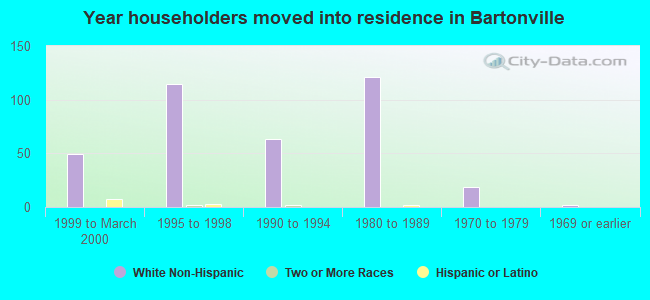
House/condo owner moved in on average 9 years ago
Renter moved in on average 0 years ago
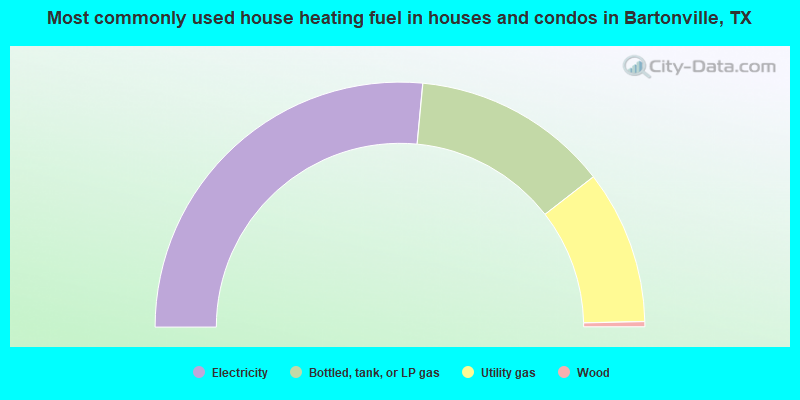
- 53.0%Electricity
- 26.0%Bottled, tank, or LP gas
- 20.3%Utility gas
- 0.7%Wood
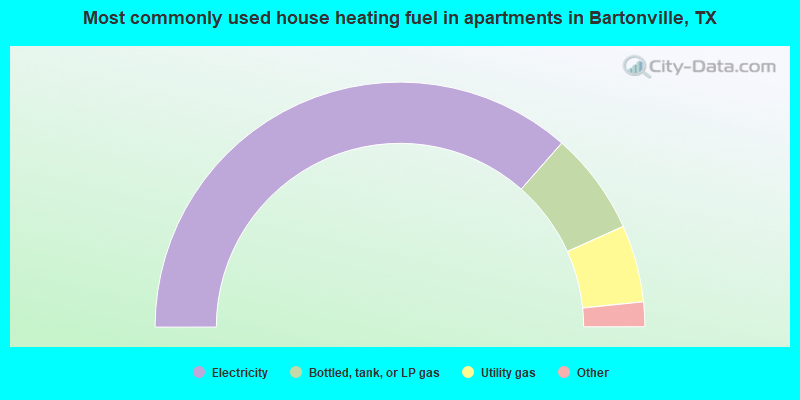
- 75.4%Electricity
- 14.0%Bottled, tank, or LP gas
- 10.5%Utility gas
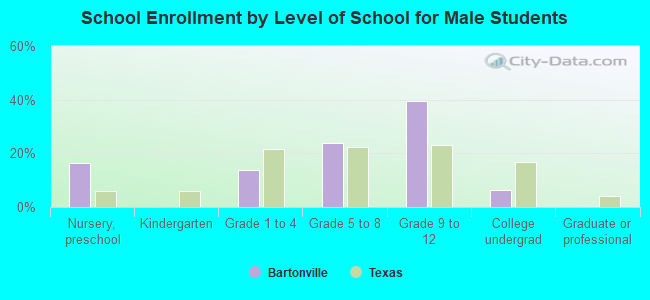
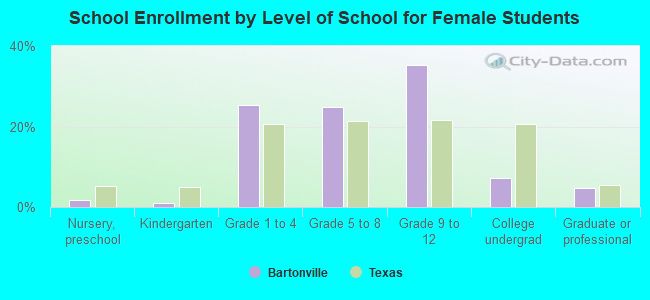
Private vs. public school enrollment:
| Here: | 43.2% |
| Texas: | 8.8% |
| Here: | 8.0% |
| Texas: | 8.0% |
| Here: | 9.1% |
| Texas: | 16.2% |