Bell Gardens, CA (California) Houses and Residents
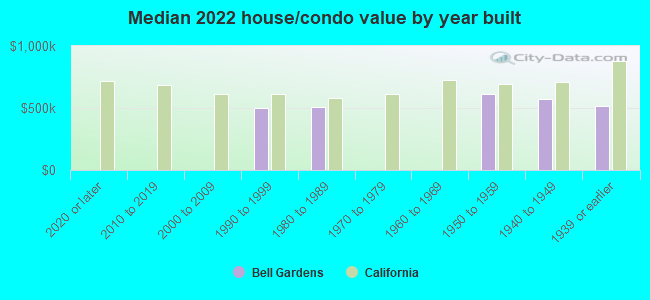
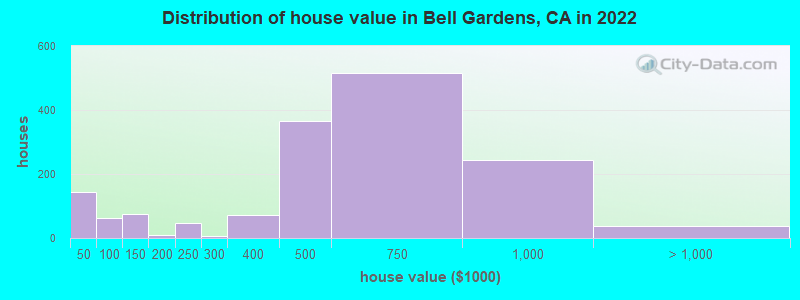
Estimated median house or condo value in 2022: $526,688 (it was $171,700 in 2000 )
Bell Gardens:
$526,688California:
$715,900
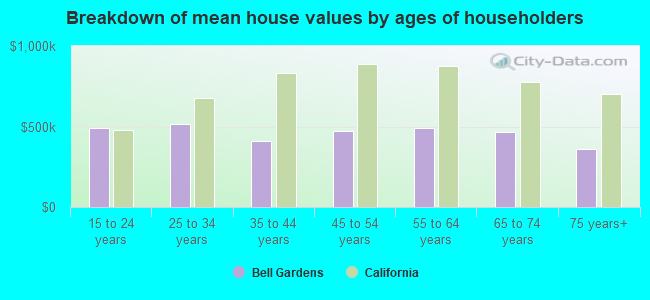
Lower value quartile - upper value quartile: $369,159 - $717,617Mean price in 2022: Detached houses: $740,448 Here:
$740,448State:
$988,808
Townhouses or other attached units: $651,949 Here:
$651,949State:
$838,546
In 2-unit structures: $442,542 Here:
$442,542State:
$1,138,100
In 3-to-4-unit structures: $629,418 Here:
$629,418State:
$824,253
In 5-or-more-unit structures: $445,597 Here:
$445,597State:
$730,996
Mobile homes: $60,670 Here:
$60,670State:
$184,506
Total population: 43,146 (All urban)
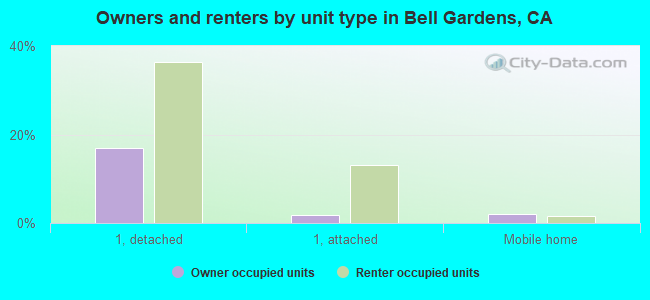
Houses: 9,894 (9,635 occupied: 1,893 owner occupied, 7,778 renter occupied )
% of renters here:
80%State:
44%
Housing density: 3,980 houses/condos per square mile
Median price asked for vacant for-sale houses and condos in 2022 in this county: $1,291,802.
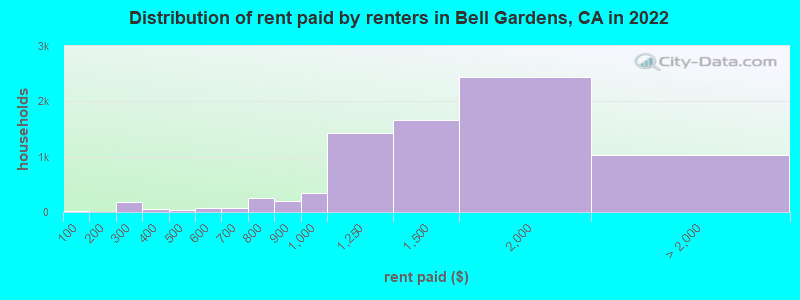
Median contract rent in 2022: $1,421 (lower quartile is $1,116, upper quartile is $1,788)
Median rent asked for vacant for-rent units in 2022: $1,158
Median gross rent in Bell Gardens, CA in 2022: $1,544
Housing units in Bell Gardens with a mortgage: 889 (53 second mortgage, 0 home equity loan, 27 both second mortgage and home equity loan )Houses without a mortgage: 27
Median household income for houses/condos with a mortgage: $76,419
Median household income for apartments without a mortgage: $60,421
Median monthly housing costs: $1,483
Data:
Median house or condo value ($)
Median house or condo value ($ change since 2000)
Median house or condo value ($) - White
Median house or condo value ($) - Black or African American
Median house or condo value ($) - Asian
Median house or condo value ($) - Hispanic or Latino
Median house or condo value ($) - American Indian and Alaska Native
Median house or condo value ($) - Multirace
Median house or condo value ($) - Other Race
Median price asked for mobile homes ($)
Household density (households per square mile)
Mean house or condo value by units in structure - 1, detached ($)
Mean house or condo value by units in structure - 1, attached ($)
Mean house or condo value by units in structure - 2 ($)
Mean house or condo value by units in structure by units in structure - 3 or 4 ($)
Mean house or condo value by units in structure - 5 or more ($)
Mean house or condo value by units in structure - Boat, RV, van, etc. ($)
Mean house or condo value by units in structure - Mobile home ($)
Median contract rent ($)
Median contract rent - Lower quartile ($)
Median contract rent - Upper quartile ($)
Median gross rent ($)
Urban houses (%)
Rural houses (%)
Houses occupied (%)
Houses occupied (% change since 2000)
Houses owner occupied (%)
Houses owner occupied (% change since 2000)
Houses renter occupied (%)
Houses renter occupied (% change since 2000)
Vacant housing units - For rent (%)
Vacant housing units - For rent (% change since 2000)
Vacant housing units - For sale only (%)
Vacant housing units - For sale only (% change since 2000)
Vacant housing units - Rented or sold, not occupied (%)
Vacant housing units - Rented or sold, not occupied (% change since 2000)
Vacant housing units - For seasonal, recreational, or occasional use (%)
Vacant housing units - For seasonal, recreational, or occasional use (% change since 2000)
Vacant housing units - For migrant workers (%)
Vacant housing units - For migrant workers (% change since 2000)
Vacant housing units - Other vacant (%)
Vacant housing units - Other vacant (% change since 2000)
Median monthly housing costs ($)
Median household income for houses/condos with a mortgage ($)
Median household income for houses/condos without a mortgage ($)
Median household income ($)
Median household income ($) - White
Median household income ($) - Black or African American
Median household income ($) - Asian
Median household income ($) - Hispanic or Latino
Median household income ($) - American Indian and Alaska Native
Median household income ($) - Multirace
Median household income ($) - Other Race
Mortgage status - with mortgage (%)
Mortgage status - with second mortgage (%)
Mortgage status - with home equity loan (%)
Mortgage status - with both second mortgage and home equity loan (%)
Mortgage status - without a mortgage (%)
Median year house/condo built
Median year apartment built
Household type by relationship - Male householder living alone (%)
Household type by relationship - Male householder not living alone (%)
Household type by relationship - Female householder living alone (%)
Household type by relationship - Female householder not living alone (%)
Household type by relationship - Opposite-Sex spouse (%)
Household type by relationship - Same-Sex spouse (%)
Household type by relationship - Opposite-Sex unmarried partner (%)
Household type by relationship - Same-Sex unmarried partner (%)
Household type by relationship - In group quarters (%)
Size of family households - 2-person household (%)
Size of family households - 3-person household (%)
Size of family households - 4-person household (%)
Size of family households - 5-person household (%)
Size of family households - 6-person household (%)
Size of family households - 7-or-more-person household (%)
Size of nonfamily households - 1-person household (%)
Size of nonfamily households - 2-person household (%)
Size of nonfamily households - 3-person household (%)
Size of nonfamily households - 4-person household (%)
Size of nonfamily households - 5-person household (%)
Size of nonfamily households - 6-person household (%)
Size of nonfamily households - 7-or-moreperson household (%)
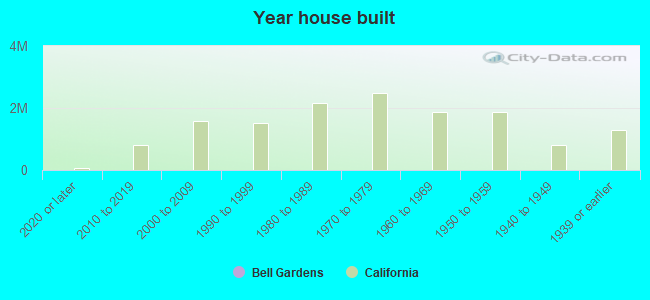
Year house built - Built 2010 or later (%)
Year house built - Built 2000 to 2009 (%)
Year house built - Built 1990 to 1999 (%)
Year house built - Built 1980 to 1989 (%)
Year house built - Built 1970 to 1979 (%)
Year house built - Built 1960 to 1969 (%)
Year house built - Built 1950 to 1959 (%)
Year house built - Built 1940 to 1949 (%)
Year house built - Built 1939 or earlier (%)
Median number of rooms in houses and condos
Median number of rooms in apartments
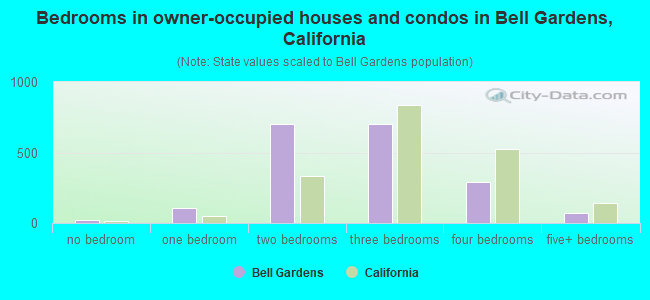
Median number of bedrooms in owner occupied houses
Mean number of bedrooms in owner occupied houses
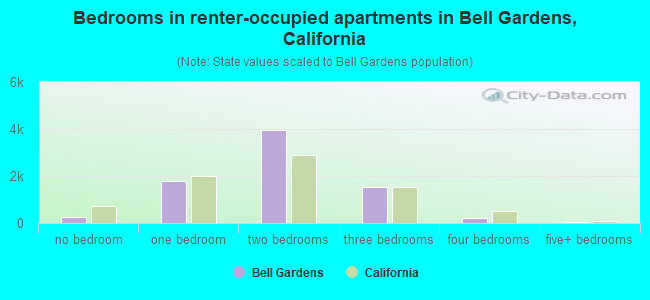
Median number of bedrooms in renter occupied houses
Mean number of bedrooms in renter occupied houses
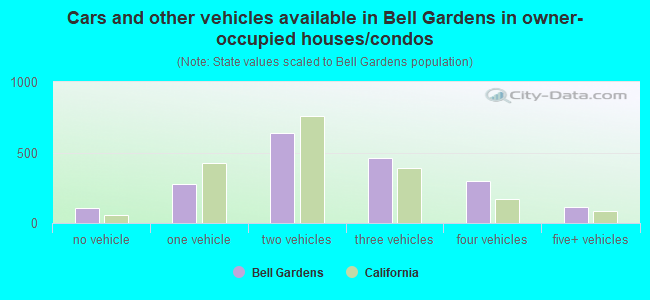
Median number of vehichles in owner occupied houses
Mean number of vehichles in owner occupied houses
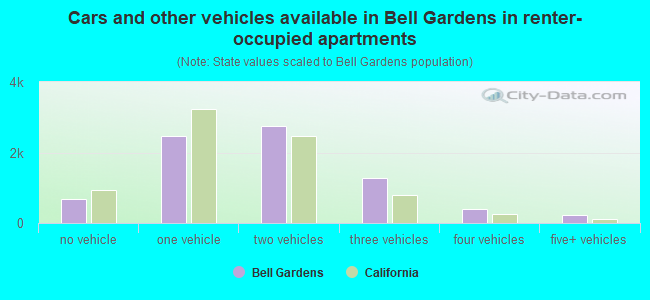
Median number of vehichles in renter occupied houses
Mean number of vehichles in renter occupied houses
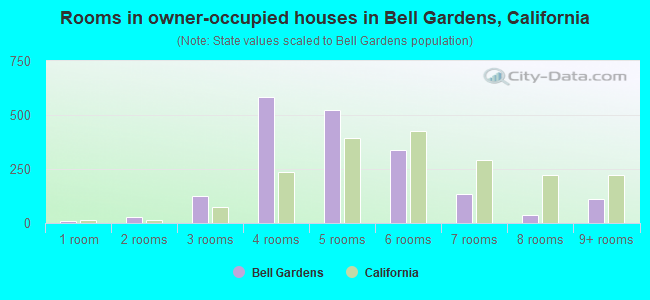
Rooms in owner-occupied houses - 1 room (%)
Rooms in owner-occupied houses - 2 rooms (%)
Rooms in owner-occupied houses - 3 rooms (%)
Rooms in owner-occupied houses - 4 rooms (%)
Rooms in owner-occupied houses - 5 rooms (%)
Rooms in owner-occupied houses - 6 rooms (%)
Rooms in owner-occupied houses - 7 rooms (%)
Rooms in owner-occupied houses - 8 rooms (%)
Rooms in owner-occupied houses - 9+ rooms (%)
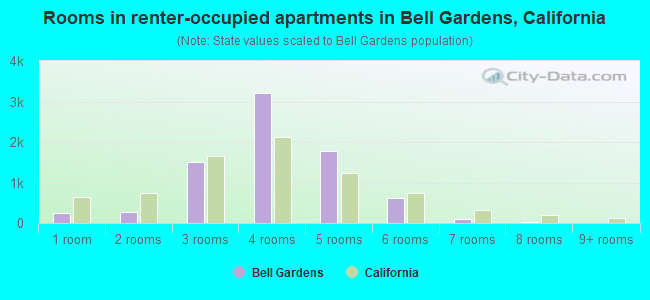
Rooms in renter-occupied houses - 1 room (%)
Rooms in renter-occupied houses - 2 rooms (%)
Rooms in renter-occupied houses - 3 rooms (%)
Rooms in renter-occupied houses - 4 rooms (%)
Rooms in renter-occupied houses - 5 rooms (%)
Rooms in renter-occupied houses - 6 rooms (%)
Rooms in renter-occupied houses - 7 rooms (%)
Rooms in renter-occupied houses - 8 rooms (%)
Rooms in renter-occupied houses - 9+ rooms (%)
Bedrooms in owner-occupied houses - no bedrooms (%)
Bedrooms in owner-occupied houses - 1 bedroom (%)
Bedrooms in owner-occupied houses - 2 bedrooms (%)
Bedrooms in owner-occupied houses - 3 bedrooms (%)
Bedrooms in owner-occupied houses - 4 bedrooms (%)
Bedrooms in owner-occupied houses - 5+ bedrooms (%)
Bedrooms in renter-occupied houses - no bedrooms (%)
Bedrooms in renter-occupied houses - 1 bedroom (%)
Bedrooms in renter-occupied houses - 2 bedrooms (%)
Bedrooms in renter-occupied houses - 3 bedrooms (%)
Bedrooms in renter-occupied houses - 4 bedrooms (%)
Bedrooms in renter-occupied houses - 5+ bedrooms (%)
Vehicles available in owner-occupied houses - no vehicle available (%)
Vehicles available in owner-occupied houses - 1 vehicle available(%)
Vehicles available in owner-occupied houses - 2 Vehicles available (%)
Vehicles available in owner-occupied houses - 3 Vehicles available (%)
Vehicles available in owner-occupied houses - 4 Vehicles available (%)
Vehicles available in owner-occupied houses - 5+ Vehicles available (%)
Vehicles available in renter-occupied houses - no vehicle available (%)
Vehicles available in renter-occupied houses - 1 vehicle available (%)
Vehicles available in renter-occupied houses - 2 Vehicles available (%)
Vehicles available in renter-occupied houses - 3 Vehicles available (%)
Vehicles available in renter-occupied houses - 4 Vehicles available (%)
Vehicles available in renter-occupied houses - 5+ Vehicles available (%)
Housing units in structures - 1, detached (%)
Housing units in structures - 1, attached (%)
Housing units in structures - 2 (%)
Housing units in structures - 3 or 4 (%)
Housing units in structures - 5 to 9 (%)
Housing units in structures - 10 to 19 (%)
Housing units in structures - 20 to 49 (%)
Housing units in structures - 50 or more (%)
Housing units in structures - Mobile home (%)
Housing units in structures - Boat, RV, van, etc. (%)
Housing units in structures - Owners - 1, detached (%)
Housing units in structures - Owners - 1, attached (%)
Housing units in structures - Owners - 2 (%)
Housing units in structures - Owners - 3 or 4 (%)
Housing units in structures - Owners - 5 to 9 (%)
Housing units in structures - Owners - 10 to 19 (%)
Housing units in structures - Owners - 20 to 49 (%)
Housing units in structures - Owners - 50 or more (%)
Housing units in structures - Owners - Mobile home (%)
Housing units in structures - Owners - Boat, RV, van, etc. (%)
Housing units in structures - Renters - 1, detached (%)
Housing units in structures - Renters - 1, attached (%)
Housing units in structures - Renters - 2 (%)
Housing units in structures - Renters - 3 or 4 (%)
Housing units in structures - Renters - 5 to 9 (%)
Housing units in structures - Renters - 10 to 19 (%)
Housing units in structures - Renters - 20 to 49 (%)
Housing units in structures - Renters - 50 or more (%)
Housing units in structures - Renters - Mobile home (%)
Housing units in structures - Renters - Boat, RV, van, etc. (%)
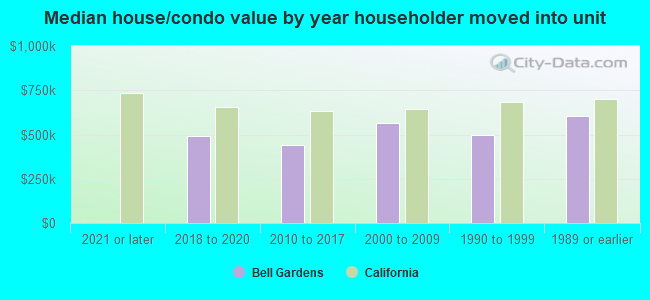
House/condo owner moved in on average (years ago)
Renter moved in on average (years ago)
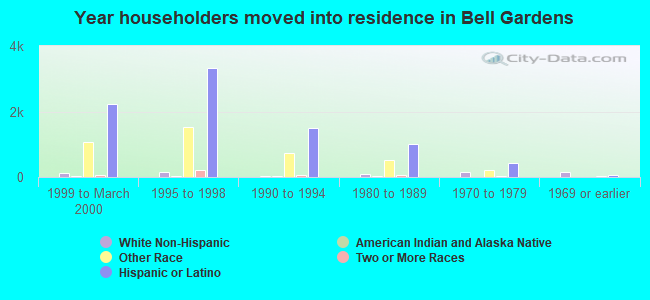
Year householder moved into unit - Moved in 1999 to March 2000 (%)
Year householder moved into unit - Moved in 1999 to March 2000 (%) - White
Year householder moved into unit - Moved in 1999 to March 2000 (%) - Black or African American
Year householder moved into unit - Moved in 1999 to March 2000 (%) - Asian
Year householder moved into unit - Moved in 1999 to March 2000 (%) - Hispanic or Latino
Year householder moved into unit - Moved in 1999 to March 2000 (%) - American Indian and Alaska Native
Year householder moved into unit - Moved in 1999 to March 2000 (%) - Multirace
Year householder moved into unit - Moved in 1999 to March 2000 (%) - Other Race
Year householder moved into unit - Moved in 1995 to 1998 (%)
Year householder moved into unit - Moved in 1995 to 1998 (%) - White
Year householder moved into unit - Moved in 1995 to 1998 (%) - Black or African American
Year householder moved into unit - Moved in 1995 to 1998 (%) - Asian
Year householder moved into unit - Moved in 1995 to 1998 (%) - Hispanic or Latino
Year householder moved into unit - Moved in 1995 to 1998 (%) - American Indian and Alaska Native
Year householder moved into unit - Moved in 1995 to 1998 (%) - Multirace
Year householder moved into unit - Moved in 1995 to 1998 (%) - Other Race
Year householder moved into unit - Moved in 1990 to 1994 (%)
Year householder moved into unit - Moved in 1990 to 1994 (%) - White
Year householder moved into unit - Moved in 1990 to 1994 (%) - Black or African American
Year householder moved into unit - Moved in 1990 to 1994 (%) - Asian
Year householder moved into unit - Moved in 1990 to 1994 (%) - Hispanic or Latino
Year householder moved into unit - Moved in 1990 to 1994 (%) - American Indian and Alaska Native
Year householder moved into unit - Moved in 1990 to 1994 (%) - Multirace
Year householder moved into unit - Moved in 1990 to 1994 (%) - Other Race
Year householder moved into unit - Moved in 1980 to 1989 (%)
Year householder moved into unit - Moved in 1980 to 1989 (%) - White
Year householder moved into unit - Moved in 1980 to 1989 (%) - Black or African American
Year householder moved into unit - Moved in 1980 to 1989 (%) - Asian
Year householder moved into unit - Moved in 1980 to 1989 (%) - Hispanic or Latino
Year householder moved into unit - Moved in 1980 to 1989 (%) - American Indian and Alaska Native
Year householder moved into unit - Moved in 1980 to 1989 (%) - Multirace
Year householder moved into unit - Moved in 1980 to 1989 (%) - Other Race
Year householder moved into unit - Moved in 1970 to 1979 (%)
Year householder moved into unit - Moved in 1970 to 1979 (%) - White
Year householder moved into unit - Moved in 1970 to 1979 (%) - Black or African American
Year householder moved into unit - Moved in 1970 to 1979 (%) - Asian
Year householder moved into unit - Moved in 1970 to 1979 (%) - Hispanic or Latino
Year householder moved into unit - Moved in 1970 to 1979 (%) - American Indian and Alaska Native
Year householder moved into unit - Moved in 1970 to 1979 (%) - Multirace
Year householder moved into unit - Moved in 1970 to 1979 (%) - Other Race
Year householder moved into unit - Moved in 1969 or earlier (%)
Year householder moved into unit - Moved in 1969 or earlier (%) - White
Year householder moved into unit - Moved in 1969 or earlier (%) - Black or African American
Year householder moved into unit - Moved in 1969 or earlier (%) - Asian
Year householder moved into unit - Moved in 1969 or earlier (%) - Hispanic or Latino
Year householder moved into unit - Moved in 1969 or earlier (%) - American Indian and Alaska Native
Year householder moved into unit - Moved in 1969 or earlier (%) - Multirace
Year householder moved into unit - Moved in 1969 or earlier (%) - Other Race
Housing units lacking complete plumbing facilities (%)
Housing units lacking complete kitchen facilities (%)
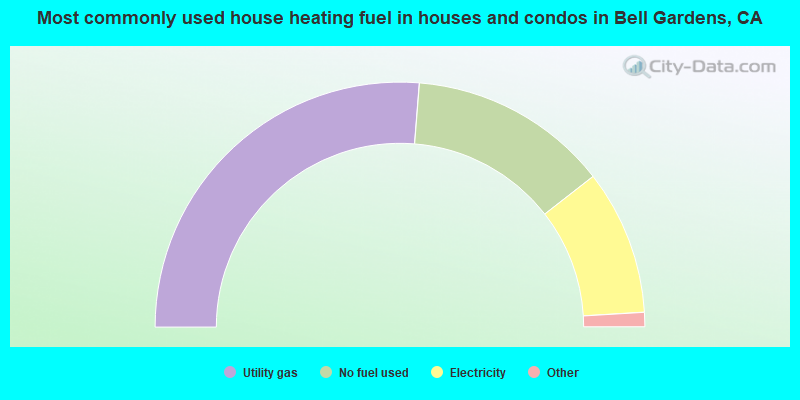
House heating fuel used in houses and condos - Utility gas (%)
House heating fuel used in houses and condos - Bottled, tank, or LP gas (%)
House heating fuel used in houses and condos - Electricity (%)
House heating fuel used in houses and condos - Fuel oil, kerosene, etc. (%)
House heating fuel used in houses and condos - Coal or coke (%)
House heating fuel used in houses and condos - Wood (%)
House heating fuel used in houses and condos - Solar energy (%)
House heating fuel used in houses and condos - Other fuel (%)
House heating fuel used in houses and condos - No fuel used (%)
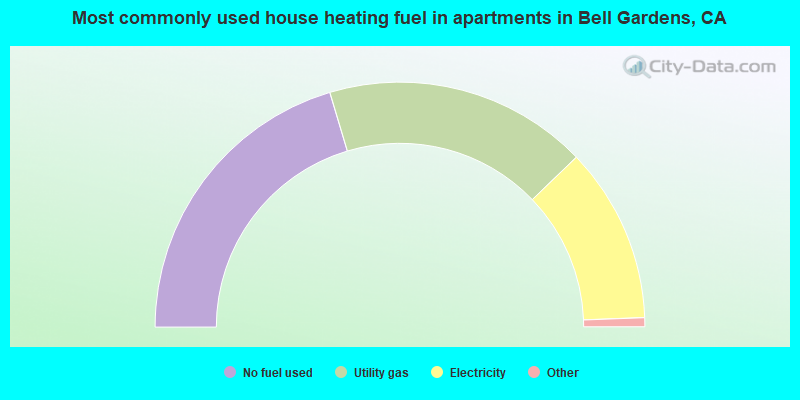
House heating fuel used in apartments - Utility gas (%)
House heating fuel used in apartments - Bottled, tank, or LP gas (%)
House heating fuel used in apartments - Electricity (%)
House heating fuel used in apartments - Fuel oil, kerosene, etc. (%)
House heating fuel used in apartments - Coal or coke (%)
House heating fuel used in apartments - Wood (%)
House heating fuel used in apartments - Solar energy (%)
House heating fuel used in apartments - Other fuel (%)
House heating fuel used in apartments - No fuel used (%)
Median year house/condo built: 1956Median year apartment built: 1961Household type by relationship:
Households: 38,411
Male householders: 4,225 (470 living alone ), Female householders: 5,091 (502 living alone )3,956 spouses (3,901 opposite-sex spouses ), 1,484 unmarried partners , (1,478 opposite-sex unmarried partners ), 15,232 children (14,852 natural , 61 adopted , 317 stepchildren ), 2,337 grandchildren , 1,220 brothers or sisters , 1,513 parents , 141 foster children , 1,802 other relatives , 912 non-relatives In group quarters: 494
Size of family households: 1,339 2-persons , 1,776 3-persons , 1,771 4-persons , 1,716 5-persons , 787 6-persons , 617 7-or-more-persons .
Size of nonfamily households: 1,044 1-person , 361 2-persons , 47 3-persons , 27 5-persons , 4 6-persons .
3,735 married couples with children. single-parent households (1,062 men , 3,222 women ).
9.4% of residents of Bell Gardens speak English at home. of residents speak Spanish at home (50% speak English very well , 19% speak English well , 20% speak English not well , 10% don't speak English at all ).of residents speak other Indo-European language at home (96% speak English very well , 4% speak English not well ).of residents speak Asian or Pacific Island language at home (51% speak English very well , 5% speak English well , 44% speak English not well ).of residents speak other language at home (50% speak English very well , 50% don't speak English at all ).
Foreign born population: 15,744 (41.0%)of them are naturalized citizens )
Median number of rooms in houses and condos:
Median number of rooms in apartments
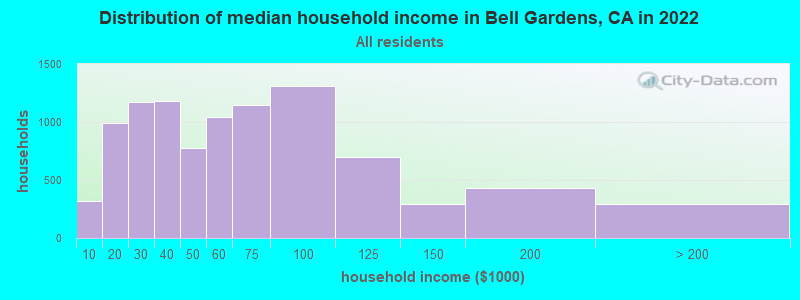
Bell Gardens, CA household income distribution 320 Less than $10,000988 $10,000 to $19,9991,169 $20,000 to $29,9991,185 $30,000 to $39,999779 $40,000 to $49,9991,043 $50,000 to $59,9991,150 $60,000 to $74,9991,313 $75,000 to $99,999697 $100,000 to $124,999294 $125,000 to $149,999435 $150,000 to $199,999289 $200,000 or more
Home value of owner - occupied houses in 2022 in Bell Gardens, CA 28 Less than $10,00012 $10,000 to $14,99920 $15,000 to $19,99970 $20,000 to $24,9996 $35,000 to $39,9995 $40,000 to $49,99912 $50,000 to $59,99934 $60,000 to $69,99911 $90,000 to $99,99974 $100,000 to $124,9999 $175,000 to $199,99946 $200,000 to $249,9996 $250,000 to $299,99973 $300,000 to $399,999365 $400,000 to $499,999516 $500,000 to $749,999243 $750,000 to $999,99930 $1,000,000 to $1,499,9998 $2,000,000 or moreRent paid by renters in 2022 in Bell Gardens, CA 24 Less than $10028 $200 to $249157 $250 to $29919 $300 to $34934 $350 to $39930 $450 to $49931 $500 to $54942 $550 to $59921 $600 to $64950 $650 to $699194 $700 to $74962 $750 to $799205 $800 to $899341 $900 to $9991,427 $1,000 to $1,2491,670 $1,250 to $1,4992,436 $1,500 to $1,999584 $2,000 to $2,499350 $2,500 to $2,99991 No cash rent
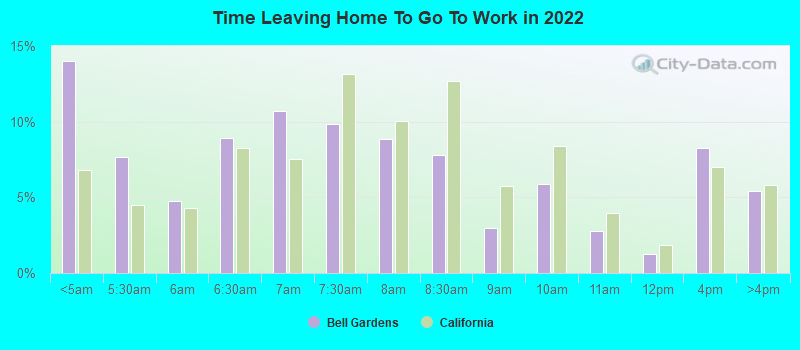
Percentage of workers working in this county: 94.2%Number of people working at home: 1,072 (6.5% of all workers )
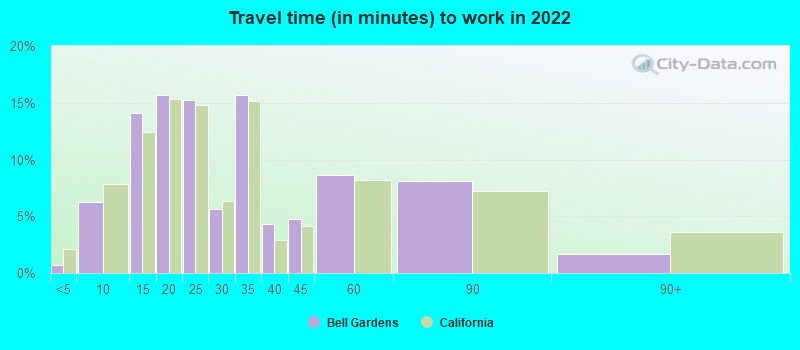
Travel time to work (commute)
Less than 5 minutes: 1175 to 9 minutes: 57110 to 14 minutes: 1,11715 to 19 minutes: 1,76720 to 24 minutes: 3,22225 to 29 minutes: 54430 to 34 minutes: 4,33235 to 39 minutes: 20740 to 44 minutes: 47245 to 59 minutes: 1,19560 to 89 minutes: 1,25290 or more minutes: 234
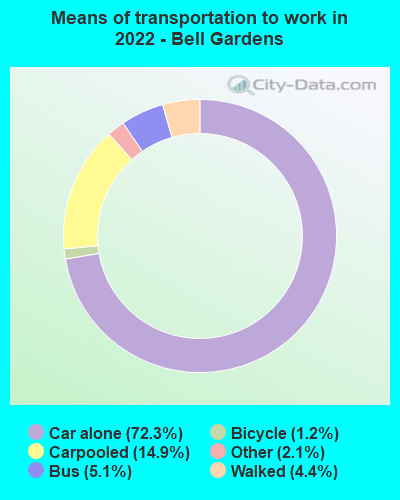
Means of transportation to work:
Drove a car alone: 5,769 (62.4%)Carpooled: 1,319 (14.3%)Bus : 373 (4.0%)Long-distance train or commuter rail : 1 (0.0%)Taxi: 182 (2.0%)Bicycle: 97 (1.0%)Walked: 374 (4.0%)Worked at home: 1,072 (11.6%)
Unemployment by race in 2022
Unemployment rate for White non-Hispanic residents 20.6% MalesUnemployment rate for Black residents 28.9% Males17.4% FemalesUnemployment rate for American Indian and Alaska Native residents 15.1% FemalesUnemployment rate for Asian residents 31.3% FemalesUnemployment rate for other race residents 7.8% Males5.2% FemalesUnemployment rate for two or more race residents 2.8% Males1.3% FemalesUnemployment rate for Hispanic or Latino residents 4.9% Males3.8% Females
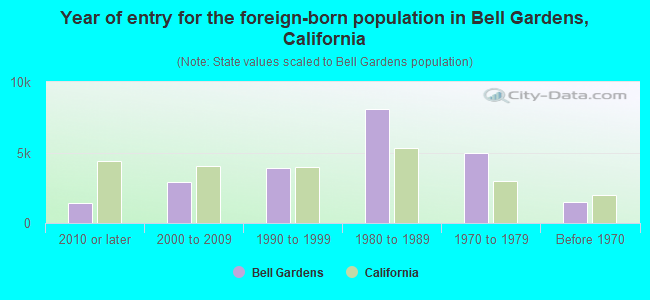
Year of entry for the foreign-born population in Bell Gardens, California
1,436 2010 or later 2,915 2000 to 2009 3,917 1990 to 1999 8,052 1980 to 1989 4,970 1970 to 1979 1,466 Before 1970
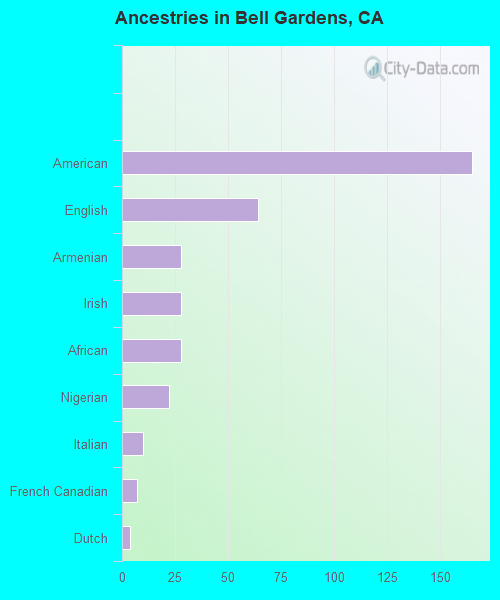
First ancestries reported:
American: 165 (0.5%)
English: 64 (0.2%)
Armenian: 28 (0.09%)
Irish: 28 (0.09%)
African: 28 (0.09%)
Nigerian: 22 (0.07%)
Italian: 10 (0.03%)
French Canadian: 7 (0.02%)
Dutch: 4 (0.01%) Most common places of birth for foreign-born residents (%): Mexico Bell Gardens:
78.7% (12,394)California:
37.2% (3,881,193)
El Salvador Bell Gardens:
9.7% (1,533)California:
4.2% (440,287)
Guatemala Bell Gardens:
4.6% (720)California:
2.8% (290,436)
Nicaragua Bell Gardens:
2.3% (368)California:
0.6% (58,161)
Place of birth for U.S.-born residents:
This state: 21,840Other state: 494Northeast: 69Midwest: 45South: 291West: 88 97.0% of Bell Gardens residents lived in the same house 1 years ago.
Out of people who lived in different houses, 48.7% lived in this county.
Out of people who lived in different counties, 100.0% lived in California.
Bell Gardens:
97.0%State average:
88.9%
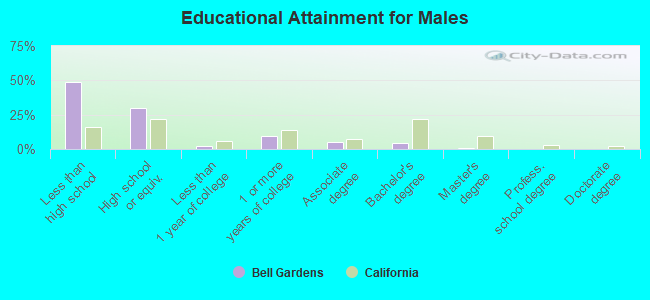
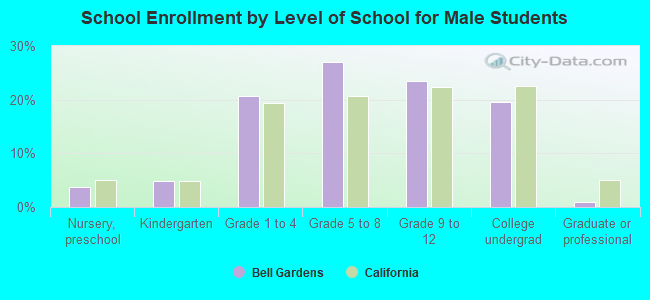
Education attainment for males 25 years and older:
No schooling: 1,037Nursery to 4th grade: 5535th and 6th grade: 1,4927th and 8th grade: 9979th grade: 49310th grade: 29411th grade: 38312th grade, no diploma: 393High school graduate (or equivalency): 3,448Less than 1 year of college: 246Some college more than 1 year, no degree: 1,061Associate degree: 553Bachelor's degree: 530Master's degree: 98Professional school degree: 16Doctorate degree: 10
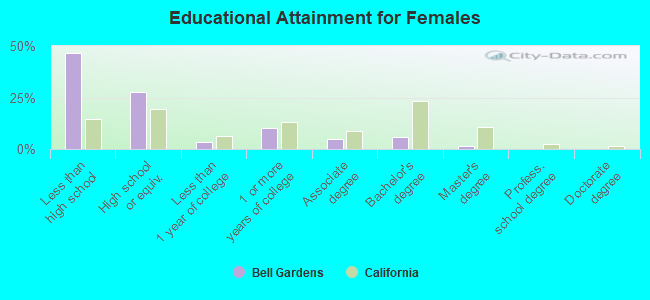
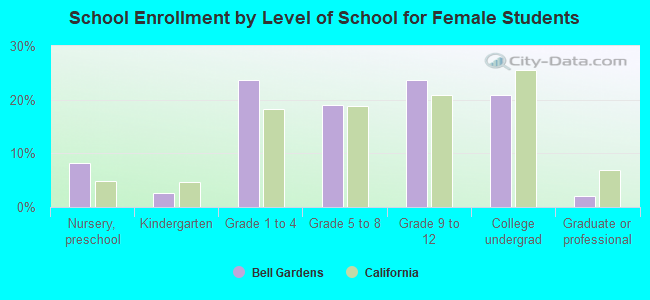
Education attainment for females 25 years and older:
No schooling: 901Nursery to 4th grade: 6735th and 6th grade: 1,4527th and 8th grade: 9779th grade: 43810th grade: 26111th grade: 41212th grade, no diploma: 288High school graduate (or equivalency): 3,231Less than 1 year of college: 411Some college more than 1 year, no degree: 1,179Associate degree: 583Bachelor's degree: 687Master's degree: 151Professional school degree: 4Doctorate degree: 0
Housing units in structures:
One, detached: 5,650One, attached: 1,603Two: 3713 or 4: 6295 to 9: 46110 to 19: 30720 to 49: 20950 or more: 236Mobile homes: 423Median worth of mobile homes: $30,939
Housing units lacking complete plumbing facilities in 2022: 0.4%Housing units lacking complete kitchen facilities in 2022: 2.3%House/condo owner moved in on average 22 years ago
Renter moved in on average 7 years ago
Private vs. public school enrollment:
Students in private schools in grades 1 to 8 (elementary and middle school): 64 Here:
1.2%California:
10.5%
Students in private schools in grades 9 to 12 (high school): 22 Students in private undergraduate colleges: 162 Here:
7.2%California:
15.9%