Bellflower, MO (Missouri) Houses and Residents
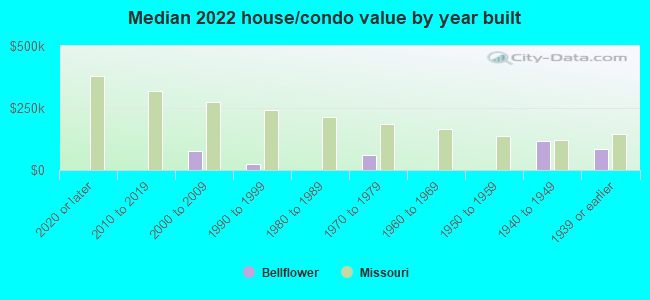
| Bellflower: | $73,992 |
| Missouri: | $221,200 |
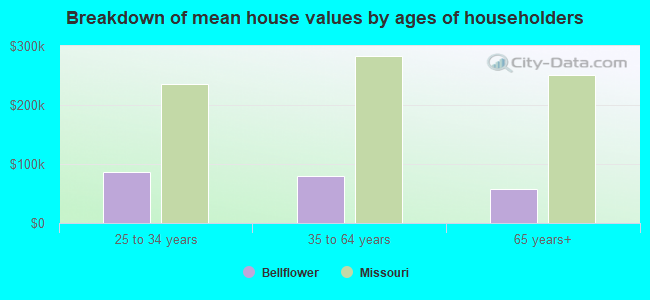
Mean price in 2022:
Detached houses: $79,475
Here: $79,475 State: $278,068 Mobile homes: $36,950
Here: $36,950 State: $95,912
Total population: 370 (Urban population: 0, Rural population: 422 (4 farm, 418 nonfarm))
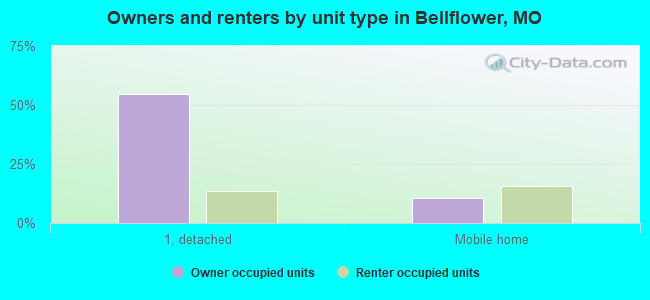
Houses: 151 (114 occupied: 75 owner occupied, 40 renter occupied)
| % of renters here: | 35% |
| State: | 32% |
Housing density: 275 houses/condos per square mile
Median price asked for vacant for-sale houses and condos in 2022: $51,076.
Median contract rent in 2022: $446 (lower quartile is $357, upper quartile is $589)
Median rent asked for vacant for-rent units in 2022: $991
Median gross rent in Bellflower, MO in 2022: $818
Housing units in Bellflower with a mortgage: 42 (1 second mortgage, 0 home equity loan, 0 both second mortgage and home equity loan)
Houses without a mortgage: 0
Median household income for houses/condos with a mortgage: $74,608
Median household income for apartments without a mortgage: $38,992
Median monthly housing costs: $725
Compare current foreclosures near Bellflower, MO:
| Photo | Address | Area | Beds / Baths | Price | Details |
|---|---|---|---|---|---|

|
#1
Highway V
Bellflower, MO 63333
|
- sq. feet
|
- baths - beds |
show details | |

|
#2
S Harper St
Montgomery City, MO 63361
|
894 sq. feet
|
1 baths 2 beds |
show details | |

|
#3
W 7th St
Montgomery City, MO 63361
|
- sq. feet
|
2 baths 3 beds |
show details | |

|
#4
Washington St
Hawk Point, MO 63349
|
660 sq. feet
|
- baths 2 beds |
show details | |

|
#5
Pebble Creek Dr
Warrenton, MO 63383
|
- sq. feet
|
- baths - beds |
show details | |

|
#6
Villas Dr
Warrenton, MO 63383
|
- sq. feet
|
- baths - beds |
show details | |

|
#7
Hawthorne Dr
Warrenton, MO 63383
|
- sq. feet
|
- baths - beds |
show details | |

|
#8
Country Creek Dr
Troy, MO 63379
|
- sq. feet
|
- baths - beds |
show details | |

|
#9
Paige Marie Dr
Warrenton, MO 63383
|
- sq. feet
|
- baths - beds |
show details | |

|
#10
Lilac Cir
Warrenton, MO 63383
|
- sq. feet
|
- baths - beds |
show details |
| Photo | Address | Area | Beds / Baths | Price | Details |
|---|---|---|---|---|---|

|
#11
Lotus Ct
Warrenton, MO 63383
|
- sq. feet
|
- baths - beds |
show details | |

|
#12
Donna Maria Dr Apt 101
Warrenton, MO 63383
|
- sq. feet
|
- baths - beds |
show details | |

|
#13
Villas Dr
Warrenton, MO 63383
|
- sq. feet
|
- baths - beds |
show details | |

|
#14
Red Schoolhouse Rd
Jonesburg, MO 63351
|
- sq. feet
|
- baths - beds |
show details | |

|
#15
E Booneslick Rd
Jonesburg, MO 63351
|
- sq. feet
|
- baths - beds |
show details | |

|
#16
Buechele Rd
New Florence, MO 63363
|
- sq. feet
|
- baths - beds |
show details | |

|
#17
N Walker St # D
Montgomery City, MO 63361
|
- sq. feet
|
- baths - beds |
show details | |

|
#18
N Walker St
Montgomery City, MO 63361
|
- sq. feet
|
- baths - beds |
show details | |

|
#19
Haney Farm Rd
Jonesburg, MO 63351
|
- sq. feet
|
- baths - beds |
show details | |

|
#20
Garland Woods Dr
Warrenton, MO 63383
|
- sq. feet
|
- baths - beds |
show details |
| Photo | Address | Area | Beds / Baths | Price | Details |
|---|---|---|---|---|---|

|
#21
Highway 161
Montgomery City, MO 63361
|
- sq. feet
|
- baths - beds |
show details | |

|
#22
E Water St
Wellsville, MO 63384
|
- sq. feet
|
- baths - beds |
show details | |

|
#23
Hickory Lick Valley Rd
Warrenton, MO 63383
|
- sq. feet
|
- baths - beds |
show details | |

|
#24
Ravenwood Dr
Montgomery City, MO 63361
|
- sq. feet
|
- baths - beds |
show details | |

|
#25
W Bates St
Wellsville, MO 63384
|
- sq. feet
|
- baths - beds |
show details | |

|
Check over 1 million property listings on Foreclosure.com!
|
browse all offers | |||

Latest news about housing in Bellflower, MO collected exclusively by city-data.com from local newspapers, TV, and radio stations


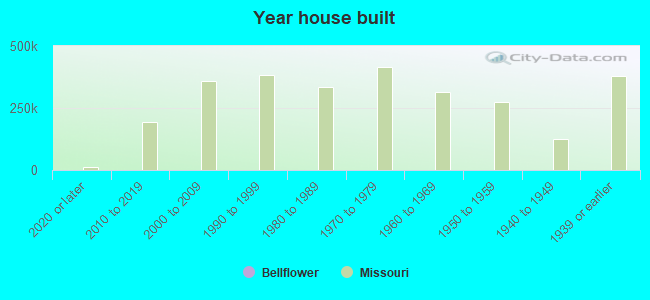
Median year apartment built: 1974
Household type by relationship:
Households: 306- Male householders: 75 (27 living alone), Female householders: 38 (10 living alone)
35 spouses (35 opposite-sex spouses), 21 unmarried partners, (18 opposite-sex unmarried partners), 109 children (79 natural, 2 adopted, 28 stepchildren), 11 grandchildren, 0 brothers or sisters, 6 parents, 0 foster children, 4 other relatives, 6 non-relatives
Size of family households: 27 2-persons, 11 3-persons, 7 4-persons, 4 5-persons, 3 6-persons, 10 7-or-more-persons.
Size of nonfamily households: 38 1-person, 9 2-persons, 3 3-persons.
56 married couples with children.
16 single-parent households (5 men, 11 women).
97.6% of residents of Bellflower speak English at home.
0.7% of residents speak Spanish at home (100% speak English very well).
1.0% of residents speak Asian or Pacific Island language at home (100% speak English not well).
Foreign born population: 5 (1.6%)
(60.0% of them are naturalized citizens)
| Here: | 5.3 |
| State: | 6.4 |
| Here: | 6.1 |
| State: | 4.4 |
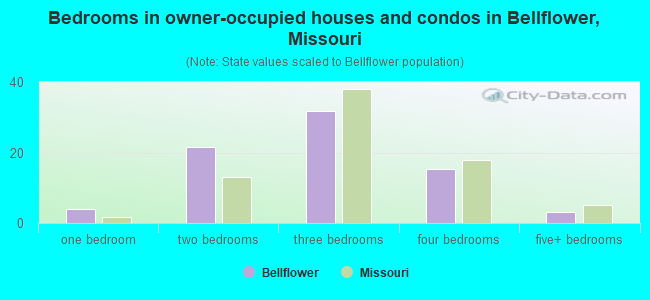
- Bedrooms in owner-occupied houses and condos in Bellflower, Missouri
- 0no bedroom
- 41 bedroom
- 222 bedrooms
- 323 bedrooms
- 154 bedrooms
- 35+ bedrooms
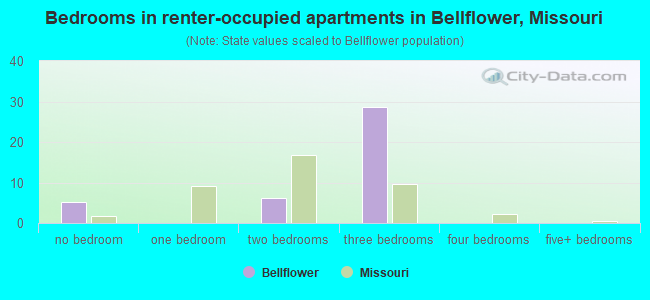
- Bedrooms in renter-occupied apartments in Bellflower, Missouri
- 5no bedroom
- 01 bedroom
- 62 bedrooms
- 293 bedrooms
- 04 bedrooms
- 05+ bedrooms
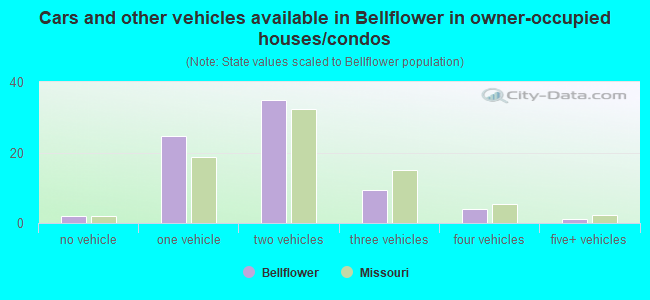
- Cars and other vehicles available in Bellflower in owner-occupied houses/condos
- 2no vehicle
- 251 vehicle
- 352 vehicles
- 93 vehicles
- 44 vehicles
- 15+ vehicles
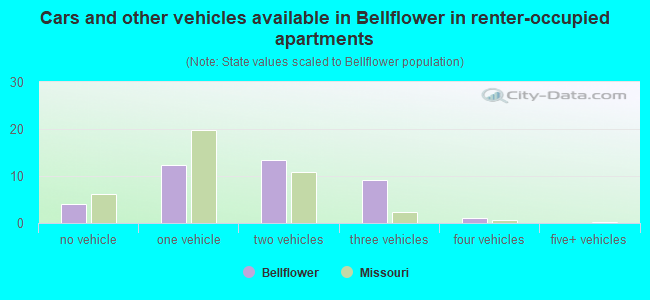
- Cars and other vehicles available in Bellflower in renter-occupied apartments
- 4no vehicle
- 121 vehicle
- 132 vehicles
- 93 vehicles
- 14 vehicles
- 05+ vehicles
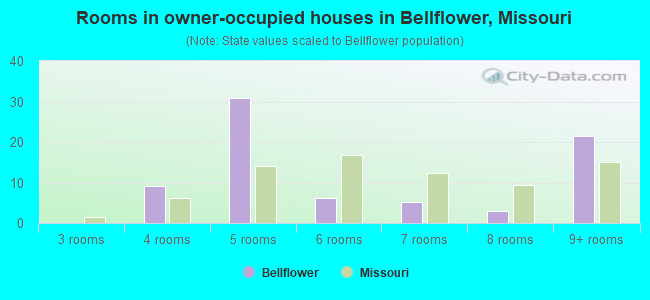
- Rooms in owner-occupied houses in Bellflower, Missouri
- 01 room
- 02 rooms
- 03 rooms
- 94 rooms
- 315 rooms
- 66 rooms
- 57 rooms
- 38 rooms
- 229+ rooms
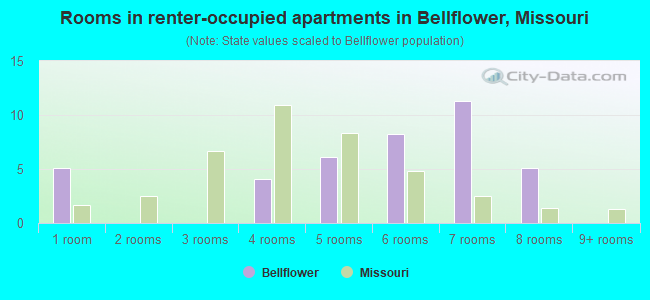
- Rooms in renter-occupied apartments in Bellflower, Missouri
- 51 room
- 02 rooms
- 03 rooms
- 44 rooms
- 65 rooms
- 86 rooms
- 117 rooms
- 58 rooms
- 09+ rooms
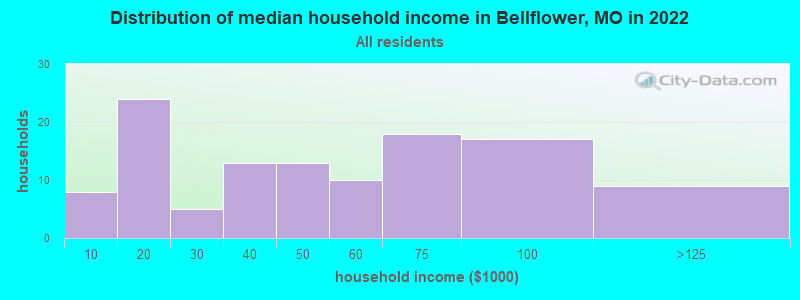
Bellflower, MO household income distribution

- 8Less than $10,000
- 24$10,000 to $19,999
- 5$20,000 to $29,999
- 13$30,000 to $39,999
- 13$40,000 to $49,999
- 10$50,000 to $59,999
- 18$60,000 to $74,999
- 17$75,000 to $99,999
- 9$100,000 to $124,999
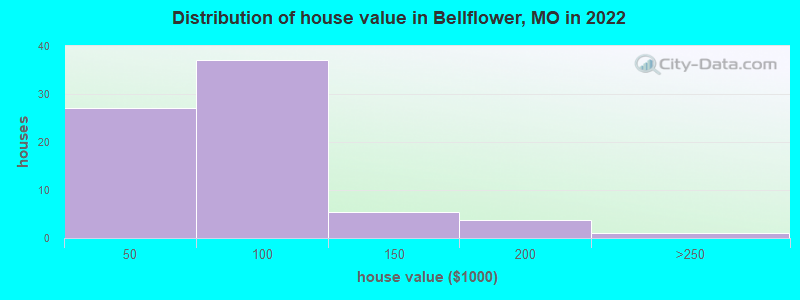
Home value of owner - occupied houses in 2022 in Bellflower, MO
-
- 3Less than $10,000
- 2$10,000 to $14,999
- 1$15,000 to $19,999
- 4$20,000 to $24,999
- 0$25,000 to $29,999
- 6$30,000 to $34,999
- 2$35,000 to $39,999
- 5$40,000 to $49,999
- 6$50,000 to $59,999
- 3$60,000 to $69,999
- 5$70,000 to $79,999
- 13$80,000 to $89,999
- 2$90,000 to $99,999
- 5$100,000 to $124,999
- 2$150,000 to $174,999
- 1$175,000 to $199,999
- 0$200,000 to $249,999
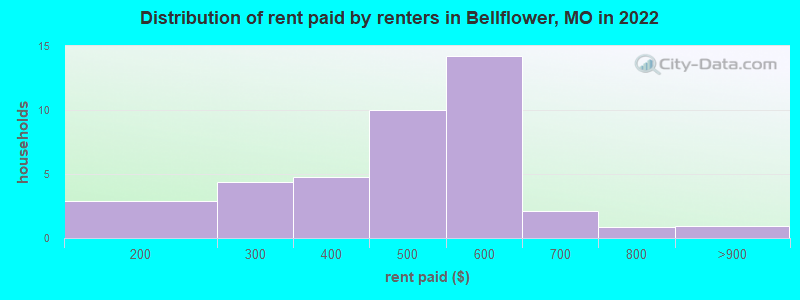
Rent paid by renters in 2022 in Bellflower, MO
-
- 2$100 to $149
- 4$250 to $299
- 4$350 to $399
- 9$400 to $449
- 7$500 to $549
- 6$550 to $599
- 2$600 to $649
- 0$700 to $749
- 0$800 to $899
Percentage of workers working in this county: 48.1%
Number of people working at home: 6 (7.4% of all workers)
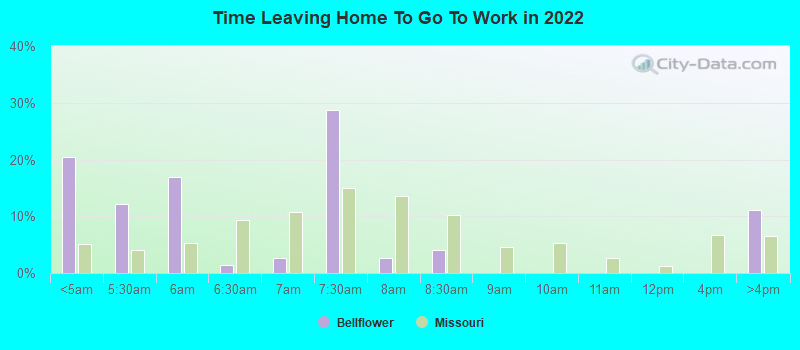
Travel time to work (commute)
- Less than 5 minutes: 8
- 5 to 9 minutes: 5
- 10 to 14 minutes: 0
- 15 to 19 minutes: 10
- 20 to 24 minutes: 1
- 25 to 29 minutes: 12
- 30 to 34 minutes: 0
- 35 to 39 minutes: 0
- 40 to 44 minutes: 16
- 45 to 59 minutes: 14
- 60 to 89 minutes: 1
- 90 or more minutes: 2
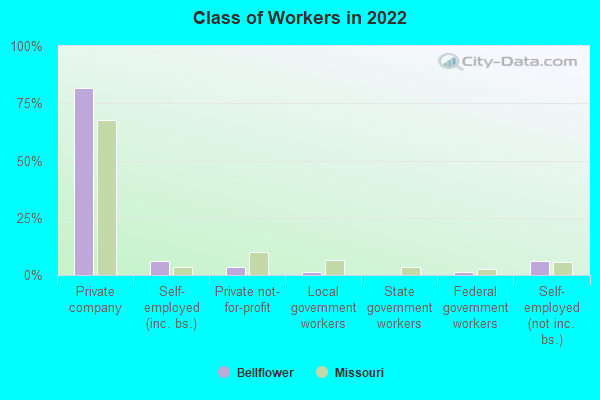
Means of transportation to work:
- Drove a car alone: 121 (75.2%)
- Carpooled: 32 (19.9%)
- Bus or trolley bus: 2 (1.2%)
- Walked: 4 (2.5%)
- Worked at home: 2 (1.2%)
- Unemployment by race in 2022
- Unemployment rate for White non-Hispanic residents
- 11.1%Males
- 17.7%Females
- Unemployment rate for other race residents
- 100.0%Males
- Unemployment rate for Hispanic or Latino residents
- 100.0%Males
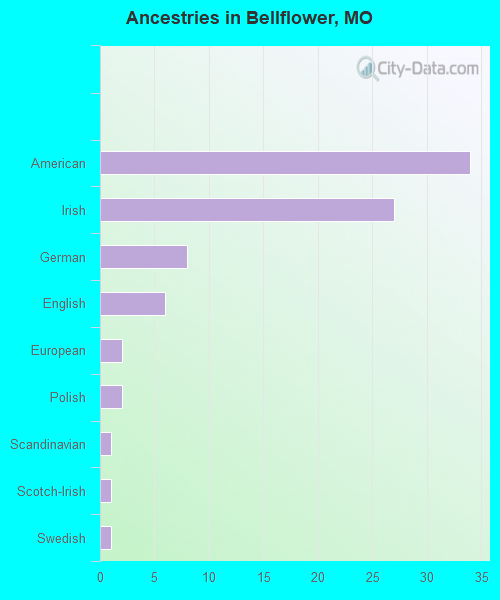
First ancestries reported:
- American: 34 (36.0%)
- Irish: 27 (28.6%)
- German: 8 (8.5%)
- English: 6 (6.3%)
- European: 2 (2.1%)
- Polish: 2 (2.1%)
- Scandinavian: 1 (1.1%)
- Scotch-Irish: 1 (1.1%)
- Swedish: 1 (1.1%)
Most common places of birth for foreign-born residents (%):
| Bellflower: | 60.0% (3) |
| Missouri: | 6.6% (17,002) |
| Bellflower: | 20.0% (1) |
| Missouri: | 14.9% (38,568) |
Place of birth for U.S.-born residents:
- This state: 233
- Other state: 62
- Northeast: 2
- Midwest: 16
- South: 40
- West: 3
94.1% of Bellflower residents lived in the same house 1 years ago.
Out of people who lived in different houses, 40.6% lived in this county.
Out of people who lived in different counties, 100.0% lived in Missouri.
| Bellflower: | 94.1% |
| State average: | 87.1% |
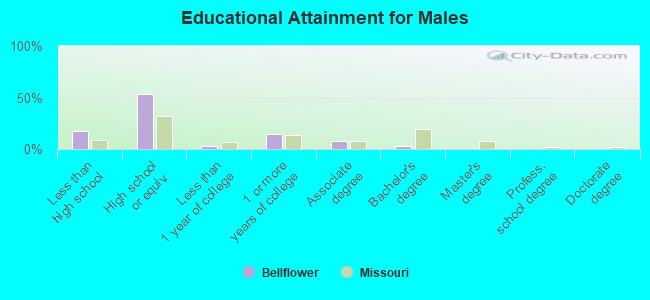
Education attainment for males 25 years and older:
- No schooling: 0
- Nursery to 4th grade: 0
- 5th and 6th grade: 0
- 7th and 8th grade: 1
- 9th grade: 7
- 10th grade: 4
- 11th grade: 7
- 12th grade, no diploma: 2
- High school graduate (or equivalency): 64
- Less than 1 year of college: 4
- Some college more than 1 year, no degree: 17
- Associate degree: 9
- Bachelor's degree: 4
- Master's degree: 0
- Professional school degree: 0
- Doctorate degree: 0
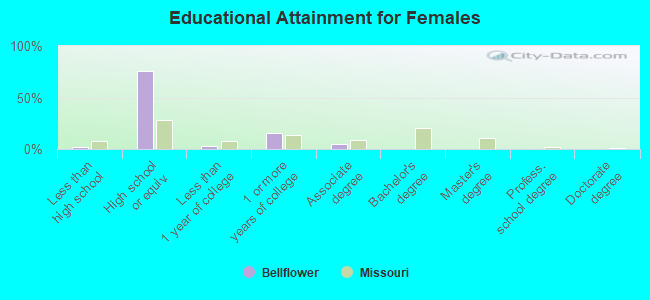
Education attainment for females 25 years and older:
- No schooling: 0
- Nursery to 4th grade: 0
- 5th and 6th grade: 0
- 7th and 8th grade: 1
- 9th grade: 0
- 10th grade: 0
- 11th grade: 0
- 12th grade, no diploma: 0
- High school graduate (or equivalency): 49
- Less than 1 year of college: 2
- Some college more than 1 year, no degree: 10
- Associate degree: 3
- Bachelor's degree: 0
- Master's degree: 0
- Professional school degree: 0
- Doctorate degree: 0


Housing units in structures:
- One, detached: 100
- Two: 5
- Mobile homes: 46
Median worth of mobile homes: $35,790
Housing units lacking complete kitchen facilities in 2022: 10.0%
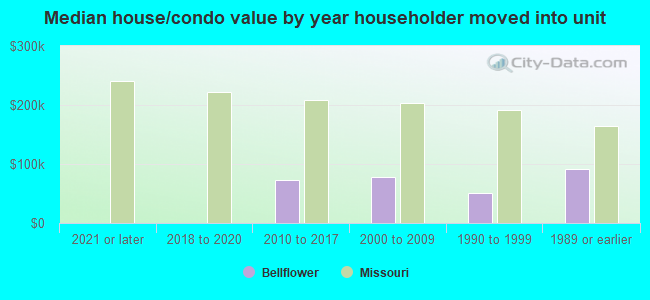
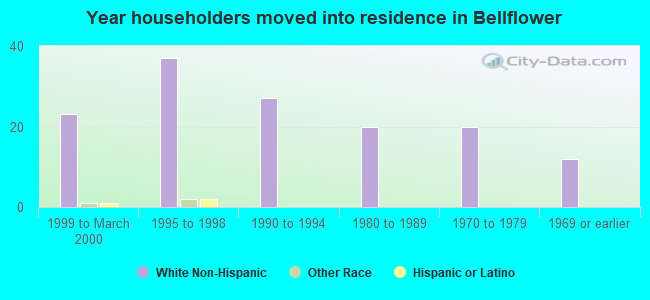
House/condo owner moved in on average 14 years ago
Renter moved in on average 5 years ago
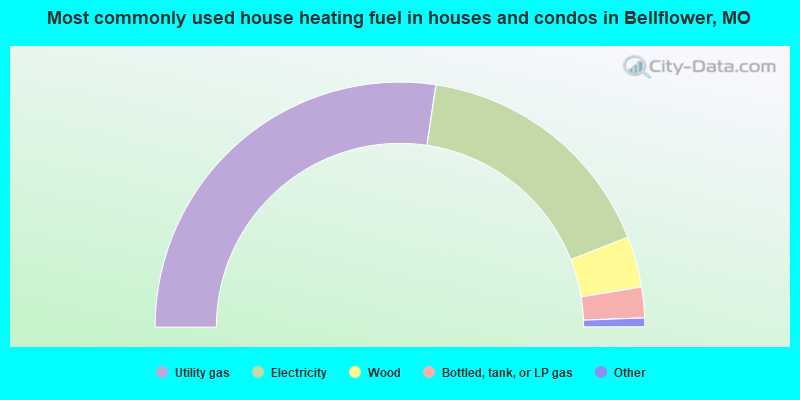
- 55.4%Utility gas
- 33.8%Electricity
- 6.8%Wood
- 4.1%Bottled, tank, or LP gas
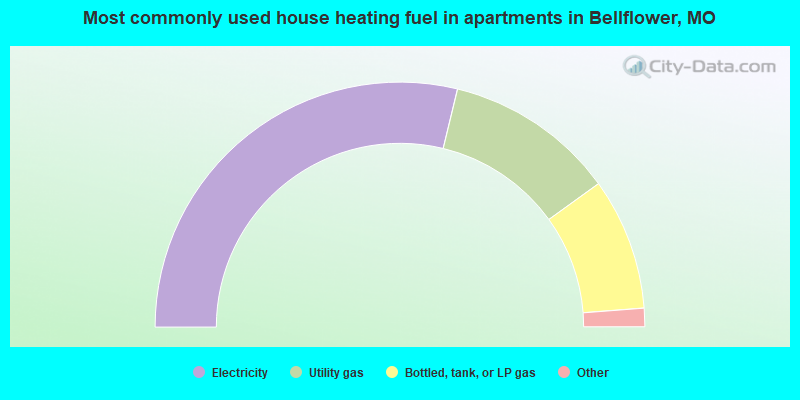
- 59.0%Electricity
- 23.1%Utility gas
- 17.9%Bottled, tank, or LP gas
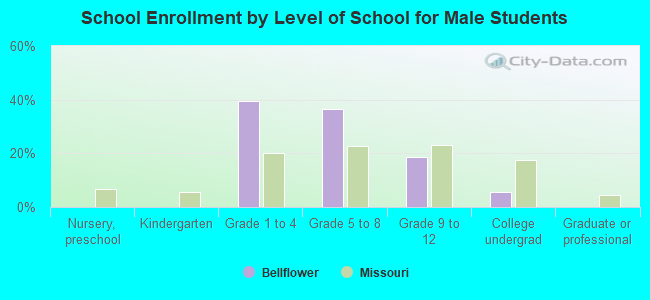
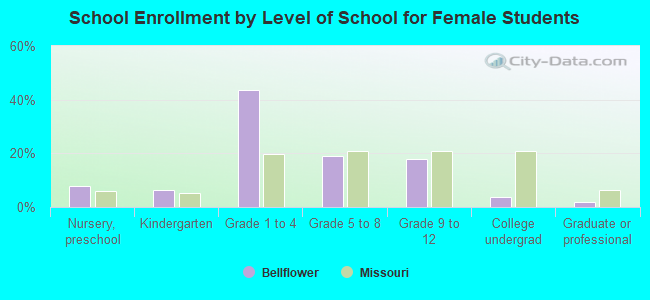
Private vs. public school enrollment:
| Here: | 5.4% |
| Missouri: | 15.4% |
| Here: | 0.0% |
| Missouri: | 13.9% |
| Here: | 0.0% |
| Missouri: | 22.6% |