Belmont, NC (North Carolina) Houses and Residents
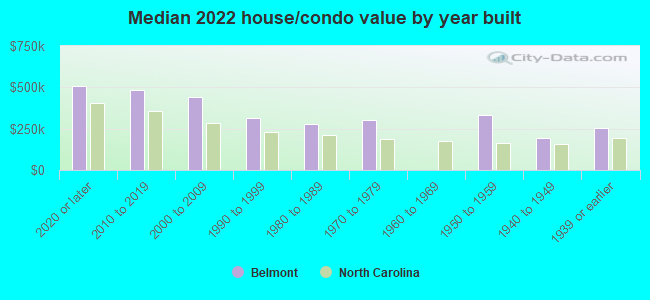
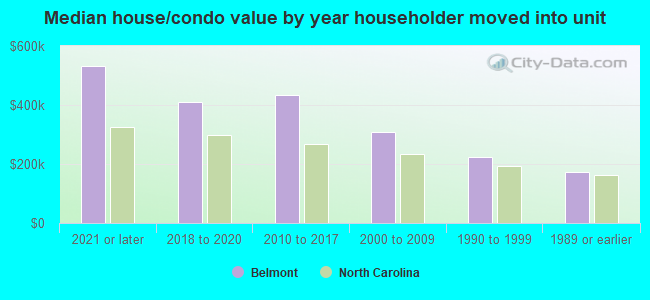
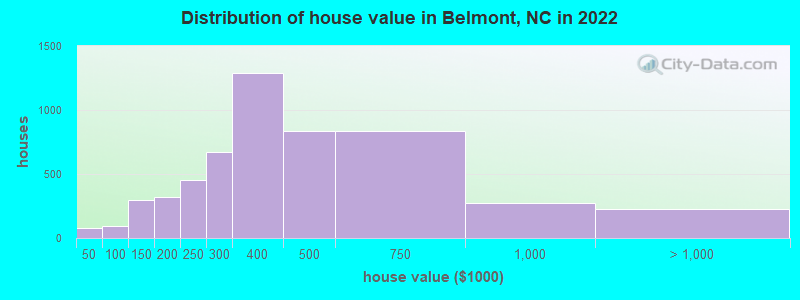
Estimated median house or condo value in 2022: $388,406 (it was $87,600 in 2000 )
Belmont:
$388,406North Carolina:
$280,600
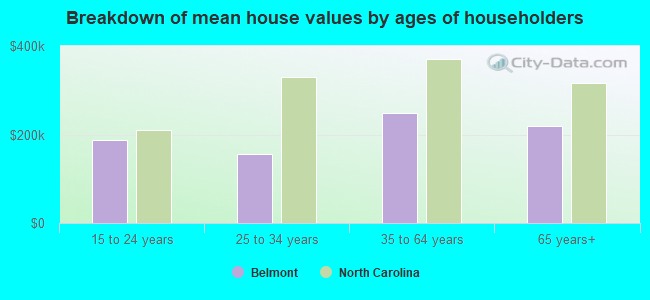
Lower value quartile - upper value quartile: $258,943 - $566,136Mean price in 2022: Detached houses: $364,679 Here:
$364,679State:
$375,326
Townhouses or other attached units: $343,455 Here:
$343,455State:
$317,935
In 5-or-more-unit structures: $204,368 Here:
$204,368State:
$329,290
Mobile homes: $255,829 Here:
$255,829State:
$124,933
Total population: 10,456 (Urban population: 8,510, Rural population: 203 (all nonfarm) )
Houses: 6,554 (6,261 occupied: 4,423 owner occupied, 1,977 renter occupied )
% of renters here:
31%State:
33%
Housing density: 811 houses/condos per square mile
Median price asked for vacant for-sale houses and condos in 2022: $1,102,875.
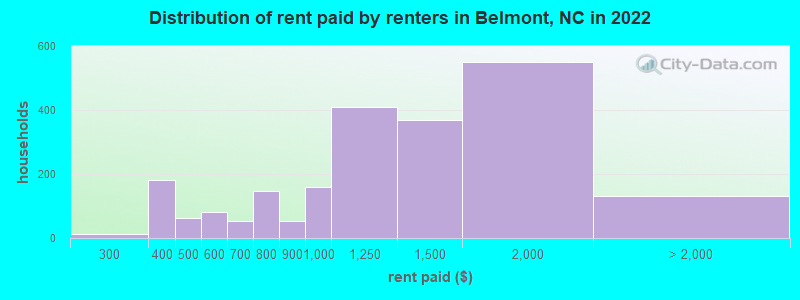
Median contract rent in 2022: $1,197 (lower quartile is $753, upper quartile is $1,597)
Median rent asked for vacant for-rent units in 2022: $774
Median gross rent in Belmont, NC in 2022: $1,255
Housing units in Belmont with a mortgage: 3,331 (453 second mortgage, 37 home equity loan, 417 both second mortgage and home equity loan )Houses without a mortgage: 0
Median household income for houses/condos with a mortgage: $128,754
Median household income for apartments without a mortgage: $61,009
Median monthly housing costs: $1,346
Data:
Median house or condo value ($)
Median house or condo value ($ change since 2000)
Median house or condo value ($) - White
Median house or condo value ($) - Black or African American
Median house or condo value ($) - Asian
Median house or condo value ($) - Hispanic or Latino
Median house or condo value ($) - American Indian and Alaska Native
Median house or condo value ($) - Multirace
Median house or condo value ($) - Other Race
Median price asked for mobile homes ($)
Household density (households per square mile)
Mean house or condo value by units in structure - 1, detached ($)
Mean house or condo value by units in structure - 1, attached ($)
Mean house or condo value by units in structure - 2 ($)
Mean house or condo value by units in structure by units in structure - 3 or 4 ($)
Mean house or condo value by units in structure - 5 or more ($)
Mean house or condo value by units in structure - Boat, RV, van, etc. ($)
Mean house or condo value by units in structure - Mobile home ($)
Median contract rent ($)
Median contract rent - Lower quartile ($)
Median contract rent - Upper quartile ($)
Median gross rent ($)
Urban houses (%)
Rural houses (%)
Houses occupied (%)
Houses occupied (% change since 2000)
Houses owner occupied (%)
Houses owner occupied (% change since 2000)
Houses renter occupied (%)
Houses renter occupied (% change since 2000)
Vacant housing units - For rent (%)
Vacant housing units - For rent (% change since 2000)
Vacant housing units - For sale only (%)
Vacant housing units - For sale only (% change since 2000)
Vacant housing units - Rented or sold, not occupied (%)
Vacant housing units - Rented or sold, not occupied (% change since 2000)
Vacant housing units - For seasonal, recreational, or occasional use (%)
Vacant housing units - For seasonal, recreational, or occasional use (% change since 2000)
Vacant housing units - For migrant workers (%)
Vacant housing units - For migrant workers (% change since 2000)
Vacant housing units - Other vacant (%)
Vacant housing units - Other vacant (% change since 2000)
Median monthly housing costs ($)
Median household income for houses/condos with a mortgage ($)
Median household income for houses/condos without a mortgage ($)
Median household income ($)
Median household income ($) - White
Median household income ($) - Black or African American
Median household income ($) - Asian
Median household income ($) - Hispanic or Latino
Median household income ($) - American Indian and Alaska Native
Median household income ($) - Multirace
Median household income ($) - Other Race
Mortgage status - with mortgage (%)
Mortgage status - with second mortgage (%)
Mortgage status - with home equity loan (%)
Mortgage status - with both second mortgage and home equity loan (%)
Mortgage status - without a mortgage (%)
Median year house/condo built
Median year apartment built
Household type by relationship - Male householder living alone (%)
Household type by relationship - Male householder not living alone (%)
Household type by relationship - Female householder living alone (%)
Household type by relationship - Female householder not living alone (%)
Household type by relationship - Opposite-Sex spouse (%)
Household type by relationship - Same-Sex spouse (%)
Household type by relationship - Opposite-Sex unmarried partner (%)
Household type by relationship - Same-Sex unmarried partner (%)
Household type by relationship - In group quarters (%)
Size of family households - 2-person household (%)
Size of family households - 3-person household (%)
Size of family households - 4-person household (%)
Size of family households - 5-person household (%)
Size of family households - 6-person household (%)
Size of family households - 7-or-more-person household (%)
Size of nonfamily households - 1-person household (%)
Size of nonfamily households - 2-person household (%)
Size of nonfamily households - 3-person household (%)
Size of nonfamily households - 4-person household (%)
Size of nonfamily households - 5-person household (%)
Size of nonfamily households - 6-person household (%)
Size of nonfamily households - 7-or-moreperson household (%)
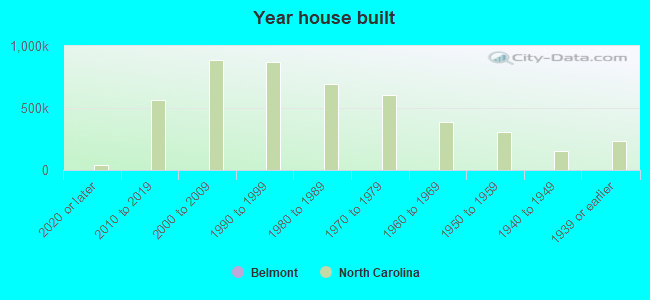
Year house built - Built 2010 or later (%)
Year house built - Built 2000 to 2009 (%)
Year house built - Built 1990 to 1999 (%)
Year house built - Built 1980 to 1989 (%)
Year house built - Built 1970 to 1979 (%)
Year house built - Built 1960 to 1969 (%)
Year house built - Built 1950 to 1959 (%)
Year house built - Built 1940 to 1949 (%)
Year house built - Built 1939 or earlier (%)
Median number of rooms in houses and condos
Median number of rooms in apartments
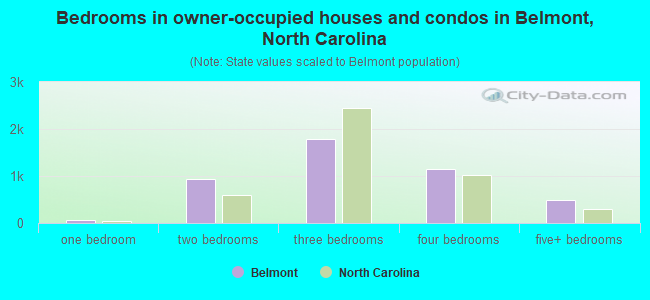
Median number of bedrooms in owner occupied houses
Mean number of bedrooms in owner occupied houses
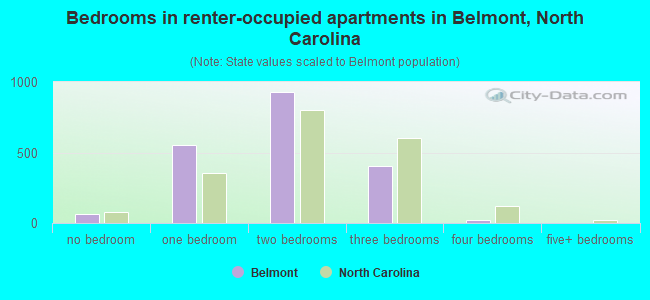
Median number of bedrooms in renter occupied houses
Mean number of bedrooms in renter occupied houses
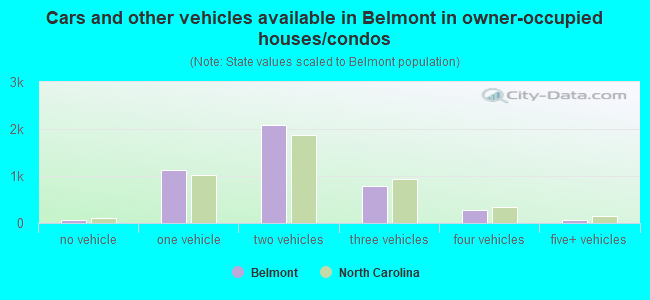
Median number of vehichles in owner occupied houses
Mean number of vehichles in owner occupied houses
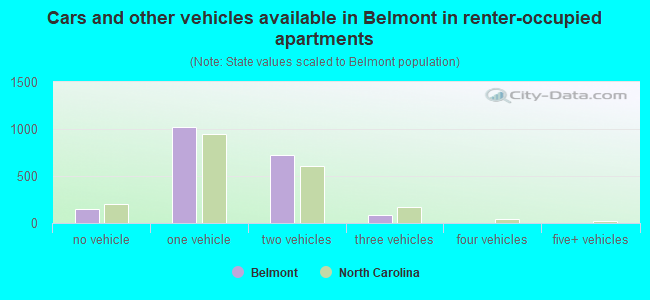
Median number of vehichles in renter occupied houses
Mean number of vehichles in renter occupied houses
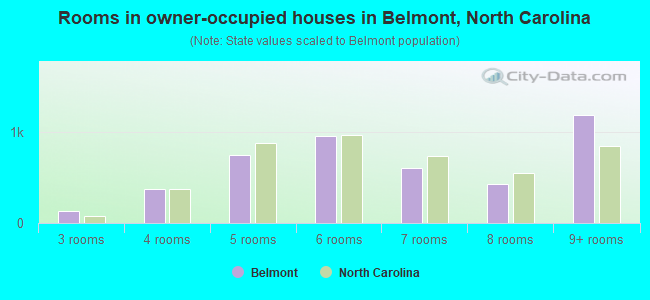
Rooms in owner-occupied houses - 1 room (%)
Rooms in owner-occupied houses - 2 rooms (%)
Rooms in owner-occupied houses - 3 rooms (%)
Rooms in owner-occupied houses - 4 rooms (%)
Rooms in owner-occupied houses - 5 rooms (%)
Rooms in owner-occupied houses - 6 rooms (%)
Rooms in owner-occupied houses - 7 rooms (%)
Rooms in owner-occupied houses - 8 rooms (%)
Rooms in owner-occupied houses - 9+ rooms (%)
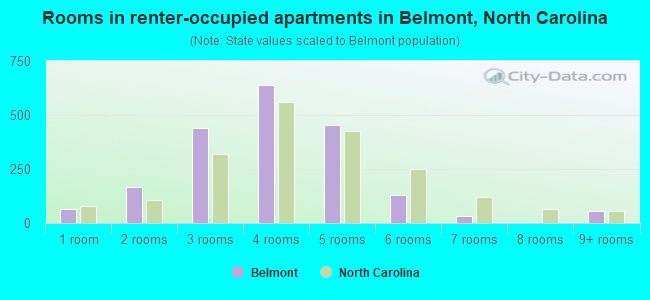
Rooms in renter-occupied houses - 1 room (%)
Rooms in renter-occupied houses - 2 rooms (%)
Rooms in renter-occupied houses - 3 rooms (%)
Rooms in renter-occupied houses - 4 rooms (%)
Rooms in renter-occupied houses - 5 rooms (%)
Rooms in renter-occupied houses - 6 rooms (%)
Rooms in renter-occupied houses - 7 rooms (%)
Rooms in renter-occupied houses - 8 rooms (%)
Rooms in renter-occupied houses - 9+ rooms (%)
Bedrooms in owner-occupied houses - no bedrooms (%)
Bedrooms in owner-occupied houses - 1 bedroom (%)
Bedrooms in owner-occupied houses - 2 bedrooms (%)
Bedrooms in owner-occupied houses - 3 bedrooms (%)
Bedrooms in owner-occupied houses - 4 bedrooms (%)
Bedrooms in owner-occupied houses - 5+ bedrooms (%)
Bedrooms in renter-occupied houses - no bedrooms (%)
Bedrooms in renter-occupied houses - 1 bedroom (%)
Bedrooms in renter-occupied houses - 2 bedrooms (%)
Bedrooms in renter-occupied houses - 3 bedrooms (%)
Bedrooms in renter-occupied houses - 4 bedrooms (%)
Bedrooms in renter-occupied houses - 5+ bedrooms (%)
Vehicles available in owner-occupied houses - no vehicle available (%)
Vehicles available in owner-occupied houses - 1 vehicle available(%)
Vehicles available in owner-occupied houses - 2 Vehicles available (%)
Vehicles available in owner-occupied houses - 3 Vehicles available (%)
Vehicles available in owner-occupied houses - 4 Vehicles available (%)
Vehicles available in owner-occupied houses - 5+ Vehicles available (%)
Vehicles available in renter-occupied houses - no vehicle available (%)
Vehicles available in renter-occupied houses - 1 vehicle available (%)
Vehicles available in renter-occupied houses - 2 Vehicles available (%)
Vehicles available in renter-occupied houses - 3 Vehicles available (%)
Vehicles available in renter-occupied houses - 4 Vehicles available (%)
Vehicles available in renter-occupied houses - 5+ Vehicles available (%)
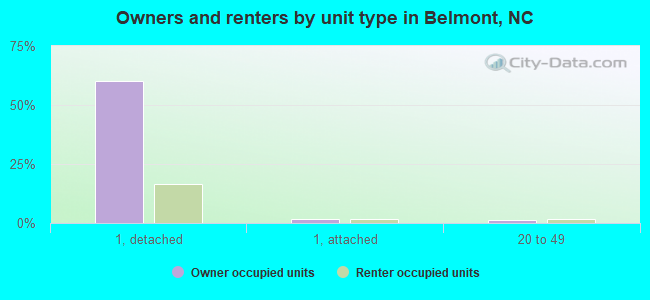
Housing units in structures - 1, detached (%)
Housing units in structures - 1, attached (%)
Housing units in structures - 2 (%)
Housing units in structures - 3 or 4 (%)
Housing units in structures - 5 to 9 (%)
Housing units in structures - 10 to 19 (%)
Housing units in structures - 20 to 49 (%)
Housing units in structures - 50 or more (%)
Housing units in structures - Mobile home (%)
Housing units in structures - Boat, RV, van, etc. (%)
Housing units in structures - Owners - 1, detached (%)
Housing units in structures - Owners - 1, attached (%)
Housing units in structures - Owners - 2 (%)
Housing units in structures - Owners - 3 or 4 (%)
Housing units in structures - Owners - 5 to 9 (%)
Housing units in structures - Owners - 10 to 19 (%)
Housing units in structures - Owners - 20 to 49 (%)
Housing units in structures - Owners - 50 or more (%)
Housing units in structures - Owners - Mobile home (%)
Housing units in structures - Owners - Boat, RV, van, etc. (%)
Housing units in structures - Renters - 1, detached (%)
Housing units in structures - Renters - 1, attached (%)
Housing units in structures - Renters - 2 (%)
Housing units in structures - Renters - 3 or 4 (%)
Housing units in structures - Renters - 5 to 9 (%)
Housing units in structures - Renters - 10 to 19 (%)
Housing units in structures - Renters - 20 to 49 (%)
Housing units in structures - Renters - 50 or more (%)
Housing units in structures - Renters - Mobile home (%)
Housing units in structures - Renters - Boat, RV, van, etc. (%)
House/condo owner moved in on average (years ago)
Renter moved in on average (years ago)
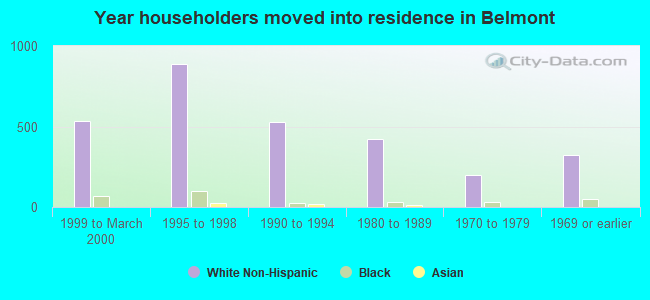
Year householder moved into unit - Moved in 1999 to March 2000 (%)
Year householder moved into unit - Moved in 1999 to March 2000 (%) - White
Year householder moved into unit - Moved in 1999 to March 2000 (%) - Black or African American
Year householder moved into unit - Moved in 1999 to March 2000 (%) - Asian
Year householder moved into unit - Moved in 1999 to March 2000 (%) - Hispanic or Latino
Year householder moved into unit - Moved in 1999 to March 2000 (%) - American Indian and Alaska Native
Year householder moved into unit - Moved in 1999 to March 2000 (%) - Multirace
Year householder moved into unit - Moved in 1999 to March 2000 (%) - Other Race
Year householder moved into unit - Moved in 1995 to 1998 (%)
Year householder moved into unit - Moved in 1995 to 1998 (%) - White
Year householder moved into unit - Moved in 1995 to 1998 (%) - Black or African American
Year householder moved into unit - Moved in 1995 to 1998 (%) - Asian
Year householder moved into unit - Moved in 1995 to 1998 (%) - Hispanic or Latino
Year householder moved into unit - Moved in 1995 to 1998 (%) - American Indian and Alaska Native
Year householder moved into unit - Moved in 1995 to 1998 (%) - Multirace
Year householder moved into unit - Moved in 1995 to 1998 (%) - Other Race
Year householder moved into unit - Moved in 1990 to 1994 (%)
Year householder moved into unit - Moved in 1990 to 1994 (%) - White
Year householder moved into unit - Moved in 1990 to 1994 (%) - Black or African American
Year householder moved into unit - Moved in 1990 to 1994 (%) - Asian
Year householder moved into unit - Moved in 1990 to 1994 (%) - Hispanic or Latino
Year householder moved into unit - Moved in 1990 to 1994 (%) - American Indian and Alaska Native
Year householder moved into unit - Moved in 1990 to 1994 (%) - Multirace
Year householder moved into unit - Moved in 1990 to 1994 (%) - Other Race
Year householder moved into unit - Moved in 1980 to 1989 (%)
Year householder moved into unit - Moved in 1980 to 1989 (%) - White
Year householder moved into unit - Moved in 1980 to 1989 (%) - Black or African American
Year householder moved into unit - Moved in 1980 to 1989 (%) - Asian
Year householder moved into unit - Moved in 1980 to 1989 (%) - Hispanic or Latino
Year householder moved into unit - Moved in 1980 to 1989 (%) - American Indian and Alaska Native
Year householder moved into unit - Moved in 1980 to 1989 (%) - Multirace
Year householder moved into unit - Moved in 1980 to 1989 (%) - Other Race
Year householder moved into unit - Moved in 1970 to 1979 (%)
Year householder moved into unit - Moved in 1970 to 1979 (%) - White
Year householder moved into unit - Moved in 1970 to 1979 (%) - Black or African American
Year householder moved into unit - Moved in 1970 to 1979 (%) - Asian
Year householder moved into unit - Moved in 1970 to 1979 (%) - Hispanic or Latino
Year householder moved into unit - Moved in 1970 to 1979 (%) - American Indian and Alaska Native
Year householder moved into unit - Moved in 1970 to 1979 (%) - Multirace
Year householder moved into unit - Moved in 1970 to 1979 (%) - Other Race
Year householder moved into unit - Moved in 1969 or earlier (%)
Year householder moved into unit - Moved in 1969 or earlier (%) - White
Year householder moved into unit - Moved in 1969 or earlier (%) - Black or African American
Year householder moved into unit - Moved in 1969 or earlier (%) - Asian
Year householder moved into unit - Moved in 1969 or earlier (%) - Hispanic or Latino
Year householder moved into unit - Moved in 1969 or earlier (%) - American Indian and Alaska Native
Year householder moved into unit - Moved in 1969 or earlier (%) - Multirace
Year householder moved into unit - Moved in 1969 or earlier (%) - Other Race
Housing units lacking complete plumbing facilities (%)
Housing units lacking complete kitchen facilities (%)
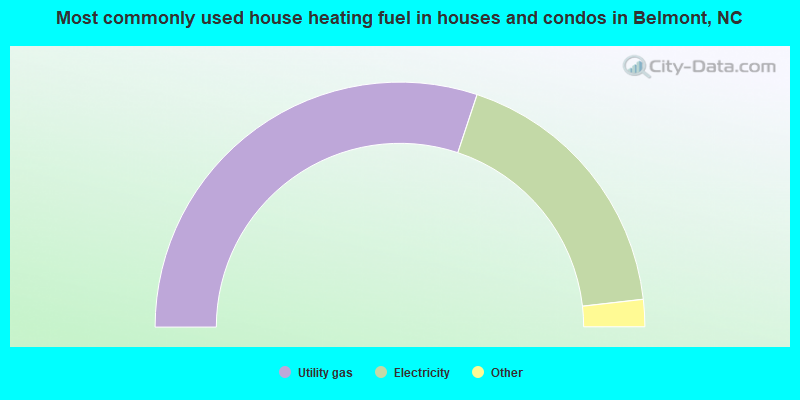
House heating fuel used in houses and condos - Utility gas (%)
House heating fuel used in houses and condos - Bottled, tank, or LP gas (%)
House heating fuel used in houses and condos - Electricity (%)
House heating fuel used in houses and condos - Fuel oil, kerosene, etc. (%)
House heating fuel used in houses and condos - Coal or coke (%)
House heating fuel used in houses and condos - Wood (%)
House heating fuel used in houses and condos - Solar energy (%)
House heating fuel used in houses and condos - Other fuel (%)
House heating fuel used in houses and condos - No fuel used (%)
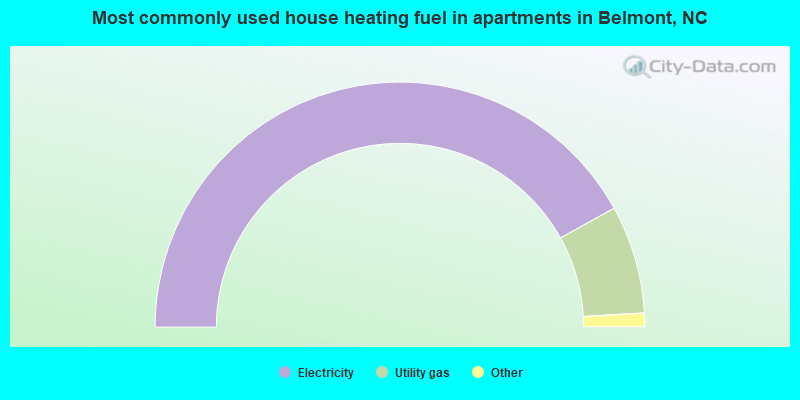
House heating fuel used in apartments - Utility gas (%)
House heating fuel used in apartments - Bottled, tank, or LP gas (%)
House heating fuel used in apartments - Electricity (%)
House heating fuel used in apartments - Fuel oil, kerosene, etc. (%)
House heating fuel used in apartments - Coal or coke (%)
House heating fuel used in apartments - Wood (%)
House heating fuel used in apartments - Solar energy (%)
House heating fuel used in apartments - Other fuel (%)
House heating fuel used in apartments - No fuel used (%)
Latest news about housing in Belmont, NC collected exclusively by city-data.com from local newspapers, TV, and radio stations
Median year house/condo built: 2001Median year apartment built: 2002Household type by relationship:
Households: 15,181
Male householders: 2,658 (629 living alone ), Female householders: 3,528 (1,357 living alone )2,587 spouses (2,568 opposite-sex spouses ), 552 unmarried partners , (552 opposite-sex unmarried partners ), 3,939 children (3,728 natural , 100 adopted , 110 stepchildren ), 368 grandchildren , 334 brothers or sisters , 86 parents , 0 foster children , 36 other relatives , 323 non-relatives In group quarters: 765
Size of family households: 1,697 2-persons , 994 3-persons , 719 4-persons , 294 5-persons , 46 6-persons , 14 7-or-more-persons .
Size of nonfamily households: 1,983 1-person , 573 2-persons , 11 6-persons .
2,157 married couples with children. single-parent households (141 men , 419 women ).
93.7% of residents of Belmont speak English at home. of residents speak Spanish at home (67% speak English very well , 29% speak English well , 4% speak English not well ).of residents speak other Indo-European language at home (78% speak English very well , 21% speak English well , 2% speak English not well ).of residents speak Asian or Pacific Island language at home (76% speak English very well , 12% speak English well , 13% speak English not well ).
Foreign born population: 848 (5.6%)of them are naturalized citizens )
Median number of rooms in houses and condos:
Median number of rooms in apartments
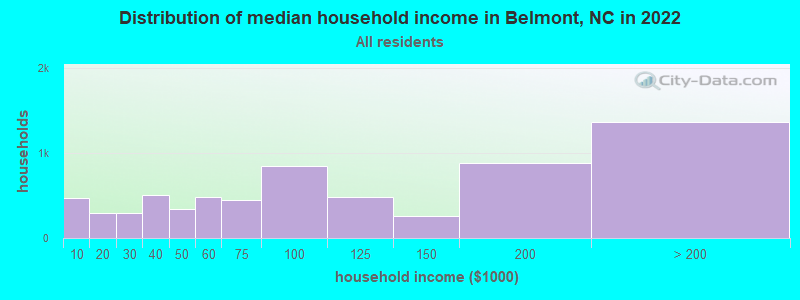
Belmont, NC household income distribution 472 Less than $10,000296 $10,000 to $19,999291 $20,000 to $29,999507 $30,000 to $39,999337 $40,000 to $49,999480 $50,000 to $59,999452 $60,000 to $74,999842 $75,000 to $99,999477 $100,000 to $124,999264 $125,000 to $149,999886 $150,000 to $199,9991,363 $200,000 or more
Home value of owner - occupied houses in 2022 in Belmont, NC 47 Less than $10,0007 $20,000 to $24,99917 $30,000 to $34,9994 $40,000 to $49,9999 $50,000 to $59,99919 $60,000 to $69,9997 $70,000 to $79,99939 $80,000 to $89,9999 $90,000 to $99,999240 $100,000 to $124,99957 $125,000 to $149,99993 $150,000 to $174,999225 $175,000 to $199,999452 $200,000 to $249,999674 $250,000 to $299,9991,285 $300,000 to $399,999834 $400,000 to $499,999835 $500,000 to $749,999276 $750,000 to $999,999162 $1,000,000 to $1,499,99966 $2,000,000 or moreRent paid by renters in 2022 in Belmont, NC 4 $150 to $19911 $200 to $24993 $300 to $34989 $350 to $39918 $400 to $44944 $450 to $49944 $500 to $54935 $550 to $59947 $600 to $6496 $650 to $69982 $700 to $74965 $750 to $79952 $800 to $899158 $900 to $999408 $1,000 to $1,249368 $1,250 to $1,499551 $1,500 to $1,99972 $2,000 to $2,49916 $2,500 to $2,99940 No cash rent
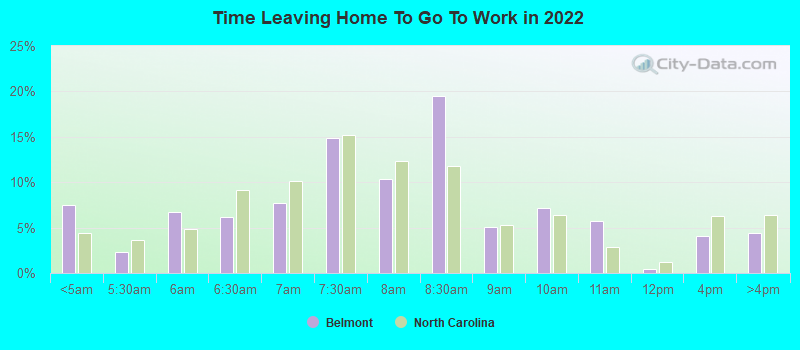
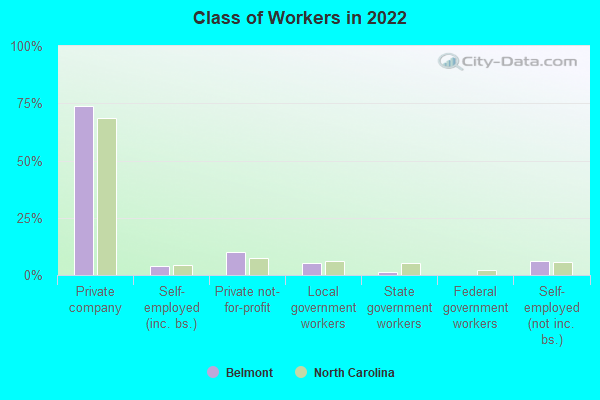
Percentage of workers working in this county: 58.8%Number of people working at home: 2,313 (28.6% of all workers )
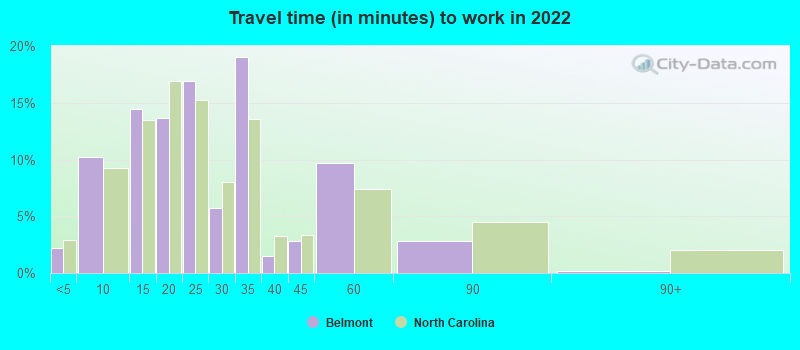
Travel time to work (commute)
Less than 5 minutes: 1285 to 9 minutes: 53510 to 14 minutes: 67315 to 19 minutes: 1,02220 to 24 minutes: 74325 to 29 minutes: 55530 to 34 minutes: 93235 to 39 minutes: 41540 to 44 minutes: 27645 to 59 minutes: 55760 to 89 minutes: 19190 or more minutes: 165
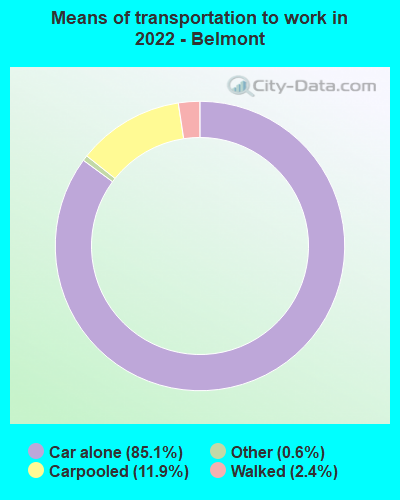
Means of transportation to work:
Drove a car alone: 5,143 (63.7%)Carpooled: 834 (10.3%)Taxi: 44 (0.5%)Walked: 103 (1.3%)Worked at home: 2,313 (28.7%)
Unemployment by race in 2022
Unemployment rate for White non-Hispanic residents 2.3% Males4.7% FemalesUnemployment rate for Black residents 2.9% Males5.3% Females
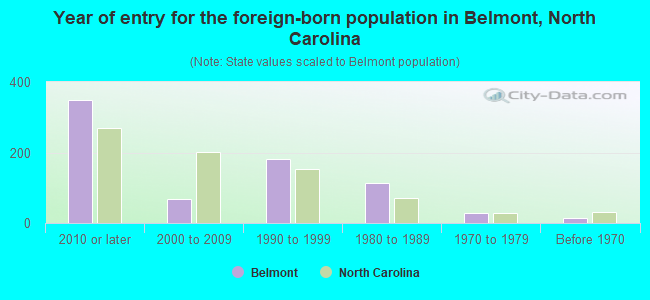
Year of entry for the foreign-born population in Belmont, North Carolina
349 2010 or later 69 2000 to 2009 182 1990 to 1999 114 1980 to 1989 28 1970 to 1979 14 Before 1970
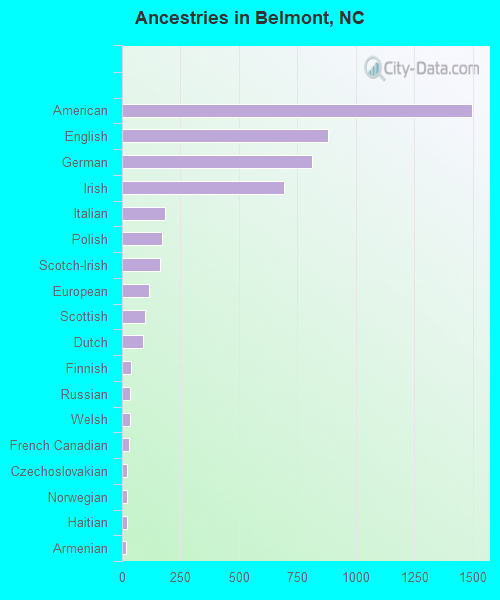
First ancestries reported:
American: 1,494 (22.4%)
English: 880 (13.2%)
German: 812 (12.2%)
Irish: 693 (10.4%)
Italian: 185 (2.8%)
Polish: 169 (2.5%)
Scotch-Irish: 161 (2.4%)
European: 115 (1.7%)
Scottish: 97 (1.5%)
Dutch: 88 (1.3%)
Finnish: 40 (0.6%)
Russian: 36 (0.5%)
Welsh: 34 (0.5%)
French Canadian: 28 (0.4%)
Czechoslovakian: 21 (0.3%)
Norwegian: 20 (0.3%)
Haitian: 20 (0.3%)
Armenian: 16 (0.2%)
Slovak: 13 (0.2%)
African: 13 (0.2%)
Danish: 11 (0.2%)
British: 9 (0.1%)
French: 8 (0.1%)
Greek: 7 (0.1%) Most common places of birth for foreign-born residents (%): Canada Belmont:
17.9% (139)North Carolina:
2.1% (18,105)
India Belmont:
12.5% (97)North Carolina:
9.3% (80,594)
China, excluding Hong Kong and Taiwan Belmont:
12.1% (94)North Carolina:
3.2% (27,477)
United Kingdom, excluding England and Scotland Belmont:
11.1% (86)North Carolina:
1.1% (9,831)
Bolivia Belmont:
6.2% (48)North Carolina:
0.1% (612)
Venezuela Belmont:
5.8% (45)North Carolina:
1.2% (9,986)
Philippines Belmont:
4.9% (38)North Carolina:
2.4% (20,695)
Zimbabwe Belmont:
4.0% (31)North Carolina:
0.2% (1,323)
Thailand Belmont:
3.2% (25)North Carolina:
0.7% (6,161)
Democratic Republic of Congo (Zaire) Belmont:
3.2% (25)North Carolina:
0.5% (4,046)
England Belmont:
3.1% (24)North Carolina:
1.2% (10,140)
Vietnam Belmont:
2.7% (21)North Carolina:
2.9% (24,965)
Korea Belmont:
2.7% (21)North Carolina:
1.8% (15,988)
South Africa Belmont:
2.2% (17)North Carolina:
0.5% (4,673)
Other Western Africa Belmont:
1.5% (12)North Carolina:
0.3% (2,644)
Place of birth for U.S.-born residents:
This state: 8,288Other state: 6,033Northeast: 1,601Midwest: 1,268South: 2,558West: 631 86.4% of Belmont residents lived in the same house 1 years ago.
Out of people who lived in different houses, 27.1% lived in this county.
Out of people who lived in different counties, 78.6% lived in North Carolina.
Belmont:
86.4%State average:
87.3%
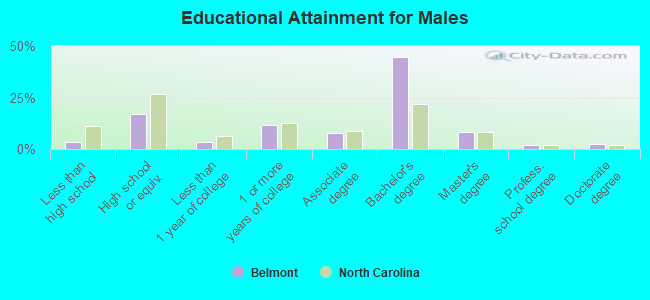
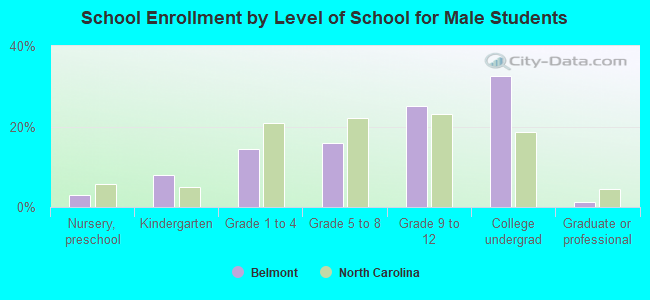
Education attainment for males 25 years and older:
No schooling: 0Nursery to 4th grade: 05th and 6th grade: 87th and 8th grade: 289th grade: 5410th grade: 5811th grade: 2412th grade, no diploma: 9High school graduate (or equivalency): 899Less than 1 year of college: 171Some college more than 1 year, no degree: 605Associate degree: 410Bachelor's degree: 2,345Master's degree: 421Professional school degree: 104Doctorate degree: 115
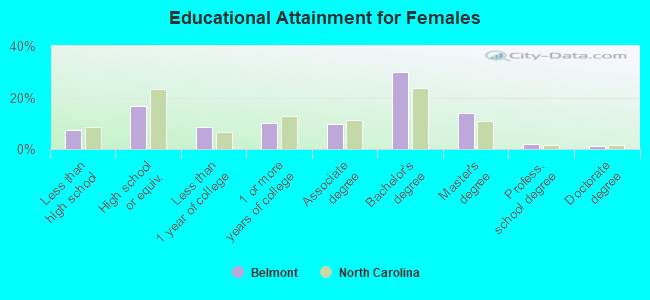
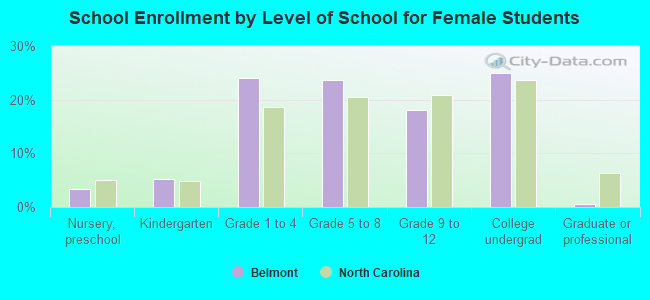
Education attainment for females 25 years and older:
No schooling: 71Nursery to 4th grade: 75th and 6th grade: 107th and 8th grade: 559th grade: 13610th grade: 8911th grade: 2412th grade, no diploma: 44High school graduate (or equivalency): 979Less than 1 year of college: 505Some college more than 1 year, no degree: 602Associate degree: 567Bachelor's degree: 1,756Master's degree: 816Professional school degree: 123Doctorate degree: 72
Housing units in structures:
One, detached: 4,631One, attached: 328Two: 833 or 4: 2365 to 9: 19910 to 19: 45120 to 49: 35950 or more: 59Mobile homes: 205Median worth of mobile homes: $15,133
Housing units lacking complete plumbing facilities in 2022: 0.4%Housing units lacking complete kitchen facilities in 2022: 0.5%House/condo owner moved in on average 5 years ago
Renter moved in on average 2 years ago
Private vs. public school enrollment:
Students in private schools in grades 1 to 8 (elementary and middle school): 287 Here:
20.5%North Carolina:
13.8%
Students in private schools in grades 9 to 12 (high school): 122 Here:
16.9%North Carolina:
11.9%
Students in private undergraduate colleges: 350 Here:
38.2%North Carolina:
19.3%