Benicia, CA (California) Houses and Residents
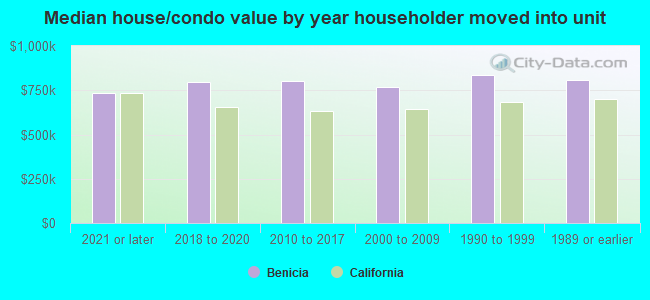
| Benicia: | $811,880 |
| California: | $715,900 |
Total population: 27,930 (Urban population: 26,566, Rural population: 401 (all nonfarm))
Houses: 11,491 (11,017 occupied: 7,824 owner occupied, 3,350 renter occupied)
| % of renters here: | 30% |
| State: | 44% |
Housing density: 891 houses/condos per square mile
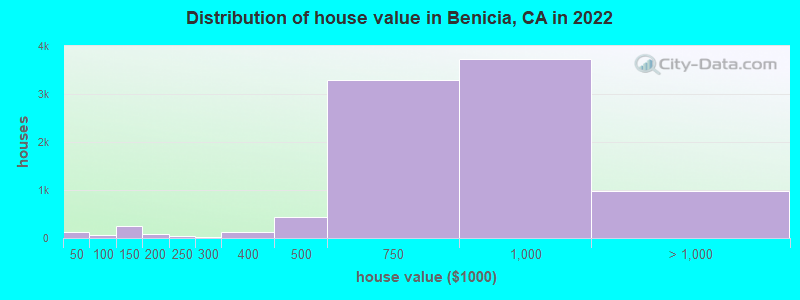
Median price asked for vacant for-sale houses and condos in 2022: $1,037,101.
Median contract rent in 2022: over $2,000 (lower quartile is $1,553, upper quartile is over $2,000)
Median rent asked for vacant for-rent units in 2022: $2,631
Median gross rent in Benicia, CA in 2022: over $2,000
Housing units in Benicia with a mortgage: 5,989 (897 second mortgage, 19 home equity loan, 823 both second mortgage and home equity loan)
Houses without a mortgage: 158
Median household income for houses/condos with a mortgage: $148,777
Median household income for apartments without a mortgage: $84,816
Median monthly housing costs: $2,389
Compare current foreclosures near Benicia, CA:
| Photo | Address | Area | Beds / Baths | Price | Details |
|---|---|---|---|---|---|

|
#1
Paul Ct
Benicia, CA 94510
|
2,099 sq. feet
|
3 baths 4 beds |
show details | |

|
#2
Steven Cir
Benicia, CA 94510
|
2,052 sq. feet
|
2 baths 3 beds |
show details | |

|
#3
Buena Vis
Benicia, CA 94510
|
1,640 sq. feet
|
2 baths 3 beds |
show details | |

|
#4
Jasper Ct
Benicia, CA 94510
|
2,763 sq. feet
|
3 baths 5 beds |
show details | |

|
#5
E J St
Benicia, CA 94510
|
790 sq. feet
|
1 baths 2 beds |
show details | |

|
#6
Capitol Dr
Benicia, CA 94510
|
2,714 sq. feet
|
3 baths 4 beds |
show details | |

|
#7
Southampton Rd Apt 18
Benicia, CA 94510
|
1,226 sq. feet
|
1 baths 3 beds |
show details | |

|
#8
El Bonito Way
Benicia, CA 94510
|
832 sq. feet
|
1 baths 2 beds |
show details | |

|
#9
Saint Francis Ct
Benicia, CA 94510
|
2,923 sq. feet
|
3 baths 4 beds |
show details | |

|
#10
Lori Dr Apt 44
Benicia, CA 94510
|
873 sq. feet
|
2 baths 2 beds |
show details |
| Photo | Address | Area | Beds / Baths | Price | Details |
|---|---|---|---|---|---|

|
#11
Lori Dr Apt 45
Benicia, CA 94510
|
873 sq. feet
|
2 baths 2 beds |
show details | |

|
#12
Cambridge Dr
Benicia, CA 94510
|
1,346 sq. feet
|
2 baths 2 beds |
show details | |

|
#13
Ofarrell Dr
Benicia, CA 94510
|
1,454 sq. feet
|
2 baths 3 beds |
show details | |

|
#14
Cambridge Dr Unit 57
Benicia, CA 94510
|
1,087 sq. feet
|
1 baths 2 beds |
show details | |

|
#15
Stuart Ct
Benicia, CA 94510
|
- sq. feet
|
- baths - beds |
show details | |

|
#16
Alta Loma # 1
Benicia, CA 94510
|
- sq. feet
|
- baths - beds |
show details | |

|
#17
Southampton Rd Ofc 91
Benicia, CA 94510
|
- sq. feet
|
- baths - beds |
show details | |

|
#18
Southampton Rd Apt 33
Benicia, CA 94510
|
- sq. feet
|
- baths - beds |
show details | |

|
#19
Military E
Benicia, CA 94510
|
- sq. feet
|
- baths - beds |
show details | |

|
#20
Riverview Ter Apt 228
Benicia, CA 94510
|
- sq. feet
|
- baths - beds |
show details |
| Photo | Address | Area | Beds / Baths | Price | Details |
|---|---|---|---|---|---|

|
#21
Southampton Rd Ste B170
Benicia, CA 94510
|
- sq. feet
|
- baths - beds |
show details | |

|
#22
Southampton Rd Apt 10
Benicia, CA 94510
|
- sq. feet
|
- baths - beds |
show details | |

|
#23
Warwick Dr Apt 1
Benicia, CA 94510
|
- sq. feet
|
- baths - beds |
show details | |

|
#24
E N St
Benicia, CA 94510
|
- sq. feet
|
- baths - beds |
show details | |

|
#25
Grove Cir
Benicia, CA 94510
|
- sq. feet
|
- baths - beds |
show details | |

|
#26
Hastings Ave
Vallejo, CA 94589
|
1,104 sq. feet
|
2 baths 3 beds |
$529,000
|
show details |

|
#27
2nd St
Richmond, CA 94801
|
887 sq. feet
|
1 baths 3 beds |
$364,000
|
show details |

|
#28
Limestone Dr
Vallejo, CA 94589
|
1,677 sq. feet
|
2 baths 4 beds |
$609,000
|
show details |

|
#29
E 12th St
Pittsburg, CA 94565
|
1,345 sq. feet
|
1 baths 2 beds |
$540,000
|
show details |

|
#30
El Portal Dr Apt D
San Pablo, CA 94806
|
1,058 sq. feet
|
2 baths 2 beds |
show details |
| Photo | Address | Area | Beds / Baths | Price | Details |
|---|---|---|---|---|---|

|
#31
Mohr Ln Apt C
Concord, CA 94518
|
870 sq. feet
|
1 baths 2 beds |
show details | |

|
#32
21st St
San Pablo, CA 94806
|
1,665 sq. feet
|
2 baths 3 beds |
show details | |

|
#33
Summer Ln
San Pablo, CA 94806
|
1,819 sq. feet
|
3 baths 3 beds |
show details | |

|
#34
Carpino Ave
Pittsburg, CA 94565
|
975 sq. feet
|
1 baths 3 beds |
show details | |

|
#35
Grande Cir Apt 23
Fairfield, CA 94533
|
1,080 sq. feet
|
2 baths 2 beds |
show details | |

|
#36
Hoover Ct
Concord, CA 94521
|
1,700 sq. feet
|
2 baths 5 beds |
show details | |

|
#37
Heide Ct
El Sobrante, CA 94803
|
4,151 sq. feet
|
3 baths 5 beds |
show details | |

|
#38
Dahlia St
Fairfield, CA 94533
|
1,403 sq. feet
|
2 baths 3 beds |
show details | |

|
#39
Taper Ave
Vallejo, CA 94589
|
1,618 sq. feet
|
2 baths 3 beds |
show details | |

|
#40
W Carolyn Dr
American Canyon, CA 94503
|
975 sq. feet
|
1 baths 3 beds |
show details |
| Photo | Address | Area | Beds / Baths | Price | Details |
|---|---|---|---|---|---|

|
#41
Lincoln Ave
Richmond, CA 94804
|
795 sq. feet
|
1 baths 2 beds |
show details | |

|
#42
Steffan St
Vallejo, CA 94591
|
1,965 sq. feet
|
2 baths 3 beds |
show details | |

|
#43
Grant St
Vallejo, CA 94590
|
929 sq. feet
|
2 baths 3 beds |
show details | |

|
#44
Holly View Ct
Martinez, CA 94553
|
1,655 sq. feet
|
2 baths 3 beds |
show details | |

|
#45
Leslie Ave
Martinez, CA 94553
|
1,006 sq. feet
|
1 baths 2 beds |
show details | |

|
#46
6th St
Vallejo, CA 94590
|
1,317 sq. feet
|
2 baths 3 beds |
show details | |

|
#47
Whyte Park Ave
Walnut Creek, CA 94595
|
2,389 sq. feet
|
2 baths 3 beds |
show details | |

|
#48
Daniels Ave
Vallejo, CA 94590
|
1,782 sq. feet
|
2 baths 4 beds |
show details | |

|
#49
Cassia Ct
Pittsburg, CA 94565
|
2,135 sq. feet
|
2 baths 4 beds |
show details | |

|
Check over 1 million property listings on Foreclosure.com!
|
browse all offers | |||

Latest news about housing in Benicia, CA collected exclusively by city-data.com from local newspapers, TV, and radio stations

 | Confused - Benicia or Pleasant Hill/Martinez home buyer (5 replies) |
| Relocating and Househunting (48 replies) |
| Tell me about Brentwood, CA (39 replies) |
| Housing for TOURO student-Vallejo (20 replies) |
| Young couple seeking to buy or rent a house in Bay Area (10 replies) |
| Benicia - an upcoming historic Bay Area town (23 replies) |
Median year apartment built: 1980
Household type by relationship:
Households: 26,905- Male householders: 5,085 (1,246 living alone), Female householders: 5,733 (2,088 living alone)
5,566 spouses (5,517 opposite-sex spouses), 659 unmarried partners, (611 opposite-sex unmarried partners), 7,843 children (7,282 natural, 123 adopted, 437 stepchildren), 574 grandchildren, 64 brothers or sisters, 528 parents, 0 foster children, 328 other relatives, 482 non-relatives
- In group quarters: 38
Size of family households: 3,156 2-persons, 1,717 3-persons, 1,333 4-persons, 601 5-persons, 164 6-persons, 38 7-or-more-persons.
Size of nonfamily households: 3,702 1-person, 522 2-persons, 33 3-persons.
3,799 married couples with children.
1,061 single-parent households (280 men, 781 women).
79.1% of residents of Benicia speak English at home.
8.3% of residents speak Spanish at home (72% speak English very well, 18% speak English well, 9% speak English not well).
3.3% of residents speak other Indo-European language at home (76% speak English very well, 20% speak English well, 3% speak English not well).
7.6% of residents speak Asian or Pacific Island language at home (64% speak English very well, 24% speak English well, 9% speak English not well, 2% don't speak English at all).
0.6% of residents speak other language at home (78% speak English very well, 15% speak English well, 6% speak English not well).
Foreign born population: 3,930 (14.6%)
(65.0% of them are naturalized citizens)
| Here: | 6.6 |
| State: | 6.0 |
| Here: | 4.4 |
| State: | 3.9 |
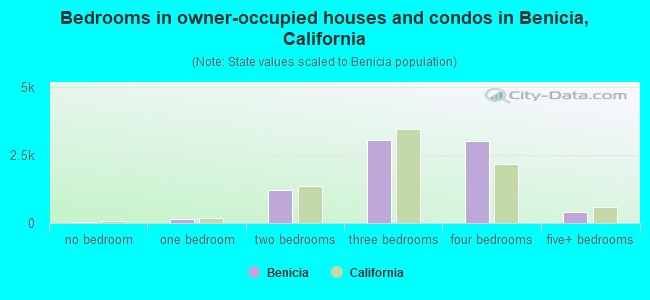
- Bedrooms in owner-occupied houses and condos in Benicia, California
- 41no bedroom
- 1361 bedroom
- 1,2002 bedrooms
- 3,0593 bedrooms
- 2,9964 bedrooms
- 3935+ bedrooms
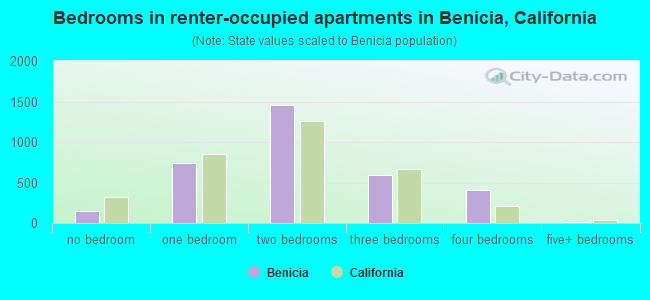
- Bedrooms in renter-occupied apartments in Benicia, California
- 150no bedroom
- 7381 bedroom
- 1,4512 bedrooms
- 5933 bedrooms
- 4074 bedrooms
- 115+ bedrooms
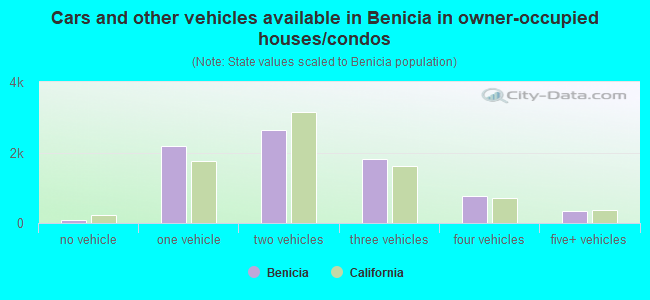
- Cars and other vehicles available in Benicia in owner-occupied houses/condos
- 90no vehicle
- 2,1751 vehicle
- 2,6392 vehicles
- 1,8093 vehicles
- 7594 vehicles
- 3535+ vehicles
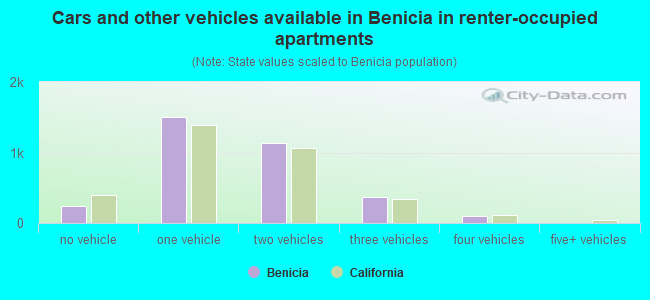
- Cars and other vehicles available in Benicia in renter-occupied apartments
- 238no vehicle
- 1,5061 vehicle
- 1,1382 vehicles
- 3753 vehicles
- 944 vehicles
- 05+ vehicles
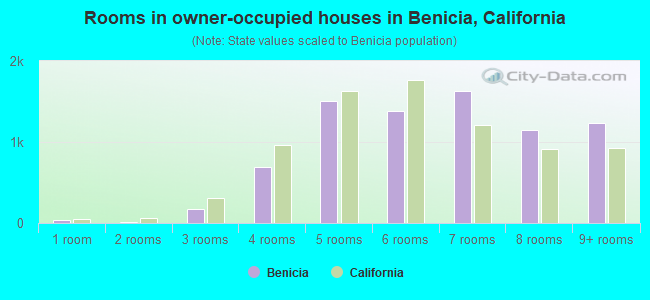
- Rooms in owner-occupied houses in Benicia, California
- 411 room
- 102 rooms
- 1793 rooms
- 6944 rooms
- 1,5065 rooms
- 1,3786 rooms
- 1,6327 rooms
- 1,1488 rooms
- 1,2369+ rooms
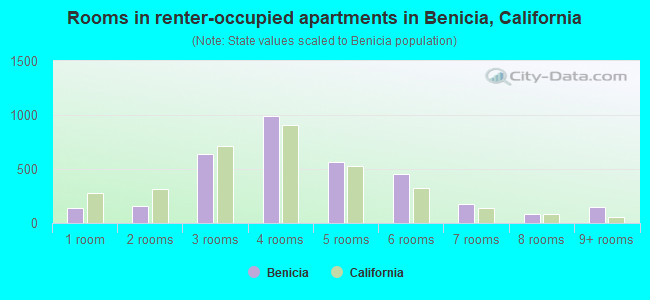
- Rooms in renter-occupied apartments in Benicia, California
- 1351 room
- 1562 rooms
- 6363 rooms
- 9944 rooms
- 5695 rooms
- 4526 rooms
- 1757 rooms
- 828 rooms
- 1519+ rooms
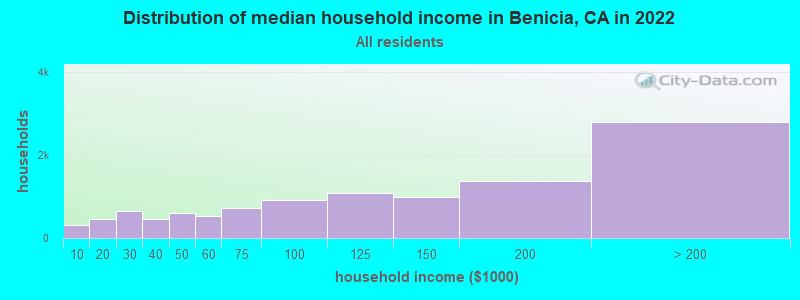
Benicia, CA household income distribution

- 315Less than $10,000
- 470$10,000 to $19,999
- 643$20,000 to $29,999
- 460$30,000 to $39,999
- 603$40,000 to $49,999
- 535$50,000 to $59,999
- 728$60,000 to $74,999
- 921$75,000 to $99,999
- 1,083$100,000 to $124,999
- 1,001$125,000 to $149,999
- 1,372$150,000 to $199,999
- 2,801$200,000 or more
Home value of owner - occupied houses in 2022 in Benicia, CA
-
- 83Less than $10,000
- 34$20,000 to $24,999
- 55$70,000 to $79,999
- 4$90,000 to $99,999
- 243$100,000 to $124,999
- 14$125,000 to $149,999
- 63$150,000 to $174,999
- 26$175,000 to $199,999
- 42$200,000 to $249,999
- 22$250,000 to $299,999
- 128$300,000 to $399,999
- 434$400,000 to $499,999
- 3,294$500,000 to $749,999
- 3,736$750,000 to $999,999
- 768$1,000,000 to $1,499,999
- 183$1,500,000 to $1,999,999
- 36$2,000,000 or more
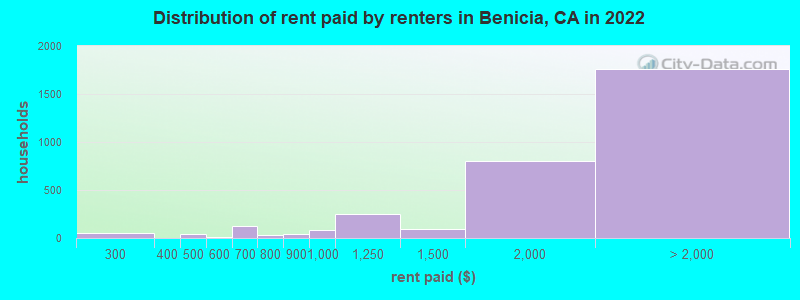
Rent paid by renters in 2022 in Benicia, CA
-
- 54$250 to $299
- 45$400 to $449
- 12$500 to $549
- 109$600 to $649
- 11$650 to $699
- 21$700 to $749
- 12$750 to $799
- 37$800 to $899
- 83$900 to $999
- 254$1,000 to $1,249
- 91$1,250 to $1,499
- 805$1,500 to $1,999
- 938$2,000 to $2,499
- 540$2,500 to $2,999
- 142$3,000 to $3,499
- 101$3,500 or more
- 42No cash rent
Percentage of workers working in this county: 58.2%
Number of people working at home: 3,174 (24.7% of all workers)
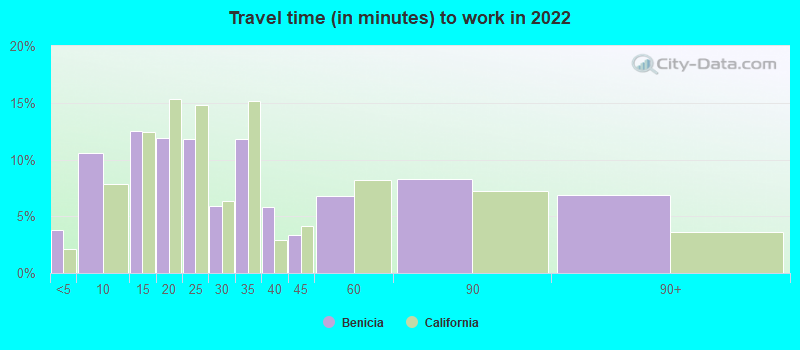
Travel time to work (commute)
- Less than 5 minutes: 440
- 5 to 9 minutes: 1,150
- 10 to 14 minutes: 1,255
- 15 to 19 minutes: 1,045
- 20 to 24 minutes: 1,333
- 25 to 29 minutes: 474
- 30 to 34 minutes: 1,035
- 35 to 39 minutes: 300
- 40 to 44 minutes: 396
- 45 to 59 minutes: 940
- 60 to 89 minutes: 1,243
- 90 or more minutes: 565
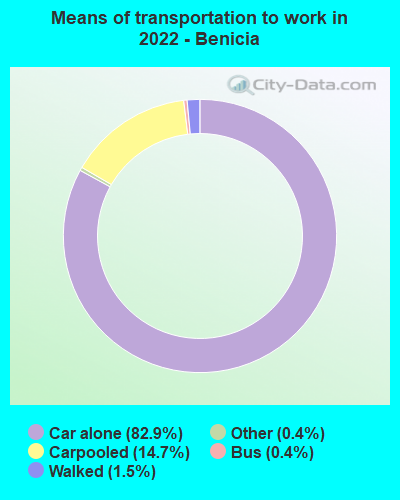
Means of transportation to work:
- Drove a car alone: 9,329 (64.9%)
- Carpooled: 1,975 (13.7%)
- Bus: 40 (0.3%)
- Taxi: 41 (0.3%)
- Bicycle: 12 (0.1%)
- Walked: 150 (1.0%)
- Worked at home: 3,174 (22.1%)
- Unemployment by race in 2022
- Unemployment rate for White non-Hispanic residents
- 4.1%Males
- 1.7%Females
- Unemployment rate for Black residents
- 28.1%Males
- Unemployment rate for American Indian and Alaska Native residents
- 100.0%Males
- 44.6%Females
- Unemployment rate for Asian residents
- 1.7%Males
- Unemployment rate for other race residents
- 5.1%Males
- 2.5%Females
- Unemployment rate for two or more race residents
- 5.9%Males
- 2.6%Females
- Unemployment rate for Hispanic or Latino residents
- 3.0%Males
- 1.4%Females
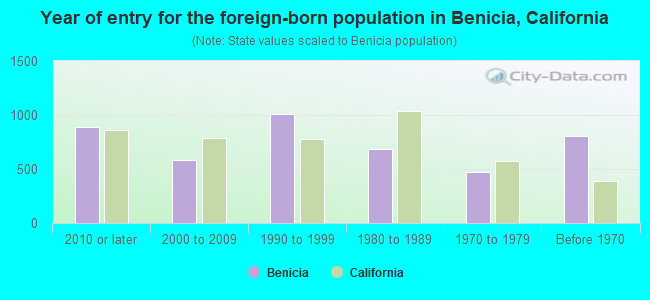
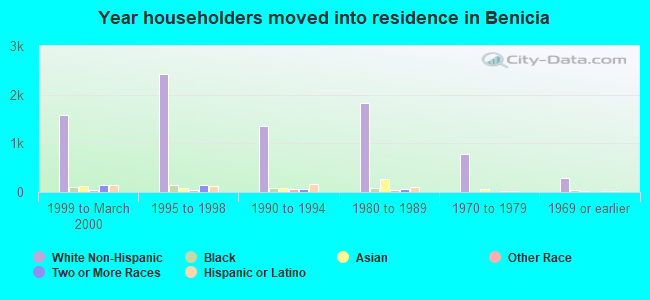
- Year of entry for the foreign-born population in Benicia, California
- 8862010 or later
- 5822000 to 2009
- 1,0081990 to 1999
- 6841980 to 1989
- 4701970 to 1979
- 807Before 1970
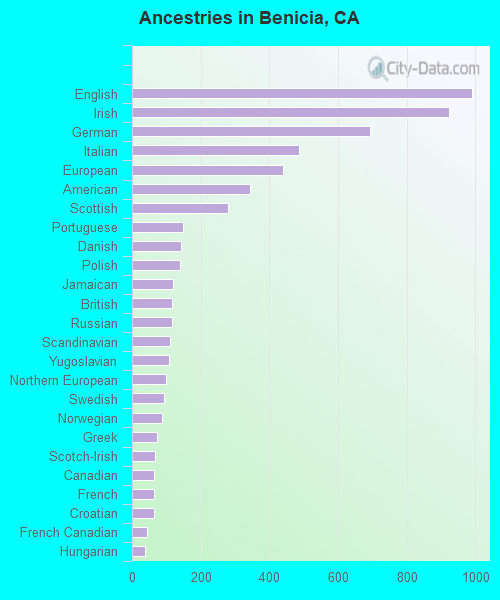
First ancestries reported:
- English: 990 (8.2%)
- Irish: 922 (7.6%)
- German: 692 (5.7%)
- Italian: 486 (4.0%)
- European: 440 (3.6%)
- American: 343 (2.8%)
- Scottish: 280 (2.3%)
- Portuguese: 148 (1.2%)
- Danish: 144 (1.2%)
- Polish: 141 (1.2%)
- Jamaican: 120 (1.0%)
- British: 116 (1.0%)
- Russian: 116 (1.0%)
- Scandinavian: 112 (0.9%)
- Yugoslavian: 107 (0.9%)
- Northern European: 99 (0.8%)
- Swedish: 92 (0.8%)
- Norwegian: 88 (0.7%)
- Greek: 73 (0.6%)
- Scotch-Irish: 67 (0.6%)
- Canadian: 65 (0.5%)
- French: 63 (0.5%)
- Croatian: 63 (0.5%)
- French Canadian: 45 (0.4%)
- Hungarian: 38 (0.3%)
- Lithuanian: 37 (0.3%)
- Macedonian: 35 (0.3%)
- Eastern European: 34 (0.3%)
- Iranian: 28 (0.2%)
- Dutch: 26 (0.2%)
- Lebanese: 21 (0.2%)
- Serbian: 21 (0.2%)
- Romanian: 17 (0.1%)
- Swiss: 14 (0.1%)
- Palestinian: 13 (0.1%)
- Maltese: 12 (0.10%)
- Finnish: 12 (0.10%)
- Latvian: 9 (0.07%)
- Cape Verdean: 9 (0.07%)
- Austrian: 9 (0.07%)
- Welsh: 8 (0.07%)
- African: 8 (0.07%)
- Egyptian: 7 (0.06%)
- Belgian: 6 (0.05%)
- Slovene: 6 (0.05%)
Most common places of birth for foreign-born residents (%):
| Benicia: | 20.9% (781) |
| California: | 7.8% (818,297) |
| Benicia: | 10.5% (392) |
| California: | 37.2% (3,881,193) |
| Benicia: | 8.1% (303) |
| California: | 6.6% (684,672) |
| Benicia: | 6.7% (250) |
| California: | 0.7% (74,025) |
| Benicia: | 4.8% (179) |
| California: | 4.2% (440,287) |
| Benicia: | 3.6% (136) |
| California: | 4.9% (512,335) |
| Benicia: | 3.6% (135) |
| California: | 1.2% (127,477) |
| Benicia: | 3.3% (124) |
| California: | 5.2% (539,184) |
| Benicia: | 2.8% (103) |
| California: | 0.6% (60,582) |
| Benicia: | 2.3% (85) |
| California: | 0.2% (15,939) |
| Benicia: | 2.2% (81) |
| California: | 0.3% (31,757) |
| Benicia: | 2.2% (81) |
| California: | 3.0% (315,248) |
| Benicia: | 2.1% (80) |
| California: | 0.5% (55,249) |
| Benicia: | 1.9% (72) |
| California: | 0.6% (57,953) |
| Benicia: | 1.8% (69) |
| California: | 1.0% (105,215) |
| Benicia: | 1.8% (69) |
| California: | 0.6% (58,161) |
| Benicia: | 1.7% (63) |
| California: | 0.5% (48,911) |
| Benicia: | 1.7% (63) |
| California: | 0.2% (16,541) |
| Benicia: | 1.6% (60) |
| California: | 0.6% (66,590) |
Place of birth for U.S.-born residents:
- This state: 17,120
- Other state: 5,271
- Northeast: 1,910
- Midwest: 1,520
- South: 1,207
- West: 857
91.1% of Benicia residents lived in the same house 1 years ago.
Out of people who lived in different houses, 30.7% lived in this county.
Out of people who lived in different counties, 74.2% lived in California.
| Benicia: | 91.1% |
| State average: | 88.9% |
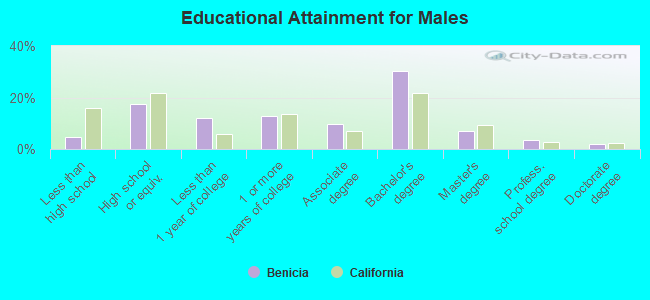
Education attainment for males 25 years and older:
- No schooling: 89
- Nursery to 4th grade: 3
- 5th and 6th grade: 0
- 7th and 8th grade: 25
- 9th grade: 37
- 10th grade: 70
- 11th grade: 22
- 12th grade, no diploma: 203
- High school graduate (or equivalency): 1,639
- Less than 1 year of college: 1,145
- Some college more than 1 year, no degree: 1,215
- Associate degree: 906
- Bachelor's degree: 2,825
- Master's degree: 671
- Professional school degree: 342
- Doctorate degree: 187
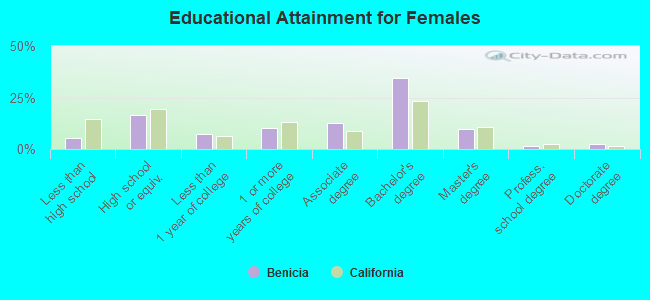
Education attainment for females 25 years and older:
- No schooling: 134
- Nursery to 4th grade: 31
- 5th and 6th grade: 17
- 7th and 8th grade: 25
- 9th grade: 0
- 10th grade: 170
- 11th grade: 29
- 12th grade, no diploma: 139
- High school graduate (or equivalency): 1,738
- Less than 1 year of college: 763
- Some college more than 1 year, no degree: 1,070
- Associate degree: 1,367
- Bachelor's degree: 3,701
- Master's degree: 1,052
- Professional school degree: 181
- Doctorate degree: 266
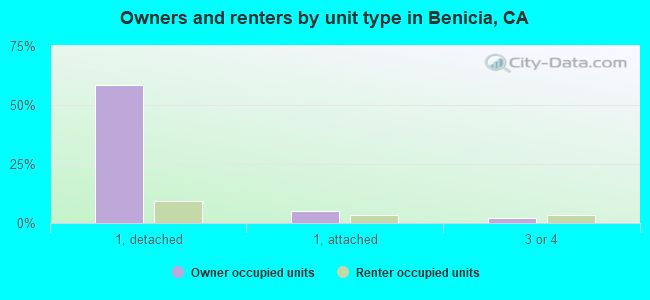
Housing units in structures:
- One, detached: 7,469
- One, attached: 1,127
- Two: 140
- 3 or 4: 856
- 5 to 9: 524
- 10 to 19: 184
- 20 to 49: 149
- 50 or more: 575
- Mobile homes: 462
Median worth of mobile homes: $189,210
Housing units lacking complete kitchen facilities in 2022: 0.2%
House/condo owner moved in on average 14 years ago
Renter moved in on average 3 years ago
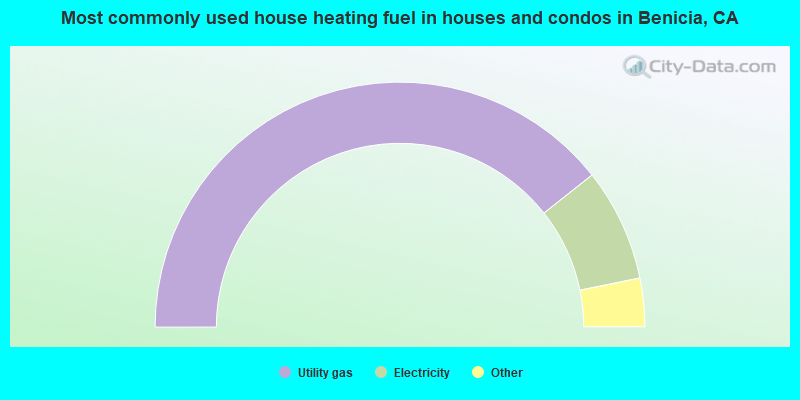
- 78.7%Utility gas
- 14.9%Electricity
- 3.2%Wood
- 2.0%Solar energy
- 0.4%Other fuel
- 0.4%Bottled, tank, or LP gas
- 0.3%No fuel used
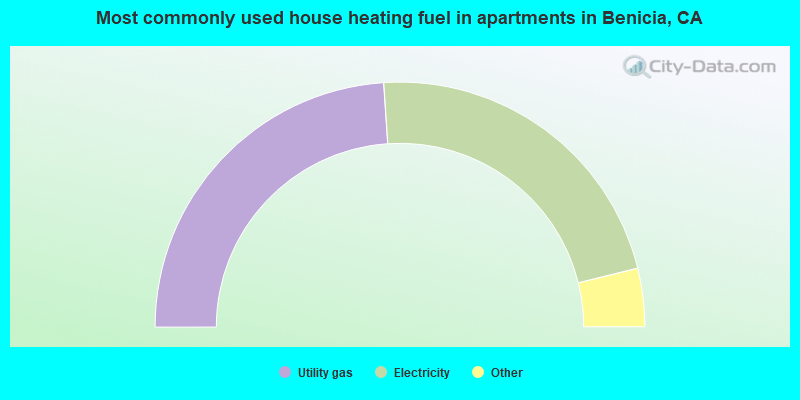
- 47.9%Utility gas
- 44.4%Electricity
- 3.2%Bottled, tank, or LP gas
- 2.6%No fuel used
- 1.8%Other fuel
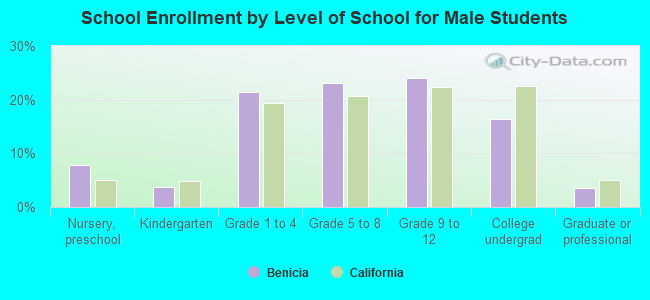
Private vs. public school enrollment:
| Here: | 12.8% |
| California: | 10.5% |
| Here: | 6.2% |
| California: | 8.5% |
| Here: | 16.5% |
| California: | 15.9% |