Housing density: 147 houses/condos per square mile
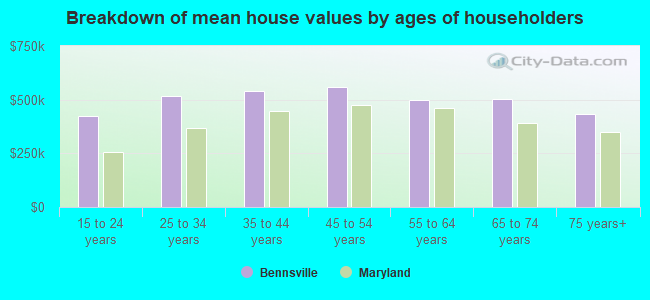
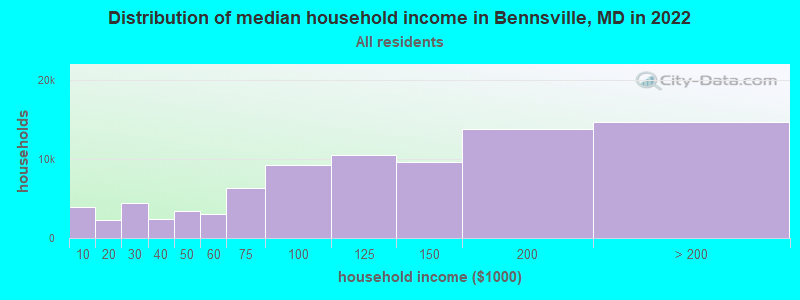
Median price asked for vacant for-sale houses and condos in 2022 in this county: $340,254.
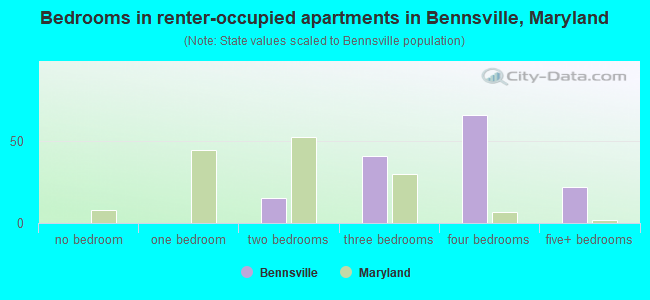
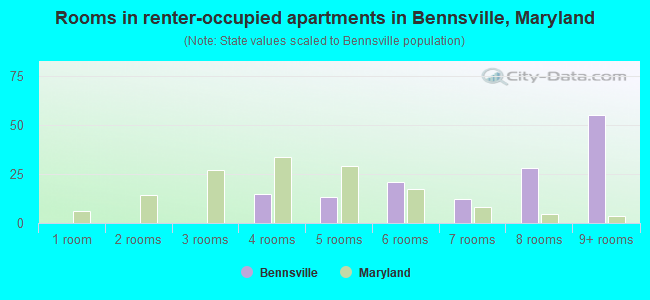
Median contract rent in 2022: over $2,000 (lower quartile is $1,703, upper quartile is over $2,000)
Median rent asked for vacant for-rent units in 2022: $4,069
Median gross rent in Bennsville, MD in 2022: over $2,000
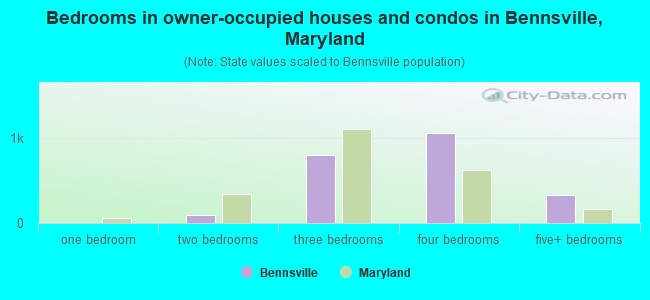
Housing units in Bennsville with a mortgage: 1,873 (299 second mortgage, 257 home equity loan, 0 both second mortgage and home equity loan) Houses without a mortgage: 275
In family households: 129,218 (25,516 male householders, 13,098 female householders)
27,772 spouses, 47,719 children (43,895 natural, 1,076 adopted, 2,748 stepchildren), 4,334 grandchildren, 1,551 brothers or sisters, 1,562 parents, foster children, 2,408 other relatives, 3,977 non-relatives
In nonfamily households: 15,928 (5,834 male householders (4,425 living alone)), 6,766 female householders (5,693 living alone)), 3,328 nonrelatives
In group quarters: 1,405 (987 institutionalized population)
22,792 married couples with children.
8,153 single-parent households (1,804 men, 6,349 women).
95.7% of residents of Bennsville speak English at home.
1.3% of residents speak Spanish at home (63% speak English very well, 37% speak English well).
2.3% of residents speak other Indo-European language at home (54% speak English very well, 32% speak English well, 14% speak English not well).
0.4% of residents speak Asian or Pacific Island language at home (72% speak English very well, 28% speak English not well).
0.4% of residents speak other language at home (72% speak English very well, 28% speak English well).
Foreign born population: 728 (7.0%)
(63.5% of them are naturalized citizens)
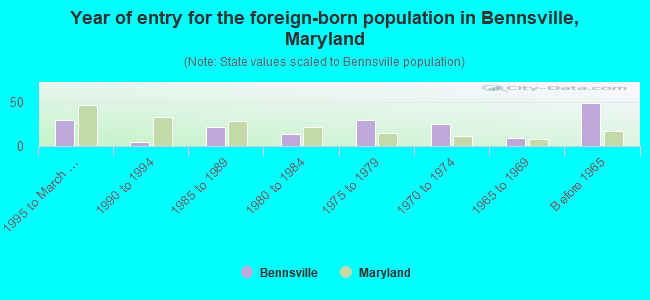
Year of entry for the foreign-born population in Bennsville, Maryland
291995 to March 2000
51990 to 1994
211985 to 1989
131980 to 1984
291975 to 1979
251970 to 1974
91965 to 1969
48Before 1965
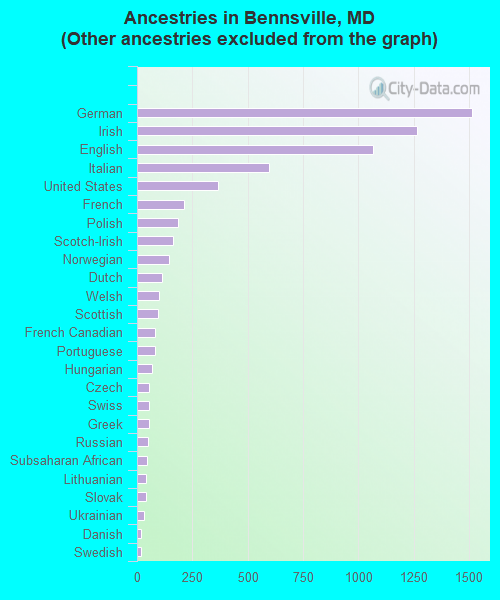
First ancestries reported:
Other: 1,997 (23.6%)
German: 1,515 (17.9%)
Irish: 1,265 (14.9%)
English: 1,065 (12.6%)
Italian: 597 (7.1%)
United States: 364 (4.3%)
French: 213 (2.5%)
Polish: 184 (2.2%)
Scotch-Irish: 163 (1.9%)
Norwegian: 144 (1.7%)
Dutch: 113 (1.3%)
Welsh: 98 (1.2%)
Scottish: 94 (1.1%)
French Canadian: 80 (0.9%)
Portuguese: 80 (0.9%)
Hungarian: 67 (0.8%)
Czech: 54 (0.6%)
Swiss: 54 (0.6%)
Greek: 53 (0.6%)
Russian: 49 (0.6%)
Subsaharan African: 46 (0.5%)
Lithuanian: 42 (0.5%)
Slovak: 39 (0.5%)
Ukrainian: 30 (0.4%)
Danish: 19 (0.2%)
Swedish: 17 (0.2%)
West Indian: 14 (0.2%)
Arab: 12 (0.1%)
Most common places of birth for foreign-born residents (%):
Korea
Bennsville:
21.2% (38)
Maryland:
6.0% (31,249)
United Kingdom
Bennsville:
9.5% (17)
Maryland:
2.7% (14,206)
Germany
Bennsville:
9.5% (17)
Maryland:
2.8% (14,555)
Afghanistan
Bennsville:
8.4% (15)
Maryland:
0.2% (1,107)
Trinidad and Tobago
Bennsville:
7.8% (14)
Maryland:
2.1% (11,050)
Brazil
Bennsville:
7.8% (14)
Maryland:
0.9% (4,697)
Lebanon
Bennsville:
6.7% (12)
Maryland:
0.3% (1,463)
Philippines
Bennsville:
6.1% (11)
Maryland:
4.1% (21,007)
Cuba
Bennsville:
5.6% (10)
Maryland:
0.6% (2,921)
Jamaica
Bennsville:
5.0% (9)
Maryland:
3.7% (18,988)
Other Eastern Europe
Bennsville:
3.9% (7)
Maryland:
1.0% (5,093)
Portugal
Bennsville:
2.8% (5)
Maryland:
0.3% (1,439)
Yugoslavia
Bennsville:
2.8% (5)
Maryland:
0.1% (733)
Guyana
Bennsville:
2.8% (5)
Maryland:
1.2% (6,190)
Place of birth for U.S.-born residents:
This state: 2,587
Other state: 4,444
Northeast: 860
Midwest: 346
South: 2,964
West: 274
56% of Bennsville residents lived in the same house 5 years ago. Out of people who lived in different houses, 39% lived in this county. Out of people who lived in different counties, 49% lived in Maryland.
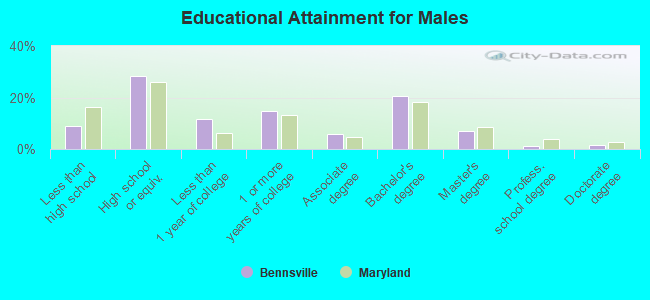
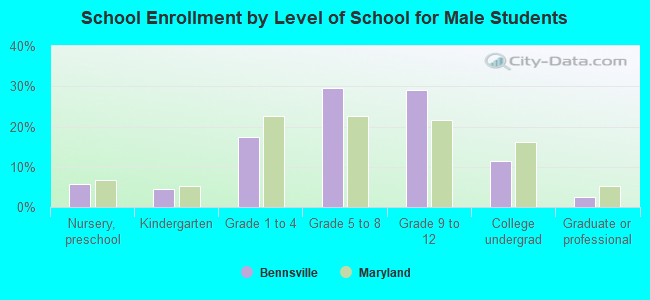
Education attainment for males 25 years and older:
No schooling: 13
Nursery to 4th grade: 16
5th and 6th grade: 7
7th and 8th grade: 30
9th grade: 25
10th grade: 42
11th grade: 42
12th grade, no diploma: 32
High school graduate (or equivalency): 659
Less than 1 year of college: 269
Some college more than 1 year, no degree: 345
Associate degree: 138
Bachelor's degree: 481
Master's degree: 162
Professional school degree: 30
Doctorate degree: 37
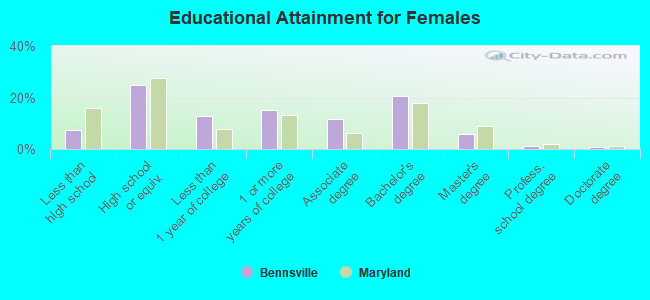
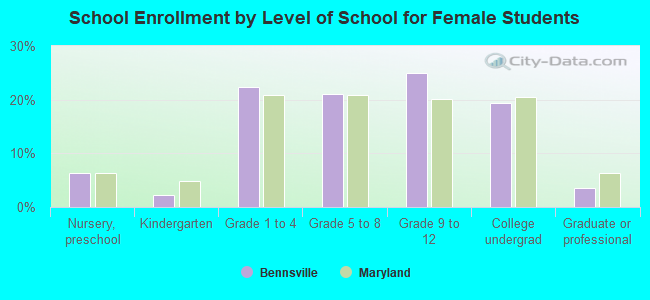
Education attainment for females 25 years and older:
No schooling: 0
Nursery to 4th grade: 0
5th and 6th grade: 0
7th and 8th grade: 44
9th grade: 25
10th grade: 37
11th grade: 20
12th grade, no diploma: 56
High school graduate (or equivalency): 607
Less than 1 year of college: 312
Some college more than 1 year, no degree: 366
Associate degree: 281
Bachelor's degree: 498
Master's degree: 141
Professional school degree: 29
Doctorate degree: 16
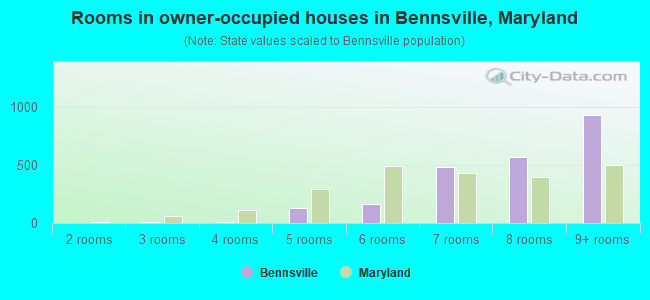
Housing units in structures:
One, detached: 2,293
One, attached: 189
Two: 7
Mobile homes: 8
Median worth of mobile homes: $348,608
Housing units lacking complete plumbing facilities: 0.4%
Housing units lacking complete kitchen facilities: 0.4%