Berea, SC (South Carolina) Houses and Residents
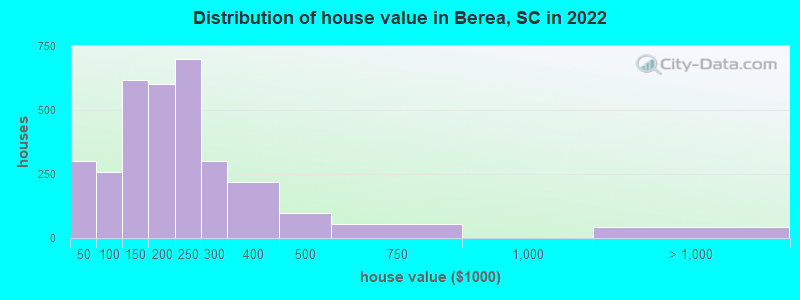
Estimated median house or condo value in 2022: $187,454 (it was $81,700 in 2000 )
Berea:
$187,454South Carolina:
$254,600
Lower value quartile - upper value quartile: $140,299 - $251,578Total population: 14,295 (Urban population: 14,087, Rural population: 65 (all nonfarm) )
Houses: 6,829 (6,361 occupied: 3,906 owner occupied, 2,477 renter occupied )
% of renters here:
39%State:
28%
Housing density: 898 houses/condos per square mile
Median price asked for vacant for-sale houses and condos in 2022: $484,351.
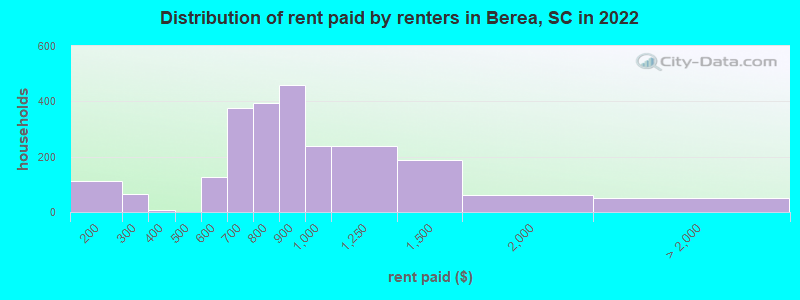
Median contract rent in 2022: $835 (lower quartile is $716, upper quartile is $991)
Median rent asked for vacant for-rent units in 2022: $1,048
Median gross rent in Berea, SC in 2022: $1,024
Housing units in Berea with a mortgage: 2,298 (95 second mortgage, 0 home equity loan, 68 both second mortgage and home equity loan )Houses without a mortgage: 157
Median household income for houses/condos with a mortgage: $67,452
Median household income for apartments without a mortgage: $49,517
Median monthly housing costs: $899
Data:
Median house or condo value ($)
Median house or condo value ($ change since 2000)
Median house or condo value ($) - White
Median house or condo value ($) - Black or African American
Median house or condo value ($) - Asian
Median house or condo value ($) - Hispanic or Latino
Median house or condo value ($) - American Indian and Alaska Native
Median house or condo value ($) - Multirace
Median house or condo value ($) - Other Race
Median price asked for mobile homes ($)
Household density (households per square mile)
Mean house or condo value by units in structure - 1, detached ($)
Mean house or condo value by units in structure - 1, attached ($)
Mean house or condo value by units in structure - 2 ($)
Mean house or condo value by units in structure by units in structure - 3 or 4 ($)
Mean house or condo value by units in structure - 5 or more ($)
Mean house or condo value by units in structure - Boat, RV, van, etc. ($)
Mean house or condo value by units in structure - Mobile home ($)
Median contract rent ($)
Median contract rent - Lower quartile ($)
Median contract rent - Upper quartile ($)
Median gross rent ($)
Urban houses (%)
Rural houses (%)
Houses occupied (%)
Houses occupied (% change since 2000)
Houses owner occupied (%)
Houses owner occupied (% change since 2000)
Houses renter occupied (%)
Houses renter occupied (% change since 2000)
Vacant housing units - For rent (%)
Vacant housing units - For rent (% change since 2000)
Vacant housing units - For sale only (%)
Vacant housing units - For sale only (% change since 2000)
Vacant housing units - Rented or sold, not occupied (%)
Vacant housing units - Rented or sold, not occupied (% change since 2000)
Vacant housing units - For seasonal, recreational, or occasional use (%)
Vacant housing units - For seasonal, recreational, or occasional use (% change since 2000)
Vacant housing units - For migrant workers (%)
Vacant housing units - For migrant workers (% change since 2000)
Vacant housing units - Other vacant (%)
Vacant housing units - Other vacant (% change since 2000)
Median monthly housing costs ($)
Median household income for houses/condos with a mortgage ($)
Median household income for houses/condos without a mortgage ($)
Median household income ($)
Median household income ($) - White
Median household income ($) - Black or African American
Median household income ($) - Asian
Median household income ($) - Hispanic or Latino
Median household income ($) - American Indian and Alaska Native
Median household income ($) - Multirace
Median household income ($) - Other Race
Mortgage status - with mortgage (%)
Mortgage status - with second mortgage (%)
Mortgage status - with home equity loan (%)
Mortgage status - with both second mortgage and home equity loan (%)
Mortgage status - without a mortgage (%)
Median year house/condo built
Median year apartment built
Household type by relationship - Male householder living alone (%)
Household type by relationship - Male householder not living alone (%)
Household type by relationship - Female householder living alone (%)
Household type by relationship - Female householder not living alone (%)
Household type by relationship - Opposite-Sex spouse (%)
Household type by relationship - Same-Sex spouse (%)
Household type by relationship - Opposite-Sex unmarried partner (%)
Household type by relationship - Same-Sex unmarried partner (%)
Household type by relationship - In group quarters (%)
Size of family households - 2-person household (%)
Size of family households - 3-person household (%)
Size of family households - 4-person household (%)
Size of family households - 5-person household (%)
Size of family households - 6-person household (%)
Size of family households - 7-or-more-person household (%)
Size of nonfamily households - 1-person household (%)
Size of nonfamily households - 2-person household (%)
Size of nonfamily households - 3-person household (%)
Size of nonfamily households - 4-person household (%)
Size of nonfamily households - 5-person household (%)
Size of nonfamily households - 6-person household (%)
Size of nonfamily households - 7-or-moreperson household (%)
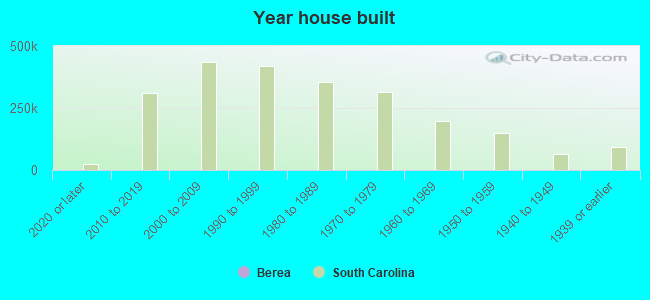
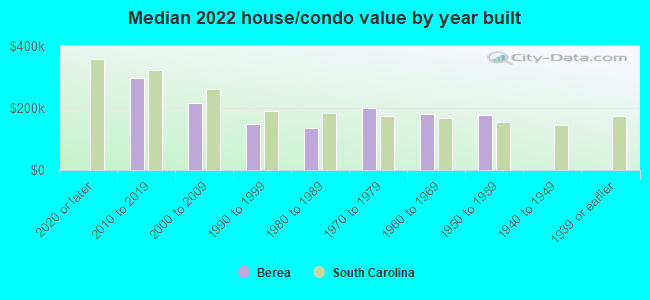
Year house built - Built 2010 or later (%)
Year house built - Built 2000 to 2009 (%)
Year house built - Built 1990 to 1999 (%)
Year house built - Built 1980 to 1989 (%)
Year house built - Built 1970 to 1979 (%)
Year house built - Built 1960 to 1969 (%)
Year house built - Built 1950 to 1959 (%)
Year house built - Built 1940 to 1949 (%)
Year house built - Built 1939 or earlier (%)
Median number of rooms in houses and condos
Median number of rooms in apartments
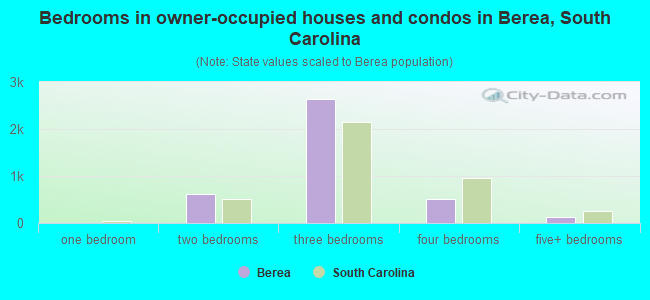
Median number of bedrooms in owner occupied houses
Mean number of bedrooms in owner occupied houses
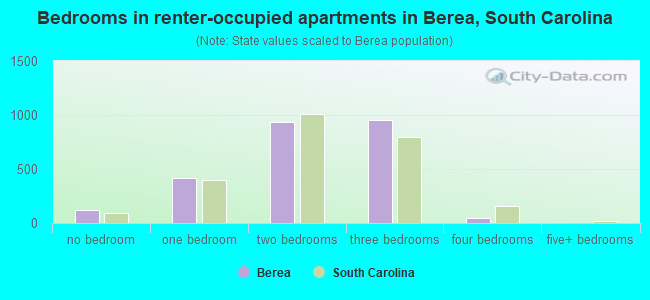
Median number of bedrooms in renter occupied houses
Mean number of bedrooms in renter occupied houses
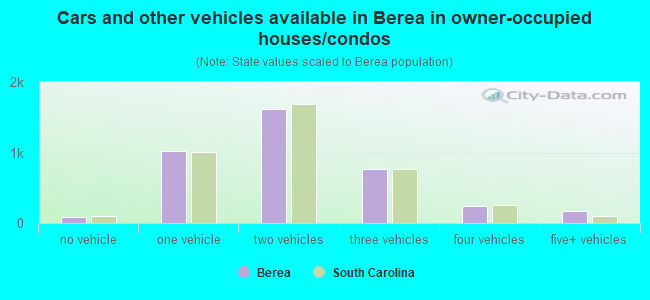
Median number of vehichles in owner occupied houses
Mean number of vehichles in owner occupied houses
Median number of vehichles in renter occupied houses
Mean number of vehichles in renter occupied houses
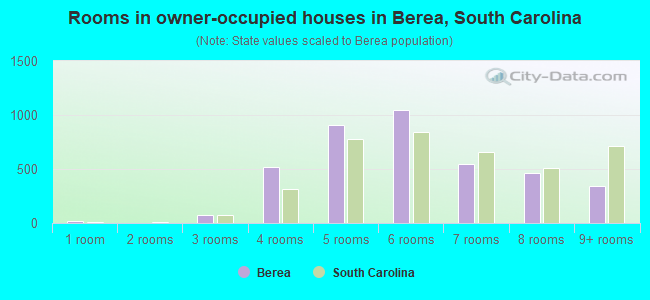
Rooms in owner-occupied houses - 1 room (%)
Rooms in owner-occupied houses - 2 rooms (%)
Rooms in owner-occupied houses - 3 rooms (%)
Rooms in owner-occupied houses - 4 rooms (%)
Rooms in owner-occupied houses - 5 rooms (%)
Rooms in owner-occupied houses - 6 rooms (%)
Rooms in owner-occupied houses - 7 rooms (%)
Rooms in owner-occupied houses - 8 rooms (%)
Rooms in owner-occupied houses - 9+ rooms (%)
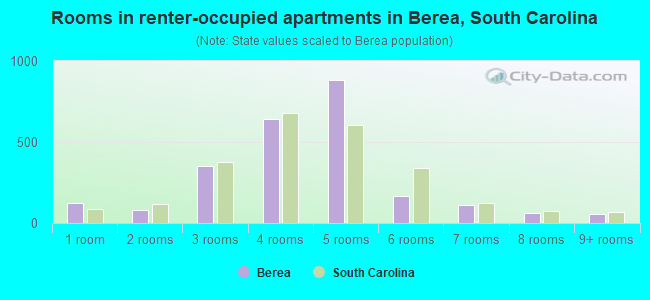
Rooms in renter-occupied houses - 1 room (%)
Rooms in renter-occupied houses - 2 rooms (%)
Rooms in renter-occupied houses - 3 rooms (%)
Rooms in renter-occupied houses - 4 rooms (%)
Rooms in renter-occupied houses - 5 rooms (%)
Rooms in renter-occupied houses - 6 rooms (%)
Rooms in renter-occupied houses - 7 rooms (%)
Rooms in renter-occupied houses - 8 rooms (%)
Rooms in renter-occupied houses - 9+ rooms (%)
Bedrooms in owner-occupied houses - no bedrooms (%)
Bedrooms in owner-occupied houses - 1 bedroom (%)
Bedrooms in owner-occupied houses - 2 bedrooms (%)
Bedrooms in owner-occupied houses - 3 bedrooms (%)
Bedrooms in owner-occupied houses - 4 bedrooms (%)
Bedrooms in owner-occupied houses - 5+ bedrooms (%)
Bedrooms in renter-occupied houses - no bedrooms (%)
Bedrooms in renter-occupied houses - 1 bedroom (%)
Bedrooms in renter-occupied houses - 2 bedrooms (%)
Bedrooms in renter-occupied houses - 3 bedrooms (%)
Bedrooms in renter-occupied houses - 4 bedrooms (%)
Bedrooms in renter-occupied houses - 5+ bedrooms (%)
Vehicles available in owner-occupied houses - no vehicle available (%)
Vehicles available in owner-occupied houses - 1 vehicle available(%)
Vehicles available in owner-occupied houses - 2 Vehicles available (%)
Vehicles available in owner-occupied houses - 3 Vehicles available (%)
Vehicles available in owner-occupied houses - 4 Vehicles available (%)
Vehicles available in owner-occupied houses - 5+ Vehicles available (%)
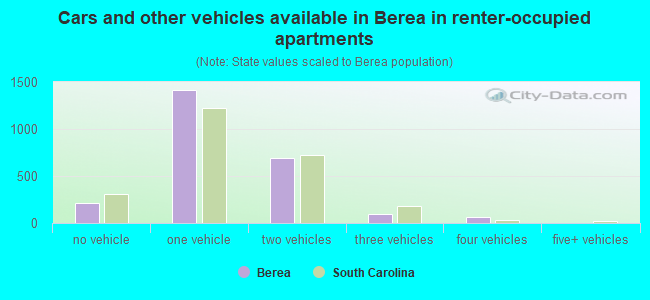
Vehicles available in renter-occupied houses - no vehicle available (%)
Vehicles available in renter-occupied houses - 1 vehicle available (%)
Vehicles available in renter-occupied houses - 2 Vehicles available (%)
Vehicles available in renter-occupied houses - 3 Vehicles available (%)
Vehicles available in renter-occupied houses - 4 Vehicles available (%)
Vehicles available in renter-occupied houses - 5+ Vehicles available (%)
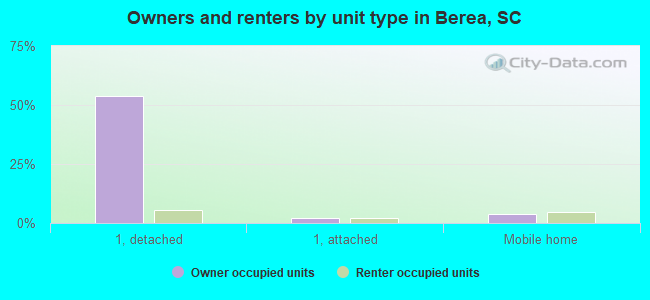
Housing units in structures - 1, detached (%)
Housing units in structures - 1, attached (%)
Housing units in structures - 2 (%)
Housing units in structures - 3 or 4 (%)
Housing units in structures - 5 to 9 (%)
Housing units in structures - 10 to 19 (%)
Housing units in structures - 20 to 49 (%)
Housing units in structures - 50 or more (%)
Housing units in structures - Mobile home (%)
Housing units in structures - Boat, RV, van, etc. (%)
Housing units in structures - Owners - 1, detached (%)
Housing units in structures - Owners - 1, attached (%)
Housing units in structures - Owners - 2 (%)
Housing units in structures - Owners - 3 or 4 (%)
Housing units in structures - Owners - 5 to 9 (%)
Housing units in structures - Owners - 10 to 19 (%)
Housing units in structures - Owners - 20 to 49 (%)
Housing units in structures - Owners - 50 or more (%)
Housing units in structures - Owners - Mobile home (%)
Housing units in structures - Owners - Boat, RV, van, etc. (%)
Housing units in structures - Renters - 1, detached (%)
Housing units in structures - Renters - 1, attached (%)
Housing units in structures - Renters - 2 (%)
Housing units in structures - Renters - 3 or 4 (%)
Housing units in structures - Renters - 5 to 9 (%)
Housing units in structures - Renters - 10 to 19 (%)
Housing units in structures - Renters - 20 to 49 (%)
Housing units in structures - Renters - 50 or more (%)
Housing units in structures - Renters - Mobile home (%)
Housing units in structures - Renters - Boat, RV, van, etc. (%)
House/condo owner moved in on average (years ago)
Renter moved in on average (years ago)
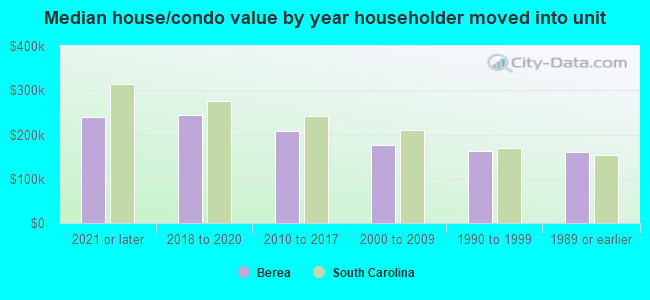
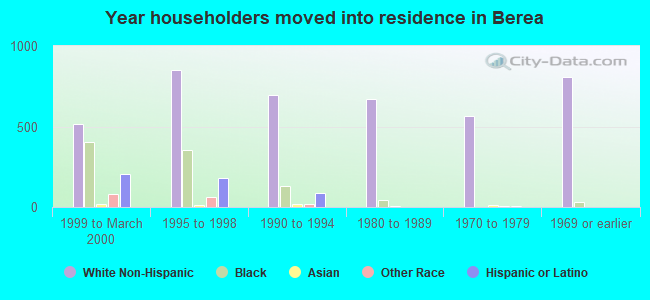
Year householder moved into unit - Moved in 1999 to March 2000 (%)
Year householder moved into unit - Moved in 1999 to March 2000 (%) - White
Year householder moved into unit - Moved in 1999 to March 2000 (%) - Black or African American
Year householder moved into unit - Moved in 1999 to March 2000 (%) - Asian
Year householder moved into unit - Moved in 1999 to March 2000 (%) - Hispanic or Latino
Year householder moved into unit - Moved in 1999 to March 2000 (%) - American Indian and Alaska Native
Year householder moved into unit - Moved in 1999 to March 2000 (%) - Multirace
Year householder moved into unit - Moved in 1999 to March 2000 (%) - Other Race
Year householder moved into unit - Moved in 1995 to 1998 (%)
Year householder moved into unit - Moved in 1995 to 1998 (%) - White
Year householder moved into unit - Moved in 1995 to 1998 (%) - Black or African American
Year householder moved into unit - Moved in 1995 to 1998 (%) - Asian
Year householder moved into unit - Moved in 1995 to 1998 (%) - Hispanic or Latino
Year householder moved into unit - Moved in 1995 to 1998 (%) - American Indian and Alaska Native
Year householder moved into unit - Moved in 1995 to 1998 (%) - Multirace
Year householder moved into unit - Moved in 1995 to 1998 (%) - Other Race
Year householder moved into unit - Moved in 1990 to 1994 (%)
Year householder moved into unit - Moved in 1990 to 1994 (%) - White
Year householder moved into unit - Moved in 1990 to 1994 (%) - Black or African American
Year householder moved into unit - Moved in 1990 to 1994 (%) - Asian
Year householder moved into unit - Moved in 1990 to 1994 (%) - Hispanic or Latino
Year householder moved into unit - Moved in 1990 to 1994 (%) - American Indian and Alaska Native
Year householder moved into unit - Moved in 1990 to 1994 (%) - Multirace
Year householder moved into unit - Moved in 1990 to 1994 (%) - Other Race
Year householder moved into unit - Moved in 1980 to 1989 (%)
Year householder moved into unit - Moved in 1980 to 1989 (%) - White
Year householder moved into unit - Moved in 1980 to 1989 (%) - Black or African American
Year householder moved into unit - Moved in 1980 to 1989 (%) - Asian
Year householder moved into unit - Moved in 1980 to 1989 (%) - Hispanic or Latino
Year householder moved into unit - Moved in 1980 to 1989 (%) - American Indian and Alaska Native
Year householder moved into unit - Moved in 1980 to 1989 (%) - Multirace
Year householder moved into unit - Moved in 1980 to 1989 (%) - Other Race
Year householder moved into unit - Moved in 1970 to 1979 (%)
Year householder moved into unit - Moved in 1970 to 1979 (%) - White
Year householder moved into unit - Moved in 1970 to 1979 (%) - Black or African American
Year householder moved into unit - Moved in 1970 to 1979 (%) - Asian
Year householder moved into unit - Moved in 1970 to 1979 (%) - Hispanic or Latino
Year householder moved into unit - Moved in 1970 to 1979 (%) - American Indian and Alaska Native
Year householder moved into unit - Moved in 1970 to 1979 (%) - Multirace
Year householder moved into unit - Moved in 1970 to 1979 (%) - Other Race
Year householder moved into unit - Moved in 1969 or earlier (%)
Year householder moved into unit - Moved in 1969 or earlier (%) - White
Year householder moved into unit - Moved in 1969 or earlier (%) - Black or African American
Year householder moved into unit - Moved in 1969 or earlier (%) - Asian
Year householder moved into unit - Moved in 1969 or earlier (%) - Hispanic or Latino
Year householder moved into unit - Moved in 1969 or earlier (%) - American Indian and Alaska Native
Year householder moved into unit - Moved in 1969 or earlier (%) - Multirace
Year householder moved into unit - Moved in 1969 or earlier (%) - Other Race
Housing units lacking complete plumbing facilities (%)
Housing units lacking complete kitchen facilities (%)
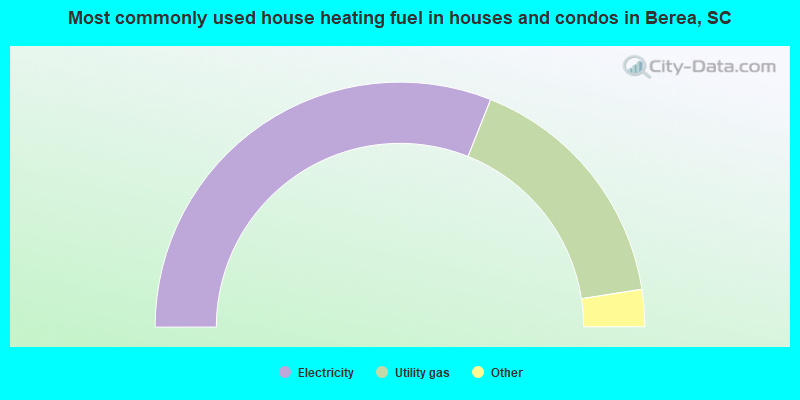
House heating fuel used in houses and condos - Utility gas (%)
House heating fuel used in houses and condos - Bottled, tank, or LP gas (%)
House heating fuel used in houses and condos - Electricity (%)
House heating fuel used in houses and condos - Fuel oil, kerosene, etc. (%)
House heating fuel used in houses and condos - Coal or coke (%)
House heating fuel used in houses and condos - Wood (%)
House heating fuel used in houses and condos - Solar energy (%)
House heating fuel used in houses and condos - Other fuel (%)
House heating fuel used in houses and condos - No fuel used (%)
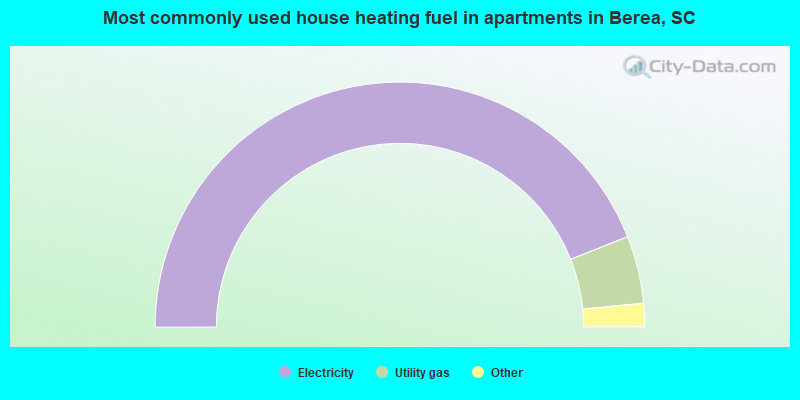
House heating fuel used in apartments - Utility gas (%)
House heating fuel used in apartments - Bottled, tank, or LP gas (%)
House heating fuel used in apartments - Electricity (%)
House heating fuel used in apartments - Fuel oil, kerosene, etc. (%)
House heating fuel used in apartments - Coal or coke (%)
House heating fuel used in apartments - Wood (%)
House heating fuel used in apartments - Solar energy (%)
House heating fuel used in apartments - Other fuel (%)
House heating fuel used in apartments - No fuel used (%)
Latest news about housing in Berea, SC collected exclusively by city-data.com from local newspapers, TV, and radio stations
Median year house/condo built: 1975Median year apartment built: 1988Household type by relationship:
Households: 16,787
Male householders: 2,778 (578 living alone ), Female householders: 3,494 (1,301 living alone )2,251 spouses (2,234 opposite-sex spouses ), 656 unmarried partners , (644 opposite-sex unmarried partners ), 4,694 children (4,251 natural , 120 adopted , 322 stepchildren ), 588 grandchildren , 321 brothers or sisters , 609 parents , 125 foster children , 411 other relatives , 539 non-relatives In group quarters: 314
Size of family households: 1,594 2-persons , 953 3-persons , 810 4-persons , 422 5-persons , 88 6-persons , 312 7-or-more-persons .
Size of nonfamily households: 1,907 1-person , 300 2-persons , 41 3-persons , 7 4-persons .
1,567 married couples with children. single-parent households (217 men , 933 women ).
72.9% of residents of Berea speak English at home. of residents speak Spanish at home (39% speak English very well , 22% speak English well , 19% speak English not well , 20% don't speak English at all ).of residents speak other Indo-European language at home (53% speak English very well , 29% speak English well , 18% speak English not well ).of residents speak Asian or Pacific Island language at home (44% speak English very well , 15% speak English well , 41% speak English not well ).of residents speak other language at home (60% speak English very well , 35% speak English well , 6% speak English not well ).
Foreign born population: 2,829 (16.9%)of them are naturalized citizens )
Median number of rooms in houses and condos:
Median number of rooms in apartments
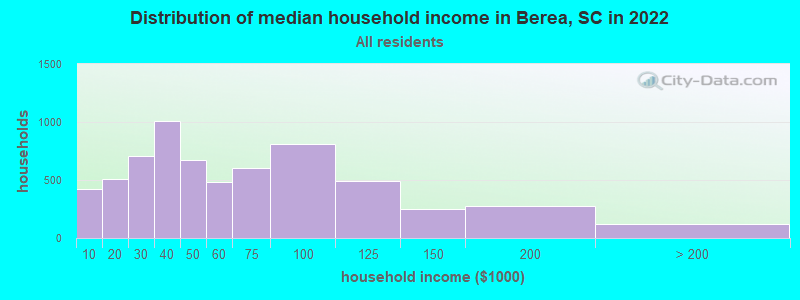
Berea, SC household income distribution 421 Less than $10,000512 $10,000 to $19,999709 $20,000 to $29,9991,008 $30,000 to $39,999674 $40,000 to $49,999483 $50,000 to $59,999600 $60,000 to $74,999809 $75,000 to $99,999490 $100,000 to $124,999253 $125,000 to $149,999276 $150,000 to $199,999119 $200,000 or more
Home value of owner - occupied houses in 2022 in Berea, SC 84 Less than $10,00038 $10,000 to $14,99941 $15,000 to $19,99936 $20,000 to $24,99927 $25,000 to $29,99933 $30,000 to $34,99923 $35,000 to $39,99914 $40,000 to $49,99936 $50,000 to $59,9996 $60,000 to $69,9995 $70,000 to $79,99949 $80,000 to $89,999145 $90,000 to $99,999380 $100,000 to $124,999238 $125,000 to $149,999335 $150,000 to $174,999264 $175,000 to $199,999698 $200,000 to $249,999299 $250,000 to $299,999220 $300,000 to $399,99997 $400,000 to $499,99955 $500,000 to $749,99916 $1,000,000 to $1,499,99925 $2,000,000 or moreRent paid by renters in 2022 in Berea, SC 10 $100 to $149101 $150 to $19953 $200 to $24912 $250 to $2996 $350 to $39949 $500 to $54976 $550 to $599147 $600 to $649227 $650 to $699178 $700 to $749216 $750 to $799459 $800 to $899240 $900 to $999237 $1,000 to $1,249189 $1,250 to $1,49963 $1,500 to $1,99949 No cash rent
Percentage of workers working in this county: 82.9%Number of people working at home: 306 (4.1% of all workers )
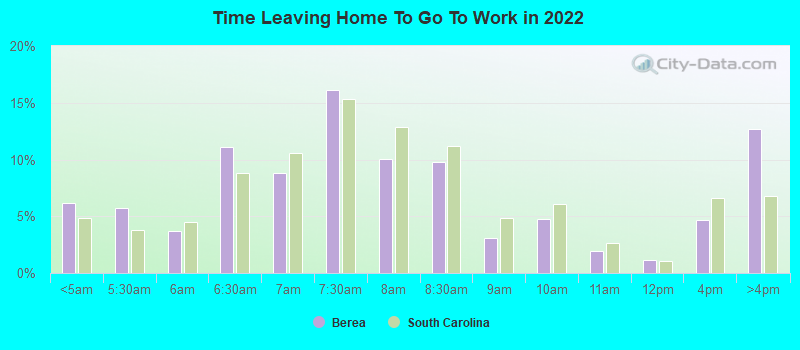
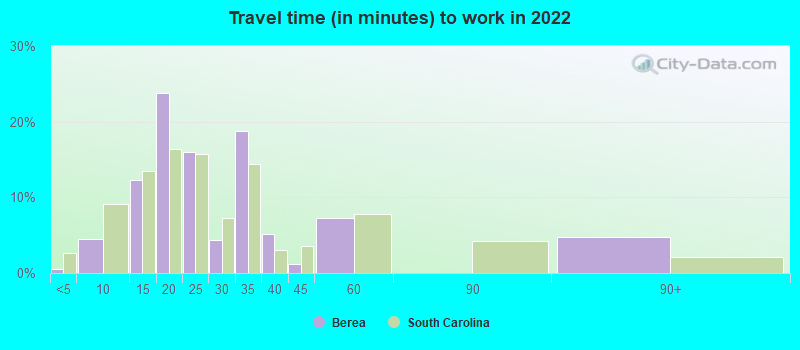
Travel time to work (commute)
Less than 5 minutes: 135 to 9 minutes: 31910 to 14 minutes: 95515 to 19 minutes: 81120 to 24 minutes: 1,31125 to 29 minutes: 59830 to 34 minutes: 1,58935 to 39 minutes: 19740 to 44 minutes: 36745 to 59 minutes: 55960 to 89 minutes: 18290 or more minutes: 168
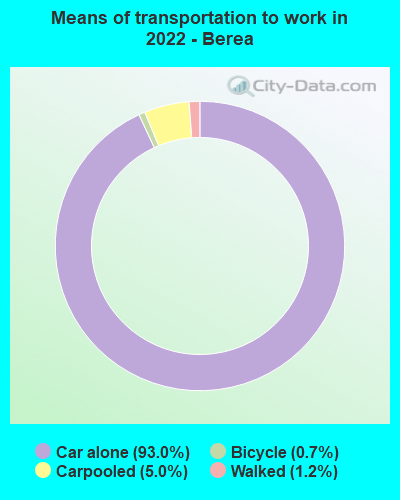
Means of transportation to work:
Drove a car alone: 1,415 (79.3%)Carpooled: 71 (4.0%)Bicycle: 13 (0.7%)Walked: 15 (0.8%)Worked at home: 306 (17.2%)
Unemployment by race in 2022
Unemployment rate for White non-Hispanic residents 3.0% Males4.2% FemalesUnemployment rate for Black residents 39.4% Males8.9% FemalesUnemployment rate for Asian residents 6.4% FemalesUnemployment rate for other race residents 8.2% FemalesUnemployment rate for two or more race residents 1.4% MalesUnemployment rate for Hispanic or Latino residents 8.8% Males2.9% Females
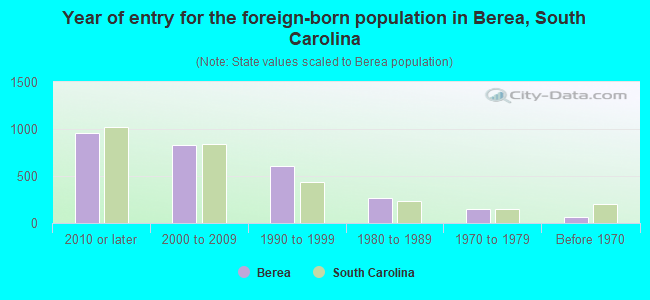
Year of entry for the foreign-born population in Berea, South Carolina
958 2010 or later 834 2000 to 2009 609 1990 to 1999 271 1980 to 1989 146 1970 to 1979 63 Before 1970
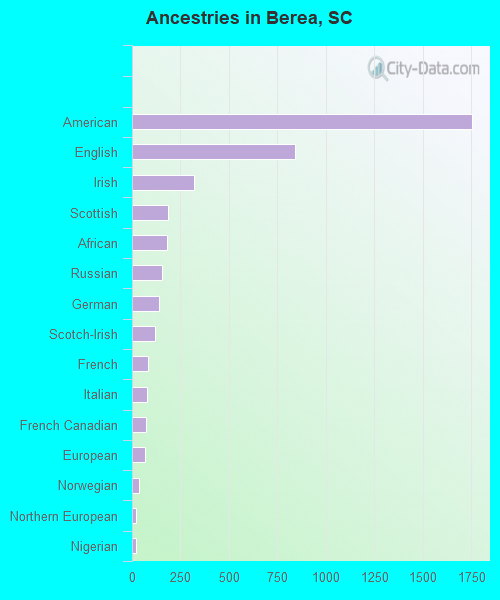
First ancestries reported:
American: 1,754 (17.2%)
English: 839 (8.2%)
Irish: 322 (3.2%)
Scottish: 187 (1.8%)
African: 182 (1.8%)
Russian: 157 (1.5%)
German: 141 (1.4%)
Scotch-Irish: 118 (1.2%)
French: 83 (0.8%)
Italian: 78 (0.8%)
French Canadian: 72 (0.7%)
European: 68 (0.7%)
Norwegian: 35 (0.3%)
Northern European: 20 (0.2%)
Nigerian: 20 (0.2%)
Eastern European: 15 (0.1%)
Scandinavian: 11 (0.1%)
West Indian: 10 (0.10%)
Lithuanian: 9 (0.09%)
Polish: 7 (0.07%)
British: 4 (0.04%) Most common places of birth for foreign-born residents (%): Honduras Berea:
22.1% (667)South Carolina:
4.8% (12,834)
Colombia Berea:
20.5% (618)South Carolina:
4.3% (11,533)
Mexico Berea:
20.1% (607)South Carolina:
22.5% (60,774)
Guatemala Berea:
12.4% (375)South Carolina:
3.4% (9,058)
Russia Berea:
5.2% (158)South Carolina:
1.3% (3,522)
Costa Rica Berea:
1.8% (53)South Carolina:
0.5% (1,395)
Philippines Berea:
1.7% (51)South Carolina:
4.1% (11,031)
Uruguay Berea:
1.5% (46)South Carolina:
0.2% (561)
Place of birth for U.S.-born residents:
This state: 9,765Other state: 3,852Northeast: 837Midwest: 676South: 1,802West: 518 84.0% of Berea residents lived in the same house 1 years ago.
Out of people who lived in different houses, 35.3% lived in this county.
Out of people who lived in different counties, 40.8% lived in South Carolina.
Berea:
84.0%State average:
86.5%
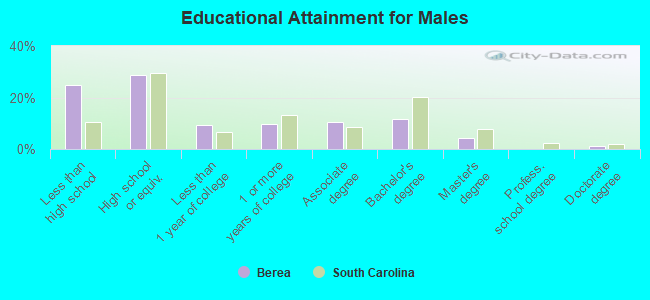
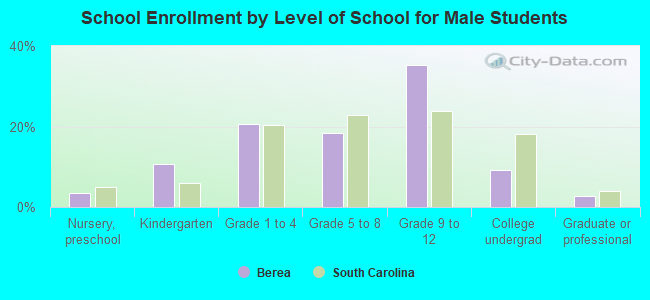
Education attainment for males 25 years and older:
No schooling: 309Nursery to 4th grade: 675th and 6th grade: 1847th and 8th grade: 959th grade: 14810th grade: 13211th grade: 14812th grade, no diploma: 250High school graduate (or equivalency): 1,536Less than 1 year of college: 497Some college more than 1 year, no degree: 508Associate degree: 555Bachelor's degree: 612Master's degree: 219Professional school degree: 9Doctorate degree: 60
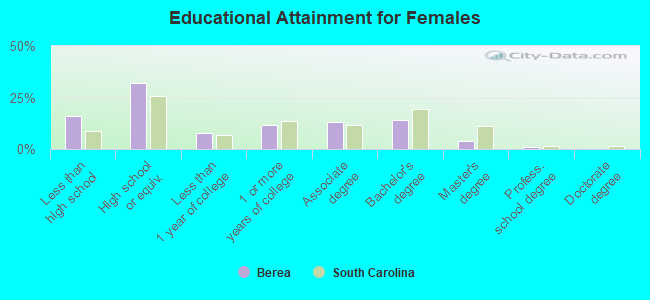
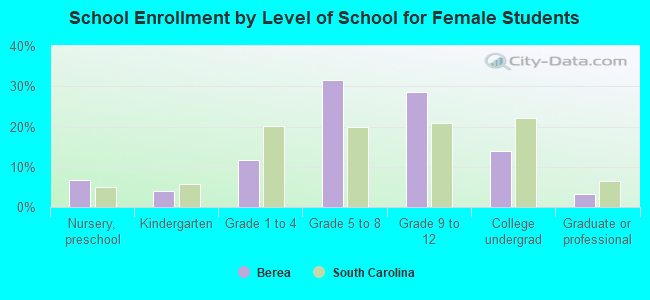
Education attainment for females 25 years and older:
No schooling: 184Nursery to 4th grade: 325th and 6th grade: 257th and 8th grade: 519th grade: 18910th grade: 16411th grade: 17612th grade, no diploma: 85High school graduate (or equivalency): 1,838Less than 1 year of college: 438Some college more than 1 year, no degree: 678Associate degree: 762Bachelor's degree: 807Master's degree: 234Professional school degree: 56Doctorate degree: 8
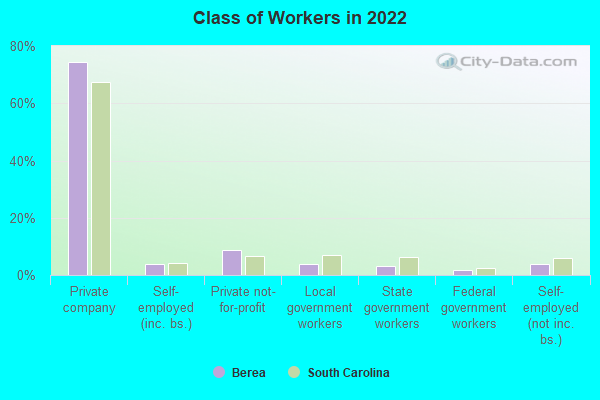
Housing units in structures:
One, detached: 3,981One, attached: 203Two: 2833 or 4: 3105 to 9: 86310 to 19: 28920 to 49: 18350 or more: 97Mobile homes: 617Median worth of mobile homes: $31,767
Housing units lacking complete plumbing facilities in 2022: 0.4%Housing units lacking complete kitchen facilities in 2022: 1.5%House/condo owner moved in on average 13 years ago
Renter moved in on average 4 years ago
Private vs. public school enrollment:
Students in private schools in grades 1 to 8 (elementary and middle school): 202 Here:
16.1%South Carolina:
14.4%
Students in private schools in grades 9 to 12 (high school): 84 Here:
8.6%South Carolina:
11.1%
Students in private undergraduate colleges: 43 Here:
11.7%South Carolina:
21.9%