Billings, MT (Montana) Houses and Residents
Estimated median house or condo value in 2022: $323,900 (it was $96,700 in 2000 )
Billings:
$323,900Montana:
$366,400
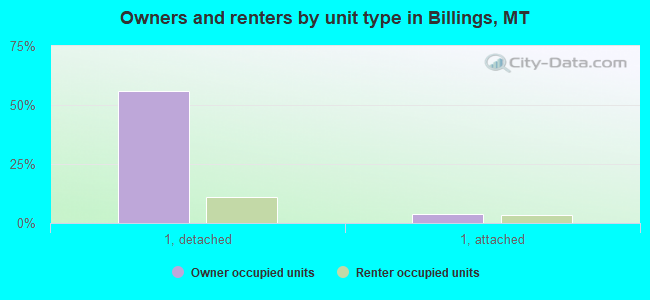
Lower value quartile - upper value quartile: $246,200 - $418,400Mean price in 2022: Detached houses: $437,752 Here:
$437,752State:
$518,333
Townhouses or other attached units: $223,352 Here:
$223,352State:
$468,033
In 2-unit structures: $226,449 Here:
$226,449State:
$254,784
In 3-to-4-unit structures: $269,464 Here:
$269,464State:
$383,074
Mobile homes: $81,122 Here:
$81,122State:
$139,111
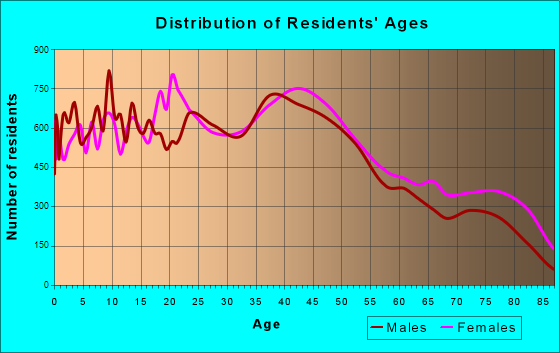
Total population: 108,869 (Urban population: 89,301, Rural population: 61 (all nonfarm) )
Houses: 54,818 (51,174 occupied: 33,475 owner occupied, 17,699 renter occupied )
% of renters here:
35%State:
31%
Housing density: 1,626 houses/condos per square mile
Median price asked for vacant for-sale houses and condos in 2022: $183,387.
Median contract rent in 2022: $981 (lower quartile is $725, upper quartile is $1,274)
Median rent asked for vacant for-rent units in 2022: $2,092
Median gross rent in Billings, MT in 2022: $1,085
Housing units in Billings with a mortgage: 19,004 (2,069 second mortgage, 64 home equity loan, 1,351 both second mortgage and home equity loan )Houses without a mortgage: 651
Median household income for houses/condos with a mortgage: $102,165
Median household income for apartments without a mortgage: $76,867
Median monthly housing costs: $1,075
Data:
Median house or condo value ($)
Median house or condo value ($ change since 2000)
Median house or condo value ($) - White
Median house or condo value ($) - Black or African American
Median house or condo value ($) - Asian
Median house or condo value ($) - Hispanic or Latino
Median house or condo value ($) - American Indian and Alaska Native
Median house or condo value ($) - Multirace
Median house or condo value ($) - Other Race
Median price asked for mobile homes ($)
Household density (households per square mile)
Mean house or condo value by units in structure - 1, detached ($)
Mean house or condo value by units in structure - 1, attached ($)
Mean house or condo value by units in structure - 2 ($)
Mean house or condo value by units in structure by units in structure - 3 or 4 ($)
Mean house or condo value by units in structure - 5 or more ($)
Mean house or condo value by units in structure - Boat, RV, van, etc. ($)
Mean house or condo value by units in structure - Mobile home ($)
Median contract rent ($)
Median contract rent - Lower quartile ($)
Median contract rent - Upper quartile ($)
Median gross rent ($)
Urban houses (%)
Rural houses (%)
Houses occupied (%)
Houses occupied (% change since 2000)
Houses owner occupied (%)
Houses owner occupied (% change since 2000)
Houses renter occupied (%)
Houses renter occupied (% change since 2000)
Vacant housing units - For rent (%)
Vacant housing units - For rent (% change since 2000)
Vacant housing units - For sale only (%)
Vacant housing units - For sale only (% change since 2000)
Vacant housing units - Rented or sold, not occupied (%)
Vacant housing units - Rented or sold, not occupied (% change since 2000)
Vacant housing units - For seasonal, recreational, or occasional use (%)
Vacant housing units - For seasonal, recreational, or occasional use (% change since 2000)
Vacant housing units - For migrant workers (%)
Vacant housing units - For migrant workers (% change since 2000)
Vacant housing units - Other vacant (%)
Vacant housing units - Other vacant (% change since 2000)
Median monthly housing costs ($)
Median household income for houses/condos with a mortgage ($)
Median household income for houses/condos without a mortgage ($)
Median household income ($)
Median household income ($) - White
Median household income ($) - Black or African American
Median household income ($) - Asian
Median household income ($) - Hispanic or Latino
Median household income ($) - American Indian and Alaska Native
Median household income ($) - Multirace
Median household income ($) - Other Race
Mortgage status - with mortgage (%)
Mortgage status - with second mortgage (%)
Mortgage status - with home equity loan (%)
Mortgage status - with both second mortgage and home equity loan (%)
Mortgage status - without a mortgage (%)
Median year house/condo built
Median year apartment built
Household type by relationship - Male householder living alone (%)
Household type by relationship - Male householder not living alone (%)
Household type by relationship - Female householder living alone (%)
Household type by relationship - Female householder not living alone (%)
Household type by relationship - Opposite-Sex spouse (%)
Household type by relationship - Same-Sex spouse (%)
Household type by relationship - Opposite-Sex unmarried partner (%)
Household type by relationship - Same-Sex unmarried partner (%)
Household type by relationship - In group quarters (%)
Size of family households - 2-person household (%)
Size of family households - 3-person household (%)
Size of family households - 4-person household (%)
Size of family households - 5-person household (%)
Size of family households - 6-person household (%)
Size of family households - 7-or-more-person household (%)
Size of nonfamily households - 1-person household (%)
Size of nonfamily households - 2-person household (%)
Size of nonfamily households - 3-person household (%)
Size of nonfamily households - 4-person household (%)
Size of nonfamily households - 5-person household (%)
Size of nonfamily households - 6-person household (%)
Size of nonfamily households - 7-or-moreperson household (%)
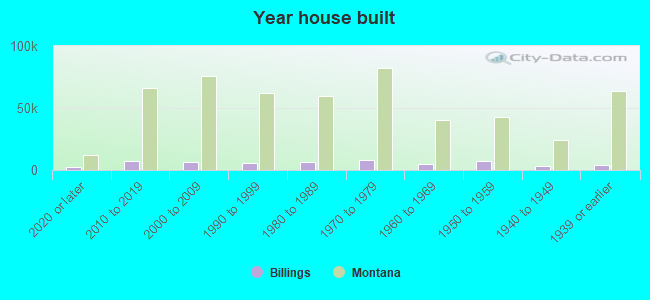
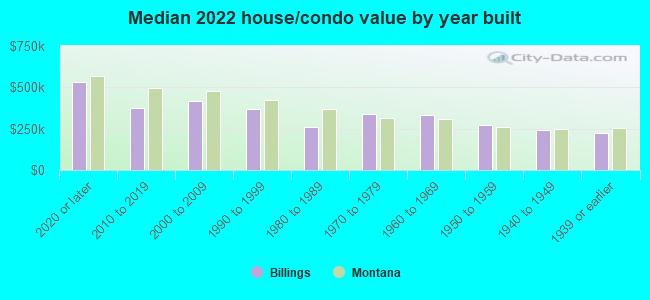
Year house built - Built 2010 or later (%)
Year house built - Built 2000 to 2009 (%)
Year house built - Built 1990 to 1999 (%)
Year house built - Built 1980 to 1989 (%)
Year house built - Built 1970 to 1979 (%)
Year house built - Built 1960 to 1969 (%)
Year house built - Built 1950 to 1959 (%)
Year house built - Built 1940 to 1949 (%)
Year house built - Built 1939 or earlier (%)
Median number of rooms in houses and condos
Median number of rooms in apartments
Median number of bedrooms in owner occupied houses
Mean number of bedrooms in owner occupied houses
Median number of bedrooms in renter occupied houses
Mean number of bedrooms in renter occupied houses
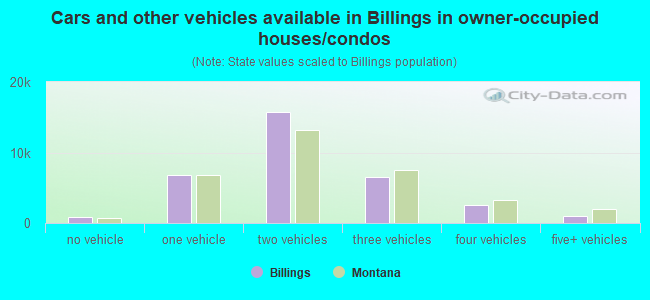
Median number of vehichles in owner occupied houses
Mean number of vehichles in owner occupied houses
Median number of vehichles in renter occupied houses
Mean number of vehichles in renter occupied houses
Rooms in owner-occupied houses - 1 room (%)
Rooms in owner-occupied houses - 2 rooms (%)
Rooms in owner-occupied houses - 3 rooms (%)
Rooms in owner-occupied houses - 4 rooms (%)
Rooms in owner-occupied houses - 5 rooms (%)
Rooms in owner-occupied houses - 6 rooms (%)
Rooms in owner-occupied houses - 7 rooms (%)
Rooms in owner-occupied houses - 8 rooms (%)
Rooms in owner-occupied houses - 9+ rooms (%)
Rooms in renter-occupied houses - 1 room (%)
Rooms in renter-occupied houses - 2 rooms (%)
Rooms in renter-occupied houses - 3 rooms (%)
Rooms in renter-occupied houses - 4 rooms (%)
Rooms in renter-occupied houses - 5 rooms (%)
Rooms in renter-occupied houses - 6 rooms (%)
Rooms in renter-occupied houses - 7 rooms (%)
Rooms in renter-occupied houses - 8 rooms (%)
Rooms in renter-occupied houses - 9+ rooms (%)
Bedrooms in owner-occupied houses - no bedrooms (%)
Bedrooms in owner-occupied houses - 1 bedroom (%)
Bedrooms in owner-occupied houses - 2 bedrooms (%)
Bedrooms in owner-occupied houses - 3 bedrooms (%)
Bedrooms in owner-occupied houses - 4 bedrooms (%)
Bedrooms in owner-occupied houses - 5+ bedrooms (%)
Bedrooms in renter-occupied houses - no bedrooms (%)
Bedrooms in renter-occupied houses - 1 bedroom (%)
Bedrooms in renter-occupied houses - 2 bedrooms (%)
Bedrooms in renter-occupied houses - 3 bedrooms (%)
Bedrooms in renter-occupied houses - 4 bedrooms (%)
Bedrooms in renter-occupied houses - 5+ bedrooms (%)
Vehicles available in owner-occupied houses - no vehicle available (%)
Vehicles available in owner-occupied houses - 1 vehicle available(%)
Vehicles available in owner-occupied houses - 2 Vehicles available (%)
Vehicles available in owner-occupied houses - 3 Vehicles available (%)
Vehicles available in owner-occupied houses - 4 Vehicles available (%)
Vehicles available in owner-occupied houses - 5+ Vehicles available (%)
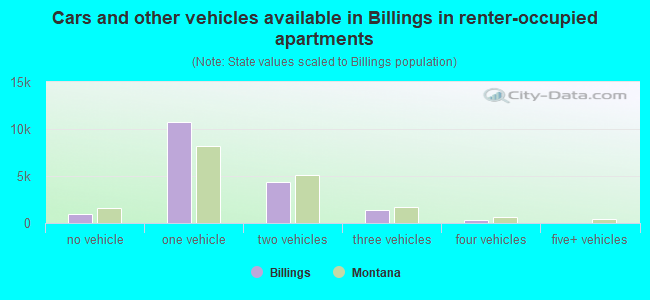
Vehicles available in renter-occupied houses - no vehicle available (%)
Vehicles available in renter-occupied houses - 1 vehicle available (%)
Vehicles available in renter-occupied houses - 2 Vehicles available (%)
Vehicles available in renter-occupied houses - 3 Vehicles available (%)
Vehicles available in renter-occupied houses - 4 Vehicles available (%)
Vehicles available in renter-occupied houses - 5+ Vehicles available (%)
Housing units in structures - 1, detached (%)
Housing units in structures - 1, attached (%)
Housing units in structures - 2 (%)
Housing units in structures - 3 or 4 (%)
Housing units in structures - 5 to 9 (%)
Housing units in structures - 10 to 19 (%)
Housing units in structures - 20 to 49 (%)
Housing units in structures - 50 or more (%)
Housing units in structures - Mobile home (%)
Housing units in structures - Boat, RV, van, etc. (%)
Housing units in structures - Owners - 1, detached (%)
Housing units in structures - Owners - 1, attached (%)
Housing units in structures - Owners - 2 (%)
Housing units in structures - Owners - 3 or 4 (%)
Housing units in structures - Owners - 5 to 9 (%)
Housing units in structures - Owners - 10 to 19 (%)
Housing units in structures - Owners - 20 to 49 (%)
Housing units in structures - Owners - 50 or more (%)
Housing units in structures - Owners - Mobile home (%)
Housing units in structures - Owners - Boat, RV, van, etc. (%)
Housing units in structures - Renters - 1, detached (%)
Housing units in structures - Renters - 1, attached (%)
Housing units in structures - Renters - 2 (%)
Housing units in structures - Renters - 3 or 4 (%)
Housing units in structures - Renters - 5 to 9 (%)
Housing units in structures - Renters - 10 to 19 (%)
Housing units in structures - Renters - 20 to 49 (%)
Housing units in structures - Renters - 50 or more (%)
Housing units in structures - Renters - Mobile home (%)
Housing units in structures - Renters - Boat, RV, van, etc. (%)
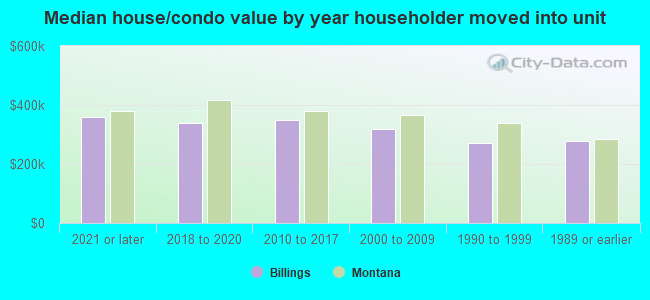
House/condo owner moved in on average (years ago)
Renter moved in on average (years ago)
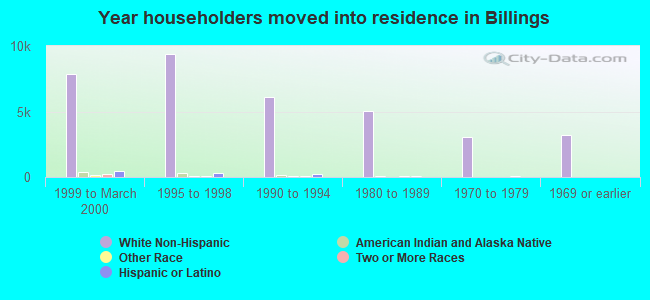
Year householder moved into unit - Moved in 1999 to March 2000 (%)
Year householder moved into unit - Moved in 1999 to March 2000 (%) - White
Year householder moved into unit - Moved in 1999 to March 2000 (%) - Black or African American
Year householder moved into unit - Moved in 1999 to March 2000 (%) - Asian
Year householder moved into unit - Moved in 1999 to March 2000 (%) - Hispanic or Latino
Year householder moved into unit - Moved in 1999 to March 2000 (%) - American Indian and Alaska Native
Year householder moved into unit - Moved in 1999 to March 2000 (%) - Multirace
Year householder moved into unit - Moved in 1999 to March 2000 (%) - Other Race
Year householder moved into unit - Moved in 1995 to 1998 (%)
Year householder moved into unit - Moved in 1995 to 1998 (%) - White
Year householder moved into unit - Moved in 1995 to 1998 (%) - Black or African American
Year householder moved into unit - Moved in 1995 to 1998 (%) - Asian
Year householder moved into unit - Moved in 1995 to 1998 (%) - Hispanic or Latino
Year householder moved into unit - Moved in 1995 to 1998 (%) - American Indian and Alaska Native
Year householder moved into unit - Moved in 1995 to 1998 (%) - Multirace
Year householder moved into unit - Moved in 1995 to 1998 (%) - Other Race
Year householder moved into unit - Moved in 1990 to 1994 (%)
Year householder moved into unit - Moved in 1990 to 1994 (%) - White
Year householder moved into unit - Moved in 1990 to 1994 (%) - Black or African American
Year householder moved into unit - Moved in 1990 to 1994 (%) - Asian
Year householder moved into unit - Moved in 1990 to 1994 (%) - Hispanic or Latino
Year householder moved into unit - Moved in 1990 to 1994 (%) - American Indian and Alaska Native
Year householder moved into unit - Moved in 1990 to 1994 (%) - Multirace
Year householder moved into unit - Moved in 1990 to 1994 (%) - Other Race
Year householder moved into unit - Moved in 1980 to 1989 (%)
Year householder moved into unit - Moved in 1980 to 1989 (%) - White
Year householder moved into unit - Moved in 1980 to 1989 (%) - Black or African American
Year householder moved into unit - Moved in 1980 to 1989 (%) - Asian
Year householder moved into unit - Moved in 1980 to 1989 (%) - Hispanic or Latino
Year householder moved into unit - Moved in 1980 to 1989 (%) - American Indian and Alaska Native
Year householder moved into unit - Moved in 1980 to 1989 (%) - Multirace
Year householder moved into unit - Moved in 1980 to 1989 (%) - Other Race
Year householder moved into unit - Moved in 1970 to 1979 (%)
Year householder moved into unit - Moved in 1970 to 1979 (%) - White
Year householder moved into unit - Moved in 1970 to 1979 (%) - Black or African American
Year householder moved into unit - Moved in 1970 to 1979 (%) - Asian
Year householder moved into unit - Moved in 1970 to 1979 (%) - Hispanic or Latino
Year householder moved into unit - Moved in 1970 to 1979 (%) - American Indian and Alaska Native
Year householder moved into unit - Moved in 1970 to 1979 (%) - Multirace
Year householder moved into unit - Moved in 1970 to 1979 (%) - Other Race
Year householder moved into unit - Moved in 1969 or earlier (%)
Year householder moved into unit - Moved in 1969 or earlier (%) - White
Year householder moved into unit - Moved in 1969 or earlier (%) - Black or African American
Year householder moved into unit - Moved in 1969 or earlier (%) - Asian
Year householder moved into unit - Moved in 1969 or earlier (%) - Hispanic or Latino
Year householder moved into unit - Moved in 1969 or earlier (%) - American Indian and Alaska Native
Year householder moved into unit - Moved in 1969 or earlier (%) - Multirace
Year householder moved into unit - Moved in 1969 or earlier (%) - Other Race
Housing units lacking complete plumbing facilities (%)
Housing units lacking complete kitchen facilities (%)
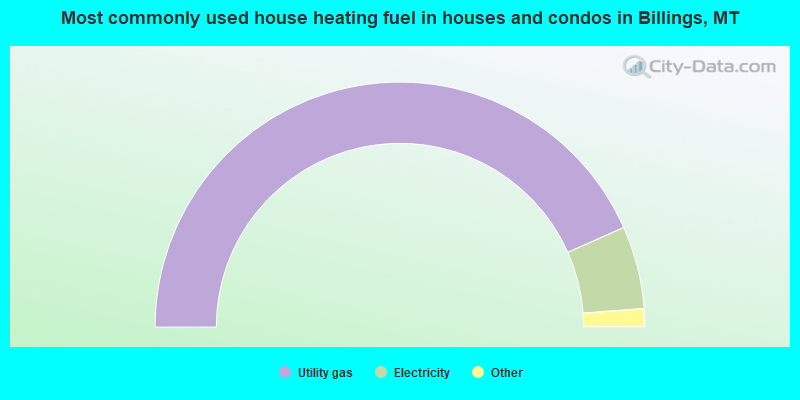
House heating fuel used in houses and condos - Utility gas (%)
House heating fuel used in houses and condos - Bottled, tank, or LP gas (%)
House heating fuel used in houses and condos - Electricity (%)
House heating fuel used in houses and condos - Fuel oil, kerosene, etc. (%)
House heating fuel used in houses and condos - Coal or coke (%)
House heating fuel used in houses and condos - Wood (%)
House heating fuel used in houses and condos - Solar energy (%)
House heating fuel used in houses and condos - Other fuel (%)
House heating fuel used in houses and condos - No fuel used (%)
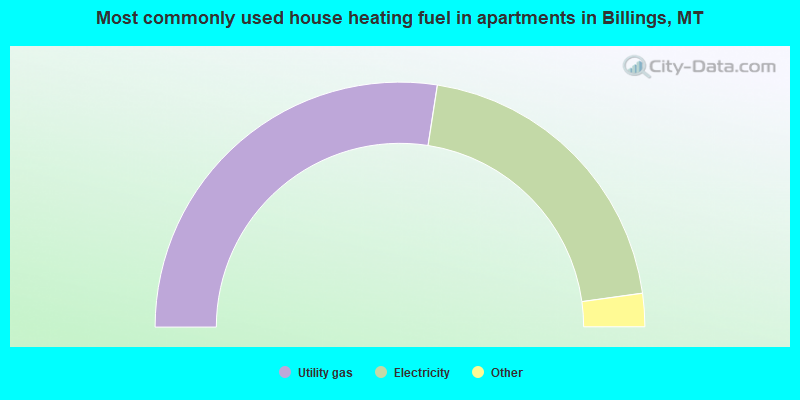
House heating fuel used in apartments - Utility gas (%)
House heating fuel used in apartments - Bottled, tank, or LP gas (%)
House heating fuel used in apartments - Electricity (%)
House heating fuel used in apartments - Fuel oil, kerosene, etc. (%)
House heating fuel used in apartments - Coal or coke (%)
House heating fuel used in apartments - Wood (%)
House heating fuel used in apartments - Solar energy (%)
House heating fuel used in apartments - Other fuel (%)
House heating fuel used in apartments - No fuel used (%)
Latest news about housing in Billings, MT collected exclusively by city-data.com from local newspapers, TV, and radio stations
Median year house/condo built: 1982Median year apartment built: 1979Household type by relationship:
Households: 119,969
Male householders: 23,482 (7,107 living alone ), Female householders: 27,692 (8,555 living alone )22,916 spouses (22,775 opposite-sex spouses ), 5,229 unmarried partners , (5,175 opposite-sex unmarried partners ), 28,538 children (26,734 natural , 906 adopted , 898 stepchildren ), 2,474 grandchildren , 793 brothers or sisters , 476 parents , 106 foster children , 938 other relatives , 4,214 non-relatives In group quarters: 3,111
Size of family households: 13,691 2-persons , 4,928 3-persons , 6,156 4-persons , 2,184 5-persons , 1,197 6-persons , 1,045 7-or-more-persons .
Size of nonfamily households: 15,662 1-person , 4,928 2-persons , 737 3-persons , 464 4-persons , 182 5-persons .
16,432 married couples with children. single-parent households (2,787 men , 3,320 women ).
95.8% of residents of Billings speak English at home. of residents speak Spanish at home (76% speak English very well , 13% speak English well , 10% speak English not well , 1% don't speak English at all ).of residents speak other Indo-European language at home (78% speak English very well , 16% speak English well , 3% speak English not well , 3% don't speak English at all ).of residents speak Asian or Pacific Island language at home (76% speak English very well , 6% speak English well , 12% speak English not well , 5% don't speak English at all ).of residents speak other language at home (91% speak English very well , 4% speak English well , 5% speak English not well ).
Foreign born population: 2,698 (2.2%)of them are naturalized citizens )
Median number of rooms in houses and condos:
Median number of rooms in apartments
Owner-occupied Renter-occupied
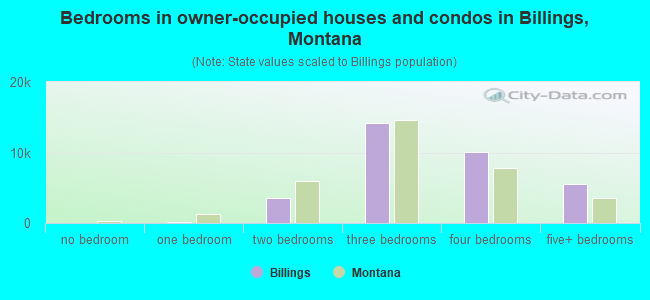
Bedrooms in owner-occupied houses and condos in Billings, Montana
0 no bedroom 171 1 bedroom 3,530 2 bedrooms 14,169 3 bedrooms 10,132 4 bedrooms 5,473 5+ bedrooms
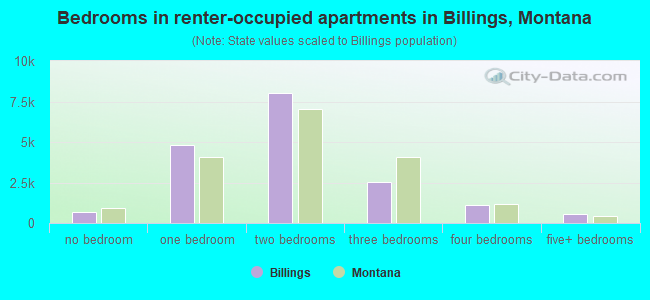
Bedrooms in renter-occupied apartments in Billings, Montana
681 no bedroom 4,829 1 bedroom 7,994 2 bedrooms 2,556 3 bedrooms 1,109 4 bedrooms 530 5+ bedrooms
Owner-occupied Renter-occupied
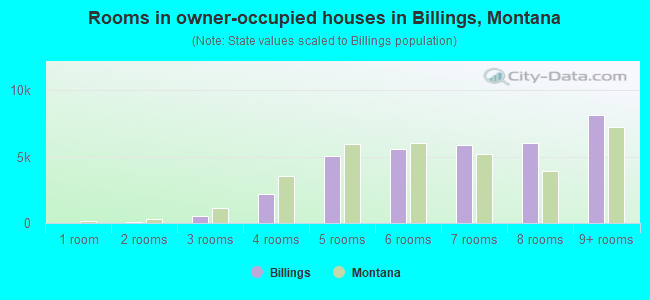
Rooms in owner-occupied houses in Billings, Montana
0 1 room 63 2 rooms 511 3 rooms 2,210 4 rooms 5,079 5 rooms 5,599 6 rooms 5,879 7 rooms 5,996 8 rooms 8,138 9+ rooms
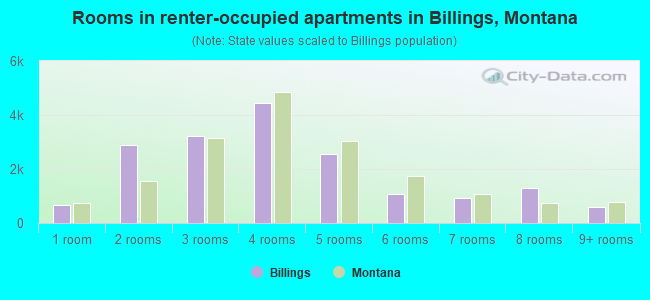
Rooms in renter-occupied apartments in Billings, Montana
681 1 room 2,898 2 rooms 3,209 3 rooms 4,449 4 rooms 2,567 5 rooms 1,068 6 rooms 909 7 rooms 1,308 8 rooms 610 9+ rooms
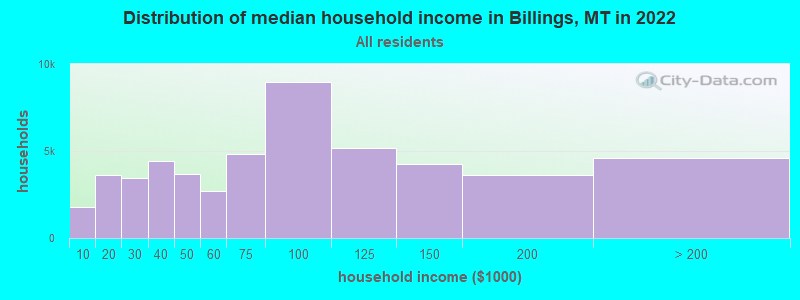
Billings, MT household income distribution 1,765 Less than $10,0003,605 $10,000 to $19,9993,448 $20,000 to $29,9994,451 $30,000 to $39,9993,692 $40,000 to $49,9992,704 $50,000 to $59,9994,821 $60,000 to $74,9998,991 $75,000 to $99,9995,192 $100,000 to $124,9994,275 $125,000 to $149,9993,641 $150,000 to $199,9994,589 $200,000 or more
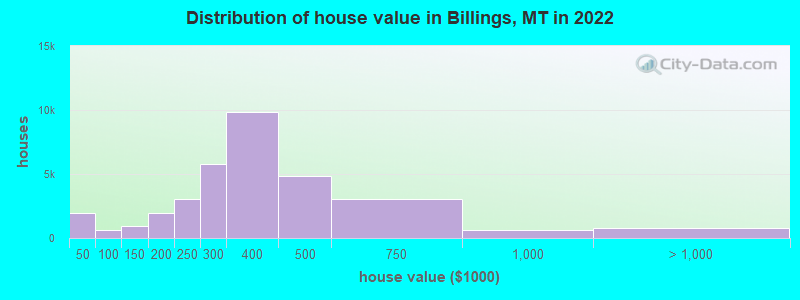
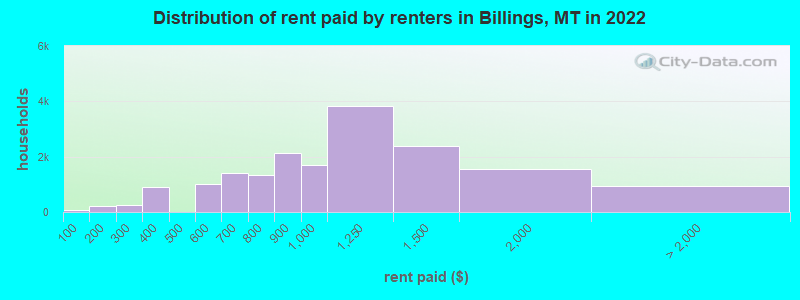
Home value of owner - occupied houses in 2022 in Billings, MT 96 Less than $10,000257 $10,000 to $14,999634 $15,000 to $19,999456 $20,000 to $24,999142 $25,000 to $29,999156 $30,000 to $34,999233 $35,000 to $39,999277 $60,000 to $69,999374 $70,000 to $79,999510 $100,000 to $124,999446 $125,000 to $149,9991,270 $150,000 to $174,999710 $175,000 to $199,9993,040 $200,000 to $249,9995,786 $250,000 to $299,9999,828 $300,000 to $399,9994,832 $400,000 to $499,9993,069 $500,000 to $749,999601 $750,000 to $999,999260 $1,000,000 to $1,499,99983 $1,500,000 to $1,999,999415 $2,000,000 or moreRent paid by renters in 2022 in Billings, MT 65 Less than $100204 $150 to $199136 $200 to $249128 $250 to $299474 $300 to $349430 $350 to $399222 $500 to $549783 $550 to $599390 $600 to $6491,035 $650 to $699971 $700 to $749369 $750 to $7992,134 $800 to $8991,689 $900 to $9993,821 $1,000 to $1,2492,374 $1,250 to $1,4991,541 $1,500 to $1,999238 $2,000 to $2,499103 $2,500 to $2,99982 $3,000 to $3,499244 $3,500 or more266 No cash rent
Percentage of workers working in this county: 98.5%Number of people working at home: 4,241 (6.6% of all workers )
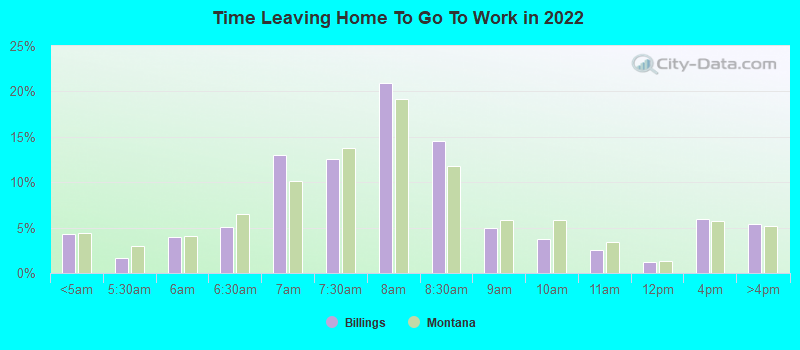
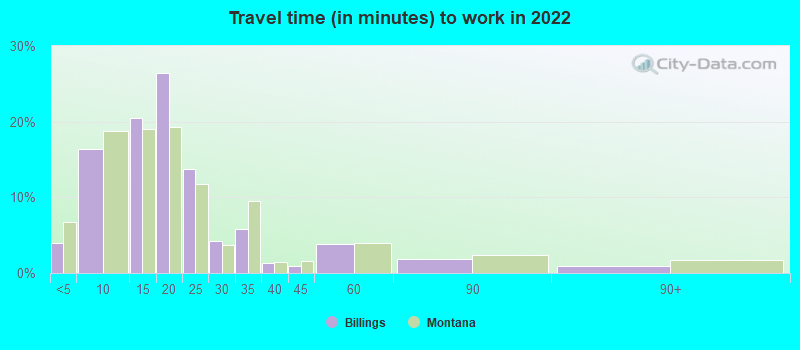
Travel time to work (commute)
Less than 5 minutes: 3,0275 to 9 minutes: 11,74410 to 14 minutes: 13,62415 to 19 minutes: 17,24020 to 24 minutes: 7,41925 to 29 minutes: 1,26730 to 34 minutes: 3,31935 to 39 minutes: 34340 to 44 minutes: 33645 to 59 minutes: 84360 to 89 minutes: 46190 or more minutes: 477
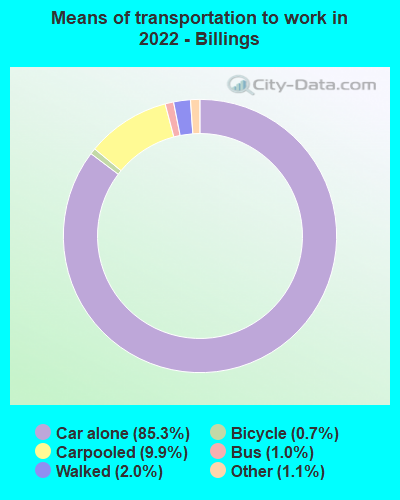
Means of transportation to work:
Drove a car alone: 54,808 (74.7%)Carpooled: 10,787 (14.7%)Bus : 542 (0.7%)Subway or elevated rail : 17 (0.0%)Taxi: 1,115 (1.5%)Bicycle: 625 (0.9%)Walked: 1,109 (1.5%)Worked at home: 4,132 (5.6%)
Unemployment by race in 2022
Unemployment rate for White non-Hispanic residents 3.0% Males1.2% FemalesUnemployment rate for Black residents 3.7% Males20.6% FemalesUnemployment rate for American Indian and Alaska Native residents 11.5% Males1.9% FemalesUnemployment rate for Asian residents 21.3% Males0.2% FemalesUnemployment rate for other race residents 7.8% Males0.6% FemalesUnemployment rate for two or more race residents 3.6% Males4.1% FemalesUnemployment rate for Hispanic or Latino residents 6.0% Males6.3% Females
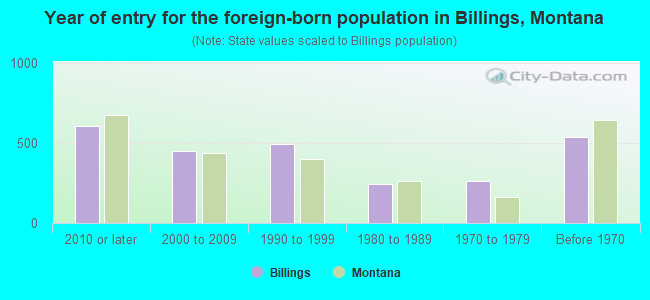
Year of entry for the foreign-born population in Billings, Montana
605 2010 or later 449 2000 to 2009 492 1990 to 1999 243 1980 to 1989 262 1970 to 1979 537 Before 1970
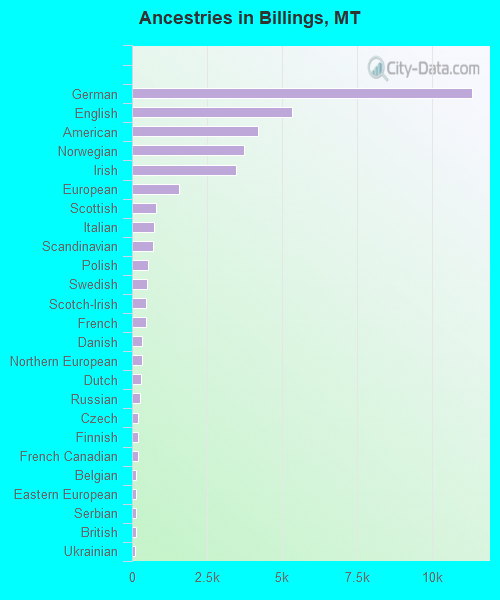
First ancestries reported:
German: 11,349 (22.4%)
English: 5,339 (10.5%)
American: 4,221 (8.3%)
Norwegian: 3,735 (7.4%)
Irish: 3,471 (6.9%)
European: 1,572 (3.1%)
Scottish: 791 (1.6%)
Italian: 725 (1.4%)
Scandinavian: 697 (1.4%)
Polish: 549 (1.1%)
Swedish: 485 (1.0%)
Scotch-Irish: 479 (0.9%)
French: 476 (0.9%)
Danish: 344 (0.7%)
Northern European: 324 (0.6%)
Dutch: 308 (0.6%)
Russian: 279 (0.6%)
Czech: 207 (0.4%)
Finnish: 202 (0.4%)
French Canadian: 194 (0.4%)
Belgian: 143 (0.3%)
Eastern European: 137 (0.3%)
Serbian: 127 (0.3%)
British: 122 (0.2%)
Ukrainian: 106 (0.2%)
Yugoslavian: 104 (0.2%)
Welsh: 98 (0.2%)
Canadian: 94 (0.2%)
Slovak: 65 (0.1%)
African: 56 (0.1%)
Swiss: 54 (0.1%)
Greek: 52 (0.1%)
Portuguese: 38 (0.08%)
Arab: 35 (0.07%)
Iranian: 27 (0.05%)
Lithuanian: 25 (0.05%)
Austrian: 25 (0.05%)
Romanian: 23 (0.05%)
Czechoslovakian: 22 (0.04%)
Jamaican: 21 (0.04%)
Luxembourger: 19 (0.04%)
Bulgarian: 19 (0.04%)
Australian: 19 (0.04%)
Brazilian: 18 (0.04%)
Hungarian: 17 (0.03%)
Ethiopian: 9 (0.02%)
Basque: 7 (0.01%)
Slavic: 5 (0.01%)
Latvian: 4 (0.01%)
Albanian: 3 (0.01%)
Most common places of birth for foreign-born residents (%): Vietnam Billings:
12.7% (307)Montana:
2.3% (578)
Canada Billings:
10.5% (253)Montana:
14.2% (3,503)
Germany Billings:
9.8% (238)Montana:
9.3% (2,310)
Mexico Billings:
9.4% (228)Montana:
10.6% (2,608)
Russia Billings:
4.5% (109)Montana:
1.7% (425)
United Kingdom, excluding England and Scotland Billings:
4.3% (104)Montana:
3.0% (738)
Saudi Arabia Billings:
3.1% (75)Montana:
0.9% (231)
China, excluding Hong Kong and Taiwan Billings:
2.8% (67)Montana:
4.8% (1,184)
Philippines Billings:
2.7% (65)Montana:
7.0% (1,735)
Korea Billings:
2.3% (56)Montana:
2.7% (666)
Australia Billings:
2.2% (53)Montana:
1.0% (250)
Hong Kong Billings:
2.1% (52)Montana:
1.0% (244)
Peru Billings:
2.1% (51)Montana:
1.0% (240)
Japan Billings:
2.1% (51)Montana:
1.6% (385)
Ireland Billings:
2.0% (49)Montana:
0.4% (105)
Dominican Republic Billings:
1.7% (42)Montana:
0.4% (107)
Ukraine Billings:
1.7% (41)Montana:
2.3% (567)
India Billings:
1.7% (40)Montana:
1.7% (415)
Iraq Billings:
1.6% (39)Montana:
0.2% (50)
Other South Central Asia Billings:
1.6% (38)Montana:
0.3% (84)
Place of birth for U.S.-born residents:
This state: 69,925Other state: 46,061Northeast: 2,905Midwest: 14,728South: 7,106West: 21,322 82.1% of Billings residents lived in the same house 1 years ago.
Out of people who lived in different houses, 31.8% lived in this county.
Out of people who lived in different counties, 35.1% lived in Montana.
Billings:
82.1%State average:
86.7%
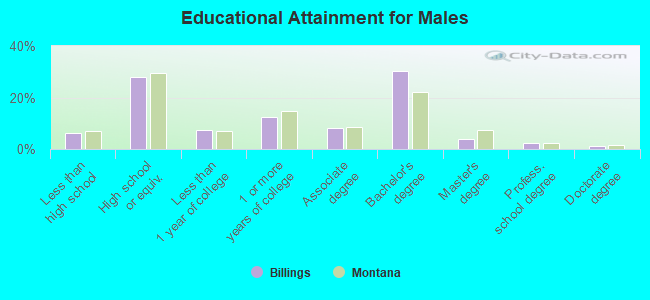
Education attainment for males 25 years and older:
No schooling: 349Nursery to 4th grade: 05th and 6th grade: 07th and 8th grade: 4899th grade: 52410th grade: 29011th grade: 42212th grade, no diploma: 493High school graduate (or equivalency): 11,333Less than 1 year of college: 2,933Some college more than 1 year, no degree: 4,972Associate degree: 3,326Bachelor's degree: 12,190Master's degree: 1,555Professional school degree: 1,017Doctorate degree: 403
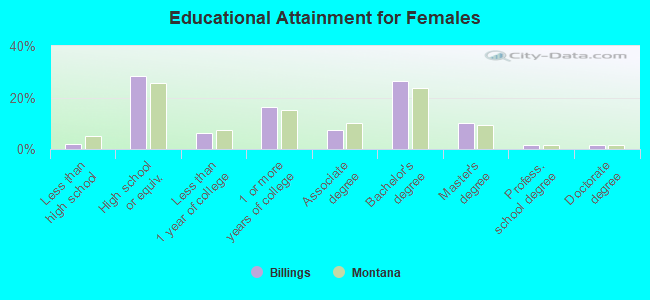
Education attainment for females 25 years and older:
No schooling: 78Nursery to 4th grade: 795th and 6th grade: 177th and 8th grade: 919th grade: 010th grade: 4711th grade: 35812th grade, no diploma: 222High school graduate (or equivalency): 12,249Less than 1 year of college: 2,687Some college more than 1 year, no degree: 7,056Associate degree: 3,161Bachelor's degree: 11,429Master's degree: 4,393Professional school degree: 713Doctorate degree: 641
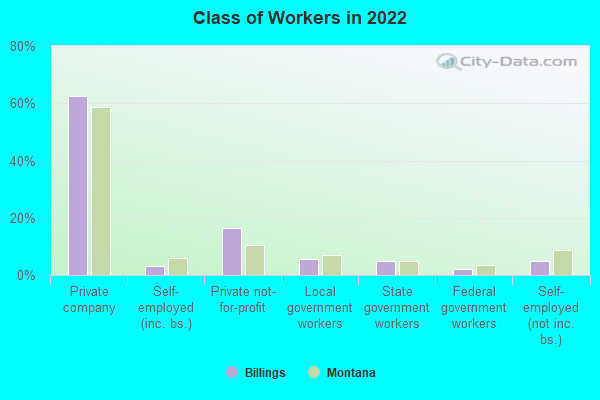
Housing units in structures:
One, detached: 36,581One, attached: 3,849Two: 1,3853 or 4: 2,8855 to 9: 2,20510 to 19: 1,81420 to 49: 86550 or more: 2,156Mobile homes: 3,078Median worth of mobile homes: $23,103
Housing units lacking complete plumbing facilities in 2022: 1.3%Housing units lacking complete kitchen facilities in 2022: 2.7%House/condo owner moved in on average 9 years ago
Renter moved in on average 2 years ago
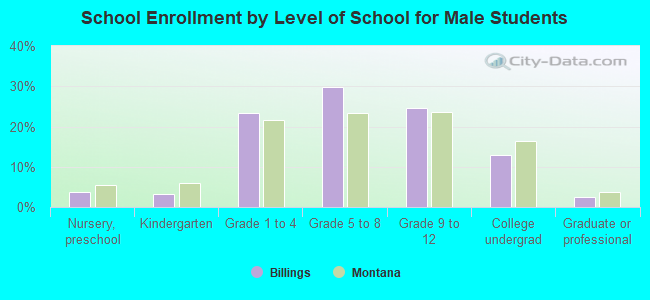
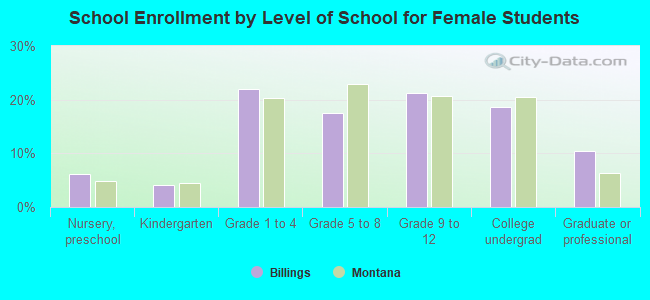
Private vs. public school enrollment:
Students in private schools in grades 1 to 8 (elementary and middle school): 1,484 Students in private schools in grades 9 to 12 (high school): 1,222 Students in private undergraduate colleges: 718