Bostonia, CA (California) Houses and Residents
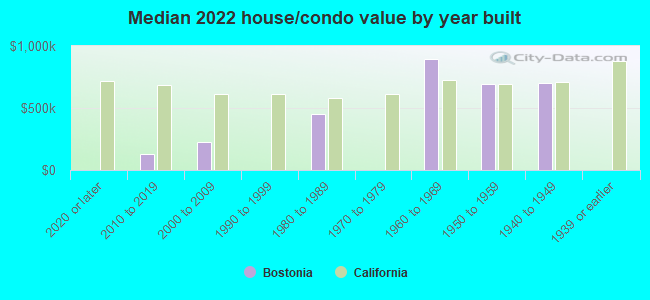
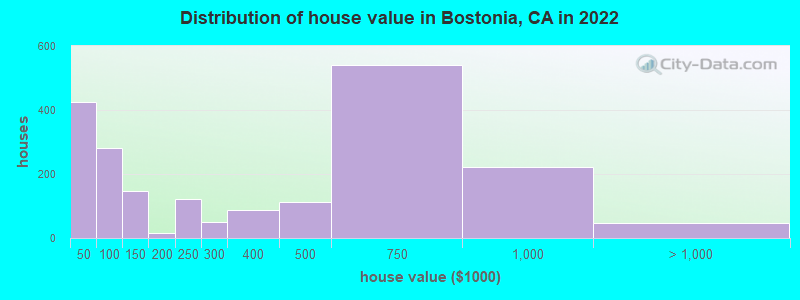
Estimated median house or condo value in 2022: $458,322 (it was $143,300 in 2000 )
Bostonia:
$458,322California:
$715,900
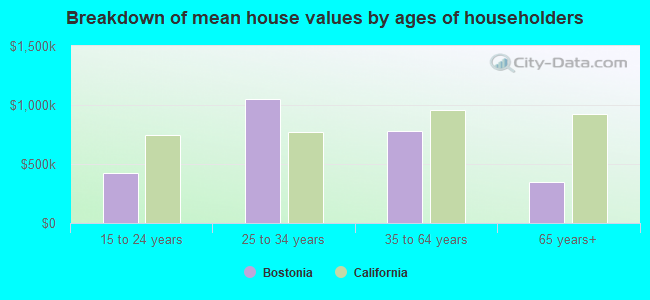
Lower value quartile - upper value quartile: $104,276 - $729,635Mean price in 2022: Detached houses: $699,135 Here:
$699,135State:
$988,808
Townhouses or other attached units: $371,641 Here:
$371,641State:
$838,546
In 3-to-4-unit structures: $373,486 Here:
$373,486State:
$824,253
In 5-or-more-unit structures: $5,112,411 Here:
$5,112,411State:
$730,996
Mobile homes: $75,093 Here:
$75,093State:
$184,506
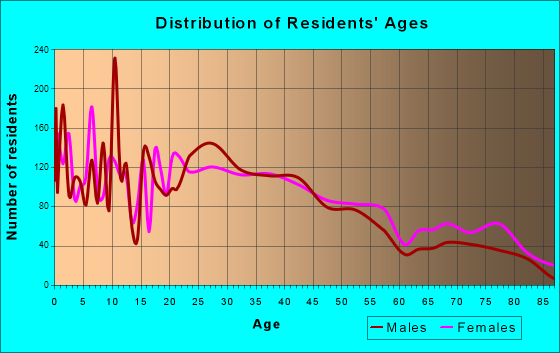
Total population: 15,379 (Urban population: 14,868, Rural population: 0)
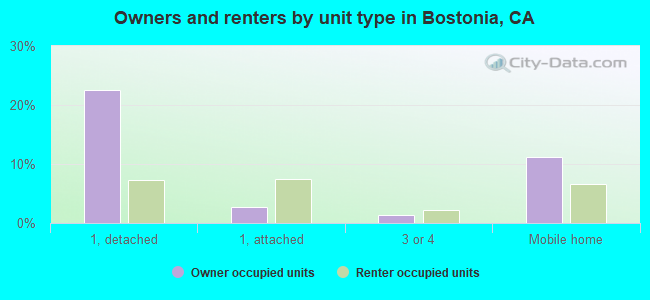
Houses: 6,016 (5,827 occupied: 2,298 owner occupied, 3,565 renter occupied )
% of renters here:
61%State:
44%
Housing density: 3,098 houses/condos per square mile
Median price asked for vacant for-sale houses and condos in 2022: $1,170,055.
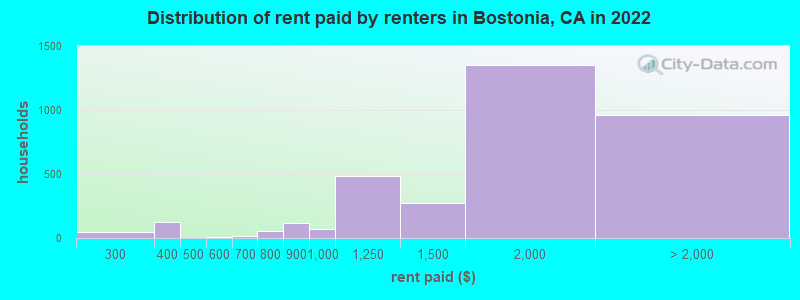
Median contract rent in 2022: $1,727 (lower quartile is $1,254, upper quartile is over $2,000)
Median rent asked for vacant for-rent units in 2022: $1,838
Median gross rent in Bostonia, CA in 2022: $1,832
Housing units in Bostonia with a mortgage: 1,158 (55 second mortgage, 0 home equity loan, 48 both second mortgage and home equity loan )Houses without a mortgage: 50
Median household income for houses/condos with a mortgage: $126,678
Median household income for apartments without a mortgage: $77,626
Median monthly housing costs: $1,699
Data:
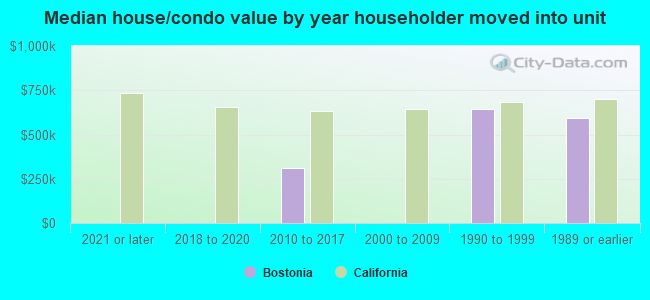
Median house or condo value ($)
Median house or condo value ($ change since 2000)
Median house or condo value ($) - White
Median house or condo value ($) - Black or African American
Median house or condo value ($) - Asian
Median house or condo value ($) - Hispanic or Latino
Median house or condo value ($) - American Indian and Alaska Native
Median house or condo value ($) - Multirace
Median house or condo value ($) - Other Race
Median price asked for mobile homes ($)
Household density (households per square mile)
Mean house or condo value by units in structure - 1, detached ($)
Mean house or condo value by units in structure - 1, attached ($)
Mean house or condo value by units in structure - 2 ($)
Mean house or condo value by units in structure by units in structure - 3 or 4 ($)
Mean house or condo value by units in structure - 5 or more ($)
Mean house or condo value by units in structure - Boat, RV, van, etc. ($)
Mean house or condo value by units in structure - Mobile home ($)
Median contract rent ($)
Median contract rent - Lower quartile ($)
Median contract rent - Upper quartile ($)
Median gross rent ($)
Urban houses (%)
Rural houses (%)
Houses occupied (%)
Houses occupied (% change since 2000)
Houses owner occupied (%)
Houses owner occupied (% change since 2000)
Houses renter occupied (%)
Houses renter occupied (% change since 2000)
Vacant housing units - For rent (%)
Vacant housing units - For rent (% change since 2000)
Vacant housing units - For sale only (%)
Vacant housing units - For sale only (% change since 2000)
Vacant housing units - Rented or sold, not occupied (%)
Vacant housing units - Rented or sold, not occupied (% change since 2000)
Vacant housing units - For seasonal, recreational, or occasional use (%)
Vacant housing units - For seasonal, recreational, or occasional use (% change since 2000)
Vacant housing units - For migrant workers (%)
Vacant housing units - For migrant workers (% change since 2000)
Vacant housing units - Other vacant (%)
Vacant housing units - Other vacant (% change since 2000)
Median monthly housing costs ($)
Median household income for houses/condos with a mortgage ($)
Median household income for houses/condos without a mortgage ($)
Median household income ($)
Median household income ($) - White
Median household income ($) - Black or African American
Median household income ($) - Asian
Median household income ($) - Hispanic or Latino
Median household income ($) - American Indian and Alaska Native
Median household income ($) - Multirace
Median household income ($) - Other Race
Mortgage status - with mortgage (%)
Mortgage status - with second mortgage (%)
Mortgage status - with home equity loan (%)
Mortgage status - with both second mortgage and home equity loan (%)
Mortgage status - without a mortgage (%)
Median year house/condo built
Median year apartment built
Household type by relationship - Male householder living alone (%)
Household type by relationship - Male householder not living alone (%)
Household type by relationship - Female householder living alone (%)
Household type by relationship - Female householder not living alone (%)
Household type by relationship - Opposite-Sex spouse (%)
Household type by relationship - Same-Sex spouse (%)
Household type by relationship - Opposite-Sex unmarried partner (%)
Household type by relationship - Same-Sex unmarried partner (%)
Household type by relationship - In group quarters (%)
Size of family households - 2-person household (%)
Size of family households - 3-person household (%)
Size of family households - 4-person household (%)
Size of family households - 5-person household (%)
Size of family households - 6-person household (%)
Size of family households - 7-or-more-person household (%)
Size of nonfamily households - 1-person household (%)
Size of nonfamily households - 2-person household (%)
Size of nonfamily households - 3-person household (%)
Size of nonfamily households - 4-person household (%)
Size of nonfamily households - 5-person household (%)
Size of nonfamily households - 6-person household (%)
Size of nonfamily households - 7-or-moreperson household (%)
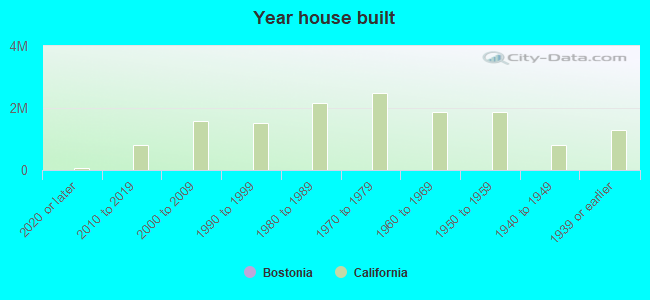
Year house built - Built 2010 or later (%)
Year house built - Built 2000 to 2009 (%)
Year house built - Built 1990 to 1999 (%)
Year house built - Built 1980 to 1989 (%)
Year house built - Built 1970 to 1979 (%)
Year house built - Built 1960 to 1969 (%)
Year house built - Built 1950 to 1959 (%)
Year house built - Built 1940 to 1949 (%)
Year house built - Built 1939 or earlier (%)
Median number of rooms in houses and condos
Median number of rooms in apartments
Median number of bedrooms in owner occupied houses
Mean number of bedrooms in owner occupied houses
Median number of bedrooms in renter occupied houses
Mean number of bedrooms in renter occupied houses
Median number of vehichles in owner occupied houses
Mean number of vehichles in owner occupied houses
Median number of vehichles in renter occupied houses
Mean number of vehichles in renter occupied houses
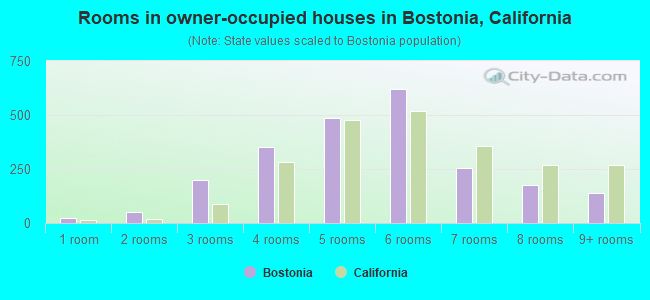
Rooms in owner-occupied houses - 1 room (%)
Rooms in owner-occupied houses - 2 rooms (%)
Rooms in owner-occupied houses - 3 rooms (%)
Rooms in owner-occupied houses - 4 rooms (%)
Rooms in owner-occupied houses - 5 rooms (%)
Rooms in owner-occupied houses - 6 rooms (%)
Rooms in owner-occupied houses - 7 rooms (%)
Rooms in owner-occupied houses - 8 rooms (%)
Rooms in owner-occupied houses - 9+ rooms (%)
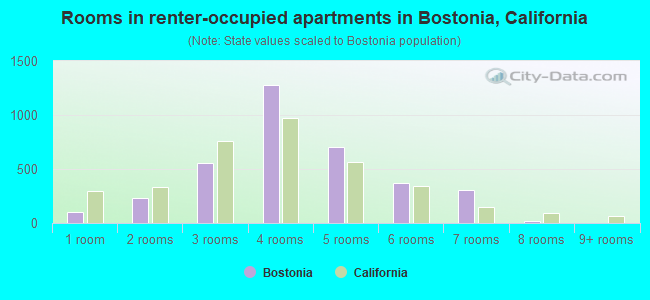
Rooms in renter-occupied houses - 1 room (%)
Rooms in renter-occupied houses - 2 rooms (%)
Rooms in renter-occupied houses - 3 rooms (%)
Rooms in renter-occupied houses - 4 rooms (%)
Rooms in renter-occupied houses - 5 rooms (%)
Rooms in renter-occupied houses - 6 rooms (%)
Rooms in renter-occupied houses - 7 rooms (%)
Rooms in renter-occupied houses - 8 rooms (%)
Rooms in renter-occupied houses - 9+ rooms (%)
Bedrooms in owner-occupied houses - no bedrooms (%)
Bedrooms in owner-occupied houses - 1 bedroom (%)
Bedrooms in owner-occupied houses - 2 bedrooms (%)
Bedrooms in owner-occupied houses - 3 bedrooms (%)
Bedrooms in owner-occupied houses - 4 bedrooms (%)
Bedrooms in owner-occupied houses - 5+ bedrooms (%)
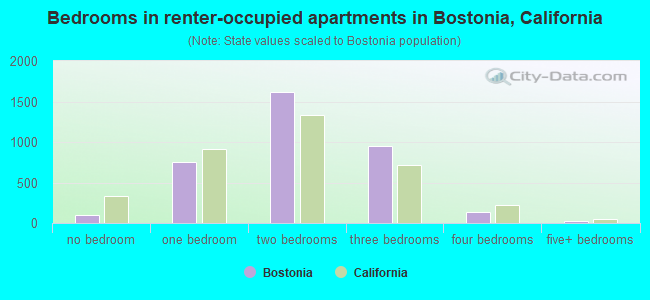
Bedrooms in renter-occupied houses - no bedrooms (%)
Bedrooms in renter-occupied houses - 1 bedroom (%)
Bedrooms in renter-occupied houses - 2 bedrooms (%)
Bedrooms in renter-occupied houses - 3 bedrooms (%)
Bedrooms in renter-occupied houses - 4 bedrooms (%)
Bedrooms in renter-occupied houses - 5+ bedrooms (%)
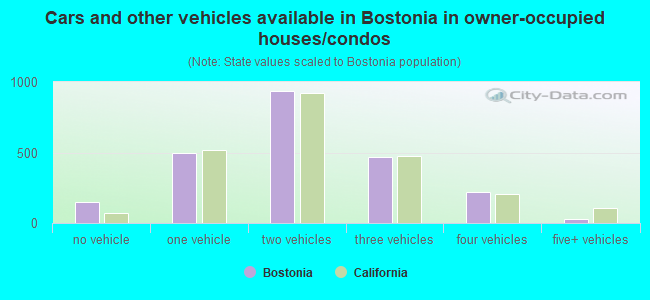
Vehicles available in owner-occupied houses - no vehicle available (%)
Vehicles available in owner-occupied houses - 1 vehicle available(%)
Vehicles available in owner-occupied houses - 2 Vehicles available (%)
Vehicles available in owner-occupied houses - 3 Vehicles available (%)
Vehicles available in owner-occupied houses - 4 Vehicles available (%)
Vehicles available in owner-occupied houses - 5+ Vehicles available (%)
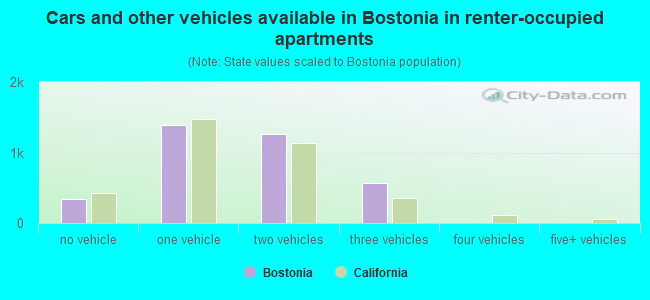
Vehicles available in renter-occupied houses - no vehicle available (%)
Vehicles available in renter-occupied houses - 1 vehicle available (%)
Vehicles available in renter-occupied houses - 2 Vehicles available (%)
Vehicles available in renter-occupied houses - 3 Vehicles available (%)
Vehicles available in renter-occupied houses - 4 Vehicles available (%)
Vehicles available in renter-occupied houses - 5+ Vehicles available (%)
Housing units in structures - 1, detached (%)
Housing units in structures - 1, attached (%)
Housing units in structures - 2 (%)
Housing units in structures - 3 or 4 (%)
Housing units in structures - 5 to 9 (%)
Housing units in structures - 10 to 19 (%)
Housing units in structures - 20 to 49 (%)
Housing units in structures - 50 or more (%)
Housing units in structures - Mobile home (%)
Housing units in structures - Boat, RV, van, etc. (%)
Housing units in structures - Owners - 1, detached (%)
Housing units in structures - Owners - 1, attached (%)
Housing units in structures - Owners - 2 (%)
Housing units in structures - Owners - 3 or 4 (%)
Housing units in structures - Owners - 5 to 9 (%)
Housing units in structures - Owners - 10 to 19 (%)
Housing units in structures - Owners - 20 to 49 (%)
Housing units in structures - Owners - 50 or more (%)
Housing units in structures - Owners - Mobile home (%)
Housing units in structures - Owners - Boat, RV, van, etc. (%)
Housing units in structures - Renters - 1, detached (%)
Housing units in structures - Renters - 1, attached (%)
Housing units in structures - Renters - 2 (%)
Housing units in structures - Renters - 3 or 4 (%)
Housing units in structures - Renters - 5 to 9 (%)
Housing units in structures - Renters - 10 to 19 (%)
Housing units in structures - Renters - 20 to 49 (%)
Housing units in structures - Renters - 50 or more (%)
Housing units in structures - Renters - Mobile home (%)
Housing units in structures - Renters - Boat, RV, van, etc. (%)
House/condo owner moved in on average (years ago)
Renter moved in on average (years ago)
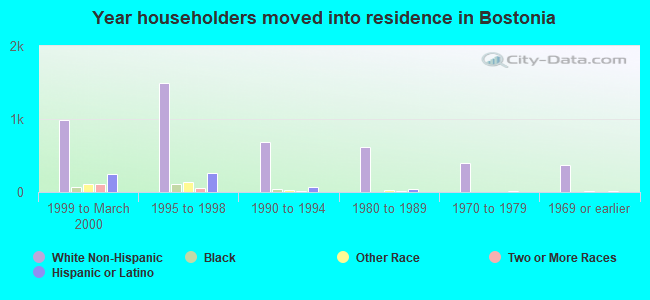
Year householder moved into unit - Moved in 1999 to March 2000 (%)
Year householder moved into unit - Moved in 1999 to March 2000 (%) - White
Year householder moved into unit - Moved in 1999 to March 2000 (%) - Black or African American
Year householder moved into unit - Moved in 1999 to March 2000 (%) - Asian
Year householder moved into unit - Moved in 1999 to March 2000 (%) - Hispanic or Latino
Year householder moved into unit - Moved in 1999 to March 2000 (%) - American Indian and Alaska Native
Year householder moved into unit - Moved in 1999 to March 2000 (%) - Multirace
Year householder moved into unit - Moved in 1999 to March 2000 (%) - Other Race
Year householder moved into unit - Moved in 1995 to 1998 (%)
Year householder moved into unit - Moved in 1995 to 1998 (%) - White
Year householder moved into unit - Moved in 1995 to 1998 (%) - Black or African American
Year householder moved into unit - Moved in 1995 to 1998 (%) - Asian
Year householder moved into unit - Moved in 1995 to 1998 (%) - Hispanic or Latino
Year householder moved into unit - Moved in 1995 to 1998 (%) - American Indian and Alaska Native
Year householder moved into unit - Moved in 1995 to 1998 (%) - Multirace
Year householder moved into unit - Moved in 1995 to 1998 (%) - Other Race
Year householder moved into unit - Moved in 1990 to 1994 (%)
Year householder moved into unit - Moved in 1990 to 1994 (%) - White
Year householder moved into unit - Moved in 1990 to 1994 (%) - Black or African American
Year householder moved into unit - Moved in 1990 to 1994 (%) - Asian
Year householder moved into unit - Moved in 1990 to 1994 (%) - Hispanic or Latino
Year householder moved into unit - Moved in 1990 to 1994 (%) - American Indian and Alaska Native
Year householder moved into unit - Moved in 1990 to 1994 (%) - Multirace
Year householder moved into unit - Moved in 1990 to 1994 (%) - Other Race
Year householder moved into unit - Moved in 1980 to 1989 (%)
Year householder moved into unit - Moved in 1980 to 1989 (%) - White
Year householder moved into unit - Moved in 1980 to 1989 (%) - Black or African American
Year householder moved into unit - Moved in 1980 to 1989 (%) - Asian
Year householder moved into unit - Moved in 1980 to 1989 (%) - Hispanic or Latino
Year householder moved into unit - Moved in 1980 to 1989 (%) - American Indian and Alaska Native
Year householder moved into unit - Moved in 1980 to 1989 (%) - Multirace
Year householder moved into unit - Moved in 1980 to 1989 (%) - Other Race
Year householder moved into unit - Moved in 1970 to 1979 (%)
Year householder moved into unit - Moved in 1970 to 1979 (%) - White
Year householder moved into unit - Moved in 1970 to 1979 (%) - Black or African American
Year householder moved into unit - Moved in 1970 to 1979 (%) - Asian
Year householder moved into unit - Moved in 1970 to 1979 (%) - Hispanic or Latino
Year householder moved into unit - Moved in 1970 to 1979 (%) - American Indian and Alaska Native
Year householder moved into unit - Moved in 1970 to 1979 (%) - Multirace
Year householder moved into unit - Moved in 1970 to 1979 (%) - Other Race
Year householder moved into unit - Moved in 1969 or earlier (%)
Year householder moved into unit - Moved in 1969 or earlier (%) - White
Year householder moved into unit - Moved in 1969 or earlier (%) - Black or African American
Year householder moved into unit - Moved in 1969 or earlier (%) - Asian
Year householder moved into unit - Moved in 1969 or earlier (%) - Hispanic or Latino
Year householder moved into unit - Moved in 1969 or earlier (%) - American Indian and Alaska Native
Year householder moved into unit - Moved in 1969 or earlier (%) - Multirace
Year householder moved into unit - Moved in 1969 or earlier (%) - Other Race
Housing units lacking complete plumbing facilities (%)
Housing units lacking complete kitchen facilities (%)
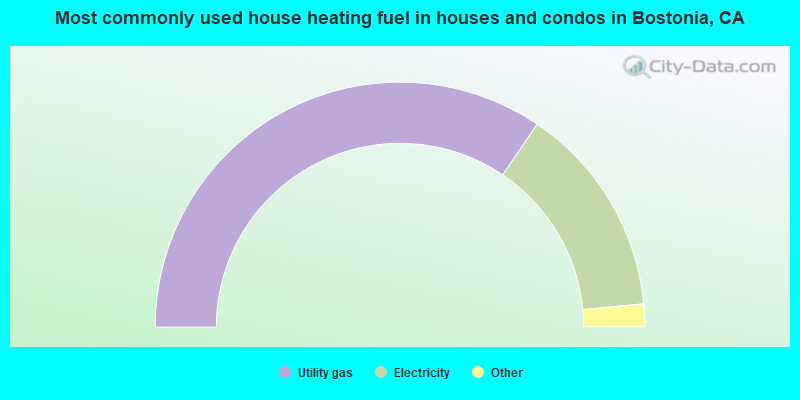
House heating fuel used in houses and condos - Utility gas (%)
House heating fuel used in houses and condos - Bottled, tank, or LP gas (%)
House heating fuel used in houses and condos - Electricity (%)
House heating fuel used in houses and condos - Fuel oil, kerosene, etc. (%)
House heating fuel used in houses and condos - Coal or coke (%)
House heating fuel used in houses and condos - Wood (%)
House heating fuel used in houses and condos - Solar energy (%)
House heating fuel used in houses and condos - Other fuel (%)
House heating fuel used in houses and condos - No fuel used (%)
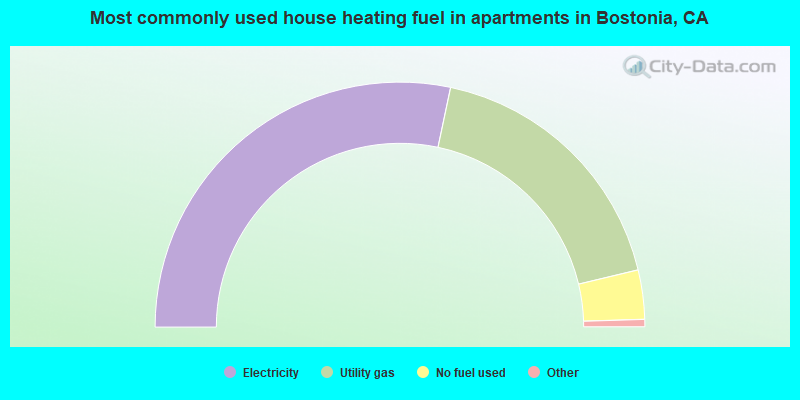
House heating fuel used in apartments - Utility gas (%)
House heating fuel used in apartments - Bottled, tank, or LP gas (%)
House heating fuel used in apartments - Electricity (%)
House heating fuel used in apartments - Fuel oil, kerosene, etc. (%)
House heating fuel used in apartments - Coal or coke (%)
House heating fuel used in apartments - Wood (%)
House heating fuel used in apartments - Solar energy (%)
House heating fuel used in apartments - Other fuel (%)
House heating fuel used in apartments - No fuel used (%)
Median year house/condo built: 1976Median year apartment built: 1976Household type by relationship:
Households: 16,780
Male householders: 2,767 (477 living alone ), Female householders: 2,956 (776 living alone )2,336 spouses (2,304 opposite-sex spouses ), 639 unmarried partners , (591 opposite-sex unmarried partners ), 5,760 children (5,052 natural , 359 adopted , 348 stepchildren ), 612 grandchildren , 119 brothers or sisters , 334 parents , 0 foster children , 380 other relatives , 756 non-relatives In group quarters: 116
Size of family households: 1,248 2-persons , 1,044 3-persons , 966 4-persons , 335 5-persons , 206 6-persons , 104 7-or-more-persons .
Size of nonfamily households: 1,287 1-person , 574 2-persons , 50 3-persons , 36 5-persons .
2,266 married couples with children. single-parent households (459 men , 645 women ).
65.6% of residents of Bostonia speak English at home. of residents speak Spanish at home (72% speak English very well , 15% speak English well , 10% speak English not well , 3% don't speak English at all ).of residents speak other Indo-European language at home (56% speak English very well , 34% speak English well , 10% speak English not well ).of residents speak Asian or Pacific Island language at home (74% speak English very well , 19% speak English well , 7% speak English not well ).of residents speak other language at home (53% speak English very well , 32% speak English well , 7% speak English not well , 9% don't speak English at all ).
Foreign born population: 3,270 (19.5%)of them are naturalized citizens )
Median number of rooms in houses and condos:
Median number of rooms in apartments
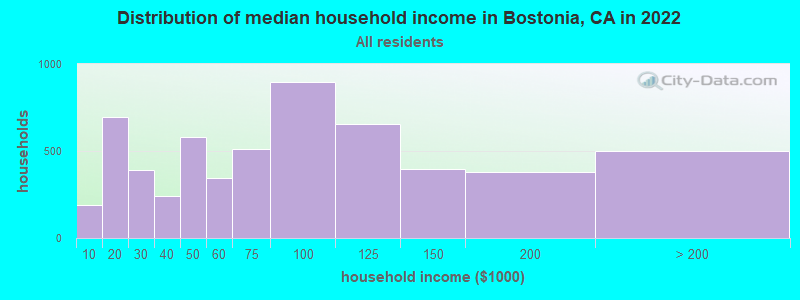
Bostonia, CA household income distribution 192 Less than $10,000698 $10,000 to $19,999391 $20,000 to $29,999240 $30,000 to $39,999582 $40,000 to $49,999343 $50,000 to $59,999510 $60,000 to $74,999898 $75,000 to $99,999655 $100,000 to $124,999396 $125,000 to $149,999380 $150,000 to $199,999500 $200,000 or more
Home value of owner - occupied houses in 2022 in Bostonia, CA 150 Less than $10,00012 $10,000 to $14,999191 $15,000 to $19,9998 $20,000 to $24,9998 $25,000 to $29,99929 $35,000 to $39,99924 $40,000 to $49,99996 $50,000 to $59,99925 $70,000 to $79,99982 $80,000 to $89,99951 $90,000 to $99,999113 $100,000 to $124,99934 $125,000 to $149,99914 $150,000 to $174,999122 $200,000 to $249,99951 $250,000 to $299,99987 $300,000 to $399,999114 $400,000 to $499,999542 $500,000 to $749,999221 $750,000 to $999,99946 $1,000,000 to $1,499,999Rent paid by renters in 2022 in Bostonia, CA 48 $200 to $249121 $300 to $34911 $550 to $59911 $600 to $64938 $700 to $74914 $750 to $799113 $800 to $89973 $900 to $999481 $1,000 to $1,249272 $1,250 to $1,4991,354 $1,500 to $1,999612 $2,000 to $2,499158 $2,500 to $2,999188 $3,000 to $3,499
Percentage of workers working in this county: 99.7%Number of people working at home: 933 (11.6% of all workers )
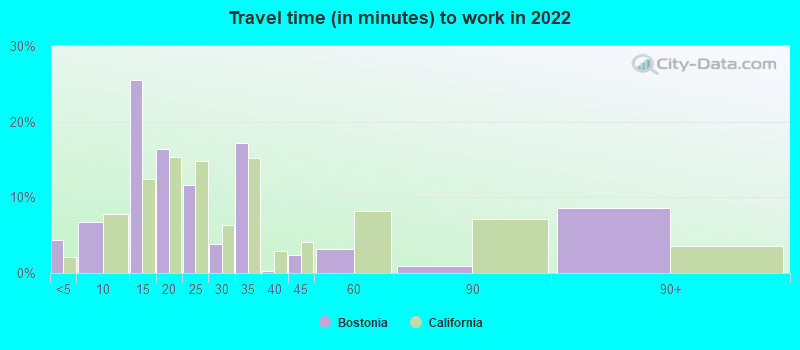
Travel time to work (commute)
Less than 5 minutes: 1115 to 9 minutes: 50810 to 14 minutes: 1,01415 to 19 minutes: 86920 to 24 minutes: 1,07125 to 29 minutes: 80230 to 34 minutes: 1,53235 to 39 minutes: 16640 to 44 minutes: 15945 to 59 minutes: 40560 to 89 minutes: 27090 or more minutes: 89
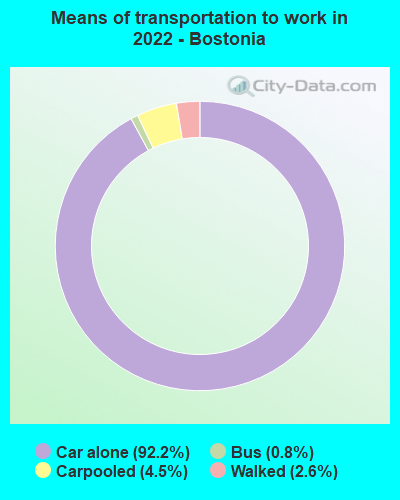
Means of transportation to work:
Drove a car alone: 1,649 (62.7%)Carpooled: 84 (3.2%)Bus : 12 (0.5%)Walked: 50 (1.9%)Worked at home: 933 (35.5%)
Unemployment by race in 2022
Unemployment rate for White non-Hispanic residents 2.9% Males2.8% FemalesUnemployment rate for Black residents 12.2% Males32.9% FemalesUnemployment rate for other race residents 19.9% Males11.9% FemalesUnemployment rate for two or more race residents 24.1% Males3.6% FemalesUnemployment rate for Hispanic or Latino residents 12.6% Males4.9% Females
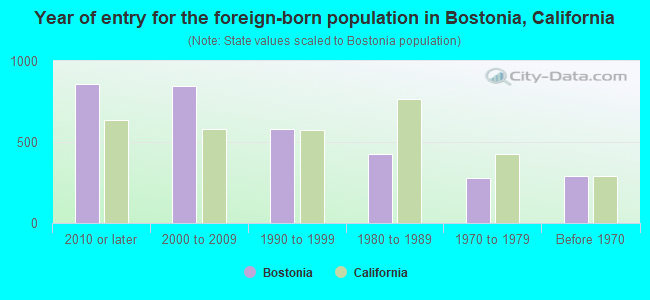
Year of entry for the foreign-born population in Bostonia, California
856 2010 or later 847 2000 to 2009 583 1990 to 1999 425 1980 to 1989 276 1970 to 1979 289 Before 1970
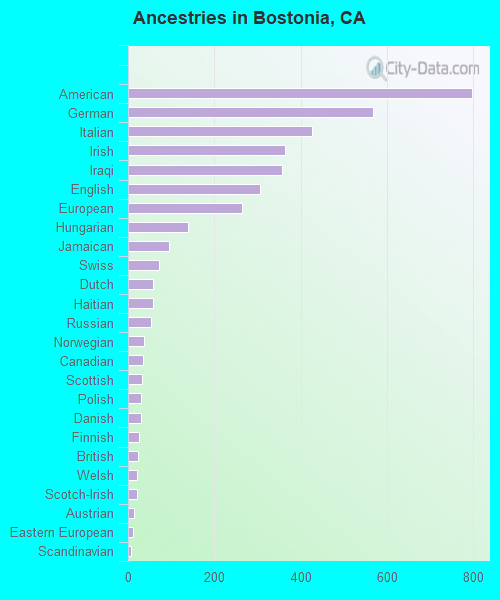
First ancestries reported:
American: 797 (8.9%)
German: 569 (6.4%)
Italian: 427 (4.8%)
Irish: 364 (4.1%)
Iraqi: 357 (4.0%)
English: 306 (3.4%)
European: 265 (3.0%)
Hungarian: 140 (1.6%)
Jamaican: 95 (1.1%)
Swiss: 71 (0.8%)
Dutch: 58 (0.6%)
Haitian: 57 (0.6%)
Russian: 53 (0.6%)
Norwegian: 38 (0.4%)
Canadian: 34 (0.4%)
Scottish: 33 (0.4%)
Polish: 31 (0.3%)
Danish: 29 (0.3%)
Finnish: 26 (0.3%)
British: 23 (0.3%)
Welsh: 21 (0.2%)
Scotch-Irish: 20 (0.2%)
Austrian: 15 (0.2%)
Eastern European: 11 (0.1%)
Scandinavian: 8 (0.09%)
Swedish: 8 (0.09%)
Portuguese: 7 (0.08%)
Palestinian: 5 (0.06%) Most common places of birth for foreign-born residents (%): Mexico Bostonia:
40.5% (1,325)California:
37.2% (3,881,193)
Iraq Bostonia:
21.5% (703)California:
0.4% (40,941)
Philippines Bostonia:
11.7% (383)California:
7.8% (818,297)
Hungary Bostonia:
3.4% (110)California:
0.1% (10,936)
Other Northern America Bostonia:
3.2% (104)California:
0.0% (476)
Germany Bostonia:
2.5% (83)California:
0.7% (73,304)
Russia Bostonia:
2.0% (65)California:
0.7% (71,932)
Lebanon Bostonia:
1.7% (57)California:
0.3% (31,757)
Poland Bostonia:
1.7% (56)California:
0.2% (20,997)
Place of birth for U.S.-born residents:
This state: 9,910Other state: 3,291Northeast: 1,003Midwest: 808South: 1,033West: 463 82.9% of Bostonia residents lived in the same house 1 years ago.
Out of people who lived in different houses, 42.6% lived in this county.
Out of people who lived in different counties, 9.8% lived in California.
Bostonia:
82.9%State average:
88.9%
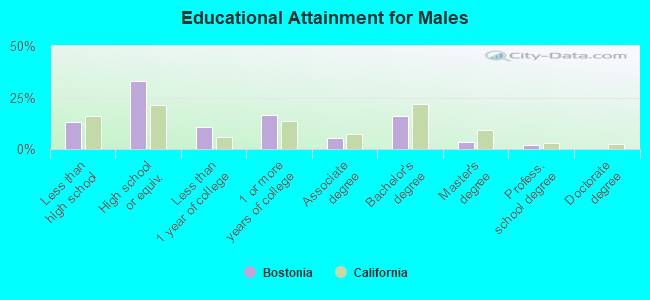
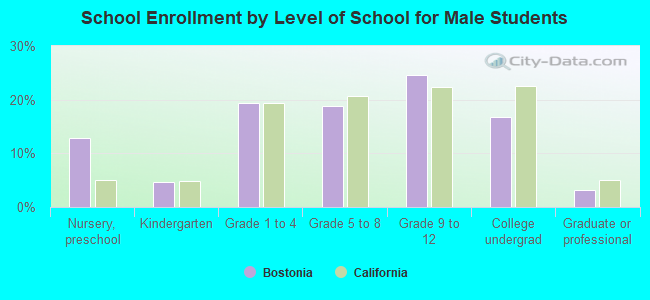
Education attainment for males 25 years and older:
No schooling: 297Nursery to 4th grade: 05th and 6th grade: 117th and 8th grade: 09th grade: 3310th grade: 3411th grade: 10412th grade, no diploma: 207High school graduate (or equivalency): 1,700Less than 1 year of college: 559Some college more than 1 year, no degree: 851Associate degree: 271Bachelor's degree: 818Master's degree: 179Professional school degree: 94Doctorate degree: 0
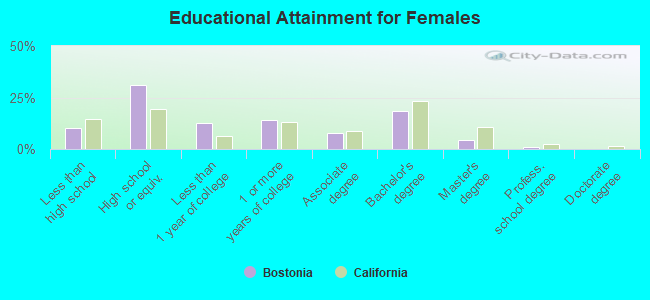
Education attainment for females 25 years and older:
No schooling: 175Nursery to 4th grade: 05th and 6th grade: 1167th and 8th grade: 889th grade: 4610th grade: 4911th grade: 012th grade, no diploma: 152High school graduate (or equivalency): 1,881Less than 1 year of college: 755Some college more than 1 year, no degree: 855Associate degree: 464Bachelor's degree: 1,114Master's degree: 275Professional school degree: 62Doctorate degree: 0
Housing units in structures:
One, detached: 1,835One, attached: 719Two: 963 or 4: 855 to 9: 47110 to 19: 59520 to 49: 42050 or more: 661Mobile homes: 1,130Median worth of mobile homes: $127,037
Housing units lacking complete plumbing facilities in 2022: 0.5%Housing units lacking complete kitchen facilities in 2022: 0.9%House/condo owner moved in on average 9 years ago
Renter moved in on average 5 years ago
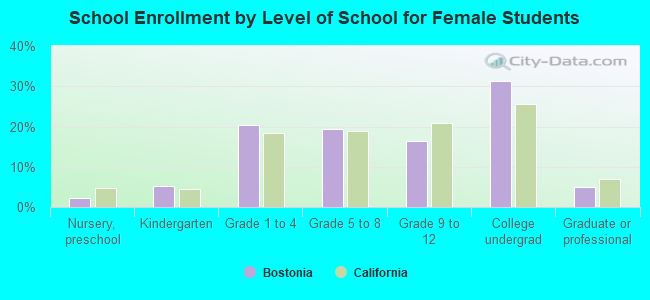
Private vs. public school enrollment:
Students in private schools in grades 1 to 8 (elementary and middle school): 303 Here:
17.5%California:
10.5%
Students in private schools in grades 9 to 12 (high school): 146 Here:
16.5%California:
8.5%
Students in private undergraduate colleges: 81 Here:
8.1%California:
15.9%