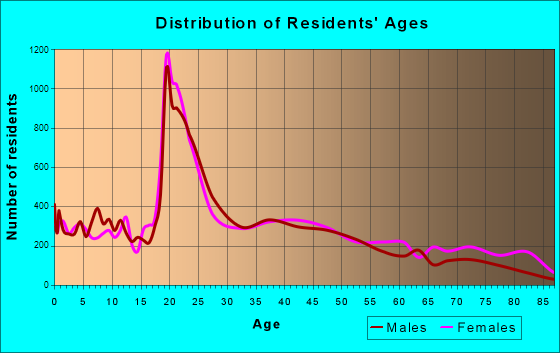
Bowling Green, KY (Kentucky) Houses and Residents
Estimated median house or condo value in 2022: $247,200 (it was $97,000 in 2000 )
Bowling Green:
$247,200Kentucky:
$196,300
Lower value quartile - upper value quartile: $182,500 - $354,500Mean price in 2022: Detached houses: $278,550 Here:
$278,550State:
$256,452
Townhouses or other attached units: $282,053 Here:
$282,053State:
$264,090
In 2-unit structures: $217,742 Here:
$217,742State:
$211,203
Mobile homes: $21,435 Here:
$21,435State:
$84,635
Total population: 62,479 (Urban population: 48,517, Rural population: 608 (21 farm, 587 nonfarm ))
Houses: 34,987 (31,530 occupied: 11,605 owner occupied, 19,925 renter occupied )
% of renters here:
63%State:
31%
Housing density: 988 houses/condos per square mile
Median price asked for vacant for-sale houses and condos in 2022: $84,151.
Median contract rent in 2022: $772 (lower quartile is $563, upper quartile is $1,025)
Median rent asked for vacant for-rent units in 2022: $1,310
Median gross rent in Bowling Green, KY in 2022: $953
Housing units in Bowling Green with a mortgage: 6,819 (650 second mortgage, 13 home equity loan, 539 both second mortgage and home equity loan )Houses without a mortgage: 142
Median household income for houses/condos with a mortgage: $92,880
Median household income for apartments without a mortgage: $55,327
Median monthly housing costs: $958
Data:
Median house or condo value ($)
Median house or condo value ($ change since 2000)
Median house or condo value ($) - White
Median house or condo value ($) - Black or African American
Median house or condo value ($) - Asian
Median house or condo value ($) - Hispanic or Latino
Median house or condo value ($) - American Indian and Alaska Native
Median house or condo value ($) - Multirace
Median house or condo value ($) - Other Race
Median price asked for mobile homes ($)
Household density (households per square mile)
Mean house or condo value by units in structure - 1, detached ($)
Mean house or condo value by units in structure - 1, attached ($)
Mean house or condo value by units in structure - 2 ($)
Mean house or condo value by units in structure by units in structure - 3 or 4 ($)
Mean house or condo value by units in structure - 5 or more ($)
Mean house or condo value by units in structure - Boat, RV, van, etc. ($)
Mean house or condo value by units in structure - Mobile home ($)
Median contract rent ($)
Median contract rent - Lower quartile ($)
Median contract rent - Upper quartile ($)
Median gross rent ($)
Urban houses (%)
Rural houses (%)
Houses occupied (%)
Houses occupied (% change since 2000)
Houses owner occupied (%)
Houses owner occupied (% change since 2000)
Houses renter occupied (%)
Houses renter occupied (% change since 2000)
Vacant housing units - For rent (%)
Vacant housing units - For rent (% change since 2000)
Vacant housing units - For sale only (%)
Vacant housing units - For sale only (% change since 2000)
Vacant housing units - Rented or sold, not occupied (%)
Vacant housing units - Rented or sold, not occupied (% change since 2000)
Vacant housing units - For seasonal, recreational, or occasional use (%)
Vacant housing units - For seasonal, recreational, or occasional use (% change since 2000)
Vacant housing units - For migrant workers (%)
Vacant housing units - For migrant workers (% change since 2000)
Vacant housing units - Other vacant (%)
Vacant housing units - Other vacant (% change since 2000)
Median monthly housing costs ($)
Median household income for houses/condos with a mortgage ($)
Median household income for houses/condos without a mortgage ($)
Median household income ($)
Median household income ($) - White
Median household income ($) - Black or African American
Median household income ($) - Asian
Median household income ($) - Hispanic or Latino
Median household income ($) - American Indian and Alaska Native
Median household income ($) - Multirace
Median household income ($) - Other Race
Mortgage status - with mortgage (%)
Mortgage status - with second mortgage (%)
Mortgage status - with home equity loan (%)
Mortgage status - with both second mortgage and home equity loan (%)
Mortgage status - without a mortgage (%)
Median year house/condo built
Median year apartment built
Household type by relationship - Male householder living alone (%)
Household type by relationship - Male householder not living alone (%)
Household type by relationship - Female householder living alone (%)
Household type by relationship - Female householder not living alone (%)
Household type by relationship - Opposite-Sex spouse (%)
Household type by relationship - Same-Sex spouse (%)
Household type by relationship - Opposite-Sex unmarried partner (%)
Household type by relationship - Same-Sex unmarried partner (%)
Household type by relationship - In group quarters (%)
Size of family households - 2-person household (%)
Size of family households - 3-person household (%)
Size of family households - 4-person household (%)
Size of family households - 5-person household (%)
Size of family households - 6-person household (%)
Size of family households - 7-or-more-person household (%)
Size of nonfamily households - 1-person household (%)
Size of nonfamily households - 2-person household (%)
Size of nonfamily households - 3-person household (%)
Size of nonfamily households - 4-person household (%)
Size of nonfamily households - 5-person household (%)
Size of nonfamily households - 6-person household (%)
Size of nonfamily households - 7-or-moreperson household (%)
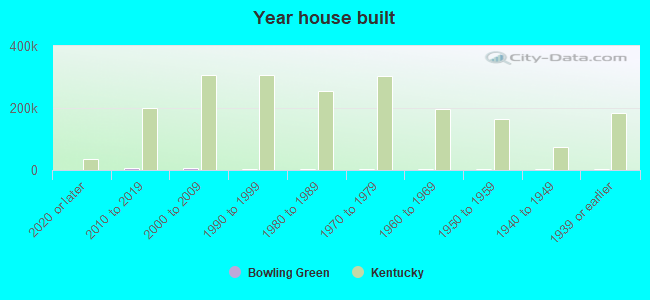
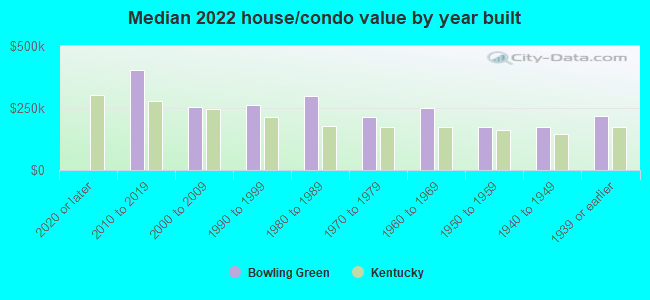
Year house built - Built 2010 or later (%)
Year house built - Built 2000 to 2009 (%)
Year house built - Built 1990 to 1999 (%)
Year house built - Built 1980 to 1989 (%)
Year house built - Built 1970 to 1979 (%)
Year house built - Built 1960 to 1969 (%)
Year house built - Built 1950 to 1959 (%)
Year house built - Built 1940 to 1949 (%)
Year house built - Built 1939 or earlier (%)
Median number of rooms in houses and condos
Median number of rooms in apartments
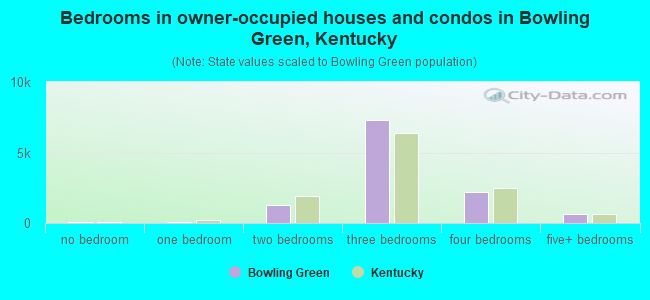
Median number of bedrooms in owner occupied houses
Mean number of bedrooms in owner occupied houses
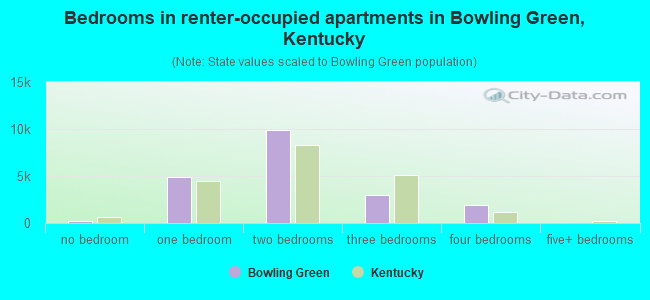
Median number of bedrooms in renter occupied houses
Mean number of bedrooms in renter occupied houses
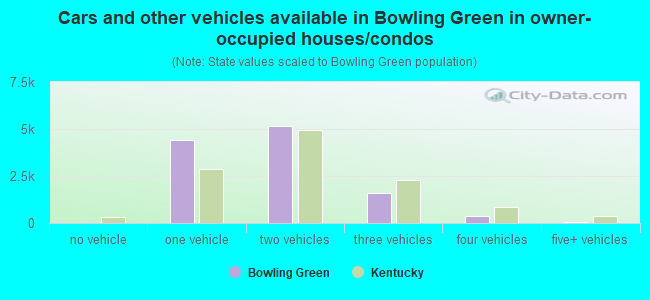
Median number of vehichles in owner occupied houses
Mean number of vehichles in owner occupied houses
Median number of vehichles in renter occupied houses
Mean number of vehichles in renter occupied houses
Rooms in owner-occupied houses - 1 room (%)
Rooms in owner-occupied houses - 2 rooms (%)
Rooms in owner-occupied houses - 3 rooms (%)
Rooms in owner-occupied houses - 4 rooms (%)
Rooms in owner-occupied houses - 5 rooms (%)
Rooms in owner-occupied houses - 6 rooms (%)
Rooms in owner-occupied houses - 7 rooms (%)
Rooms in owner-occupied houses - 8 rooms (%)
Rooms in owner-occupied houses - 9+ rooms (%)
Rooms in renter-occupied houses - 1 room (%)
Rooms in renter-occupied houses - 2 rooms (%)
Rooms in renter-occupied houses - 3 rooms (%)
Rooms in renter-occupied houses - 4 rooms (%)
Rooms in renter-occupied houses - 5 rooms (%)
Rooms in renter-occupied houses - 6 rooms (%)
Rooms in renter-occupied houses - 7 rooms (%)
Rooms in renter-occupied houses - 8 rooms (%)
Rooms in renter-occupied houses - 9+ rooms (%)
Bedrooms in owner-occupied houses - no bedrooms (%)
Bedrooms in owner-occupied houses - 1 bedroom (%)
Bedrooms in owner-occupied houses - 2 bedrooms (%)
Bedrooms in owner-occupied houses - 3 bedrooms (%)
Bedrooms in owner-occupied houses - 4 bedrooms (%)
Bedrooms in owner-occupied houses - 5+ bedrooms (%)
Bedrooms in renter-occupied houses - no bedrooms (%)
Bedrooms in renter-occupied houses - 1 bedroom (%)
Bedrooms in renter-occupied houses - 2 bedrooms (%)
Bedrooms in renter-occupied houses - 3 bedrooms (%)
Bedrooms in renter-occupied houses - 4 bedrooms (%)
Bedrooms in renter-occupied houses - 5+ bedrooms (%)
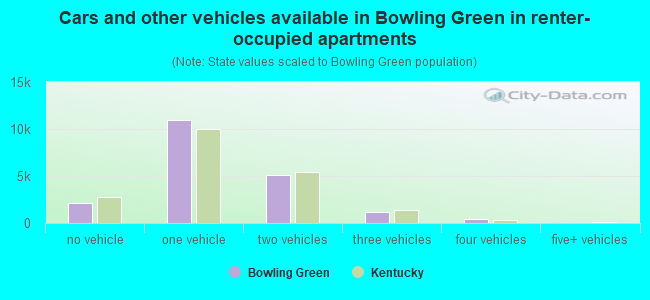
Vehicles available in owner-occupied houses - no vehicle available (%)
Vehicles available in owner-occupied houses - 1 vehicle available(%)
Vehicles available in owner-occupied houses - 2 Vehicles available (%)
Vehicles available in owner-occupied houses - 3 Vehicles available (%)
Vehicles available in owner-occupied houses - 4 Vehicles available (%)
Vehicles available in owner-occupied houses - 5+ Vehicles available (%)
Vehicles available in renter-occupied houses - no vehicle available (%)
Vehicles available in renter-occupied houses - 1 vehicle available (%)
Vehicles available in renter-occupied houses - 2 Vehicles available (%)
Vehicles available in renter-occupied houses - 3 Vehicles available (%)
Vehicles available in renter-occupied houses - 4 Vehicles available (%)
Vehicles available in renter-occupied houses - 5+ Vehicles available (%)
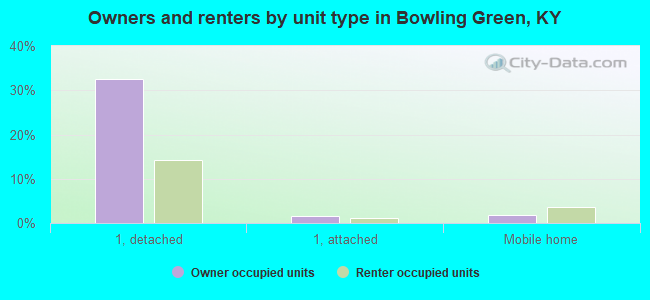
Housing units in structures - 1, detached (%)
Housing units in structures - 1, attached (%)
Housing units in structures - 2 (%)
Housing units in structures - 3 or 4 (%)
Housing units in structures - 5 to 9 (%)
Housing units in structures - 10 to 19 (%)
Housing units in structures - 20 to 49 (%)
Housing units in structures - 50 or more (%)
Housing units in structures - Mobile home (%)
Housing units in structures - Boat, RV, van, etc. (%)
Housing units in structures - Owners - 1, detached (%)
Housing units in structures - Owners - 1, attached (%)
Housing units in structures - Owners - 2 (%)
Housing units in structures - Owners - 3 or 4 (%)
Housing units in structures - Owners - 5 to 9 (%)
Housing units in structures - Owners - 10 to 19 (%)
Housing units in structures - Owners - 20 to 49 (%)
Housing units in structures - Owners - 50 or more (%)
Housing units in structures - Owners - Mobile home (%)
Housing units in structures - Owners - Boat, RV, van, etc. (%)
Housing units in structures - Renters - 1, detached (%)
Housing units in structures - Renters - 1, attached (%)
Housing units in structures - Renters - 2 (%)
Housing units in structures - Renters - 3 or 4 (%)
Housing units in structures - Renters - 5 to 9 (%)
Housing units in structures - Renters - 10 to 19 (%)
Housing units in structures - Renters - 20 to 49 (%)
Housing units in structures - Renters - 50 or more (%)
Housing units in structures - Renters - Mobile home (%)
Housing units in structures - Renters - Boat, RV, van, etc. (%)
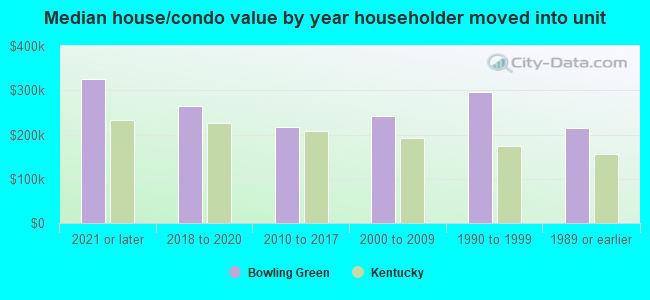
House/condo owner moved in on average (years ago)
Renter moved in on average (years ago)
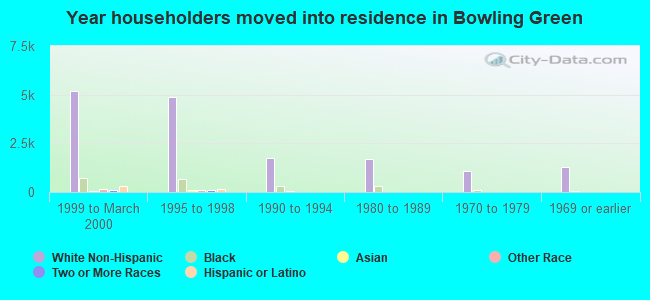
Year householder moved into unit - Moved in 1999 to March 2000 (%)
Year householder moved into unit - Moved in 1999 to March 2000 (%) - White
Year householder moved into unit - Moved in 1999 to March 2000 (%) - Black or African American
Year householder moved into unit - Moved in 1999 to March 2000 (%) - Asian
Year householder moved into unit - Moved in 1999 to March 2000 (%) - Hispanic or Latino
Year householder moved into unit - Moved in 1999 to March 2000 (%) - American Indian and Alaska Native
Year householder moved into unit - Moved in 1999 to March 2000 (%) - Multirace
Year householder moved into unit - Moved in 1999 to March 2000 (%) - Other Race
Year householder moved into unit - Moved in 1995 to 1998 (%)
Year householder moved into unit - Moved in 1995 to 1998 (%) - White
Year householder moved into unit - Moved in 1995 to 1998 (%) - Black or African American
Year householder moved into unit - Moved in 1995 to 1998 (%) - Asian
Year householder moved into unit - Moved in 1995 to 1998 (%) - Hispanic or Latino
Year householder moved into unit - Moved in 1995 to 1998 (%) - American Indian and Alaska Native
Year householder moved into unit - Moved in 1995 to 1998 (%) - Multirace
Year householder moved into unit - Moved in 1995 to 1998 (%) - Other Race
Year householder moved into unit - Moved in 1990 to 1994 (%)
Year householder moved into unit - Moved in 1990 to 1994 (%) - White
Year householder moved into unit - Moved in 1990 to 1994 (%) - Black or African American
Year householder moved into unit - Moved in 1990 to 1994 (%) - Asian
Year householder moved into unit - Moved in 1990 to 1994 (%) - Hispanic or Latino
Year householder moved into unit - Moved in 1990 to 1994 (%) - American Indian and Alaska Native
Year householder moved into unit - Moved in 1990 to 1994 (%) - Multirace
Year householder moved into unit - Moved in 1990 to 1994 (%) - Other Race
Year householder moved into unit - Moved in 1980 to 1989 (%)
Year householder moved into unit - Moved in 1980 to 1989 (%) - White
Year householder moved into unit - Moved in 1980 to 1989 (%) - Black or African American
Year householder moved into unit - Moved in 1980 to 1989 (%) - Asian
Year householder moved into unit - Moved in 1980 to 1989 (%) - Hispanic or Latino
Year householder moved into unit - Moved in 1980 to 1989 (%) - American Indian and Alaska Native
Year householder moved into unit - Moved in 1980 to 1989 (%) - Multirace
Year householder moved into unit - Moved in 1980 to 1989 (%) - Other Race
Year householder moved into unit - Moved in 1970 to 1979 (%)
Year householder moved into unit - Moved in 1970 to 1979 (%) - White
Year householder moved into unit - Moved in 1970 to 1979 (%) - Black or African American
Year householder moved into unit - Moved in 1970 to 1979 (%) - Asian
Year householder moved into unit - Moved in 1970 to 1979 (%) - Hispanic or Latino
Year householder moved into unit - Moved in 1970 to 1979 (%) - American Indian and Alaska Native
Year householder moved into unit - Moved in 1970 to 1979 (%) - Multirace
Year householder moved into unit - Moved in 1970 to 1979 (%) - Other Race
Year householder moved into unit - Moved in 1969 or earlier (%)
Year householder moved into unit - Moved in 1969 or earlier (%) - White
Year householder moved into unit - Moved in 1969 or earlier (%) - Black or African American
Year householder moved into unit - Moved in 1969 or earlier (%) - Asian
Year householder moved into unit - Moved in 1969 or earlier (%) - Hispanic or Latino
Year householder moved into unit - Moved in 1969 or earlier (%) - American Indian and Alaska Native
Year householder moved into unit - Moved in 1969 or earlier (%) - Multirace
Year householder moved into unit - Moved in 1969 or earlier (%) - Other Race
Housing units lacking complete plumbing facilities (%)
Housing units lacking complete kitchen facilities (%)
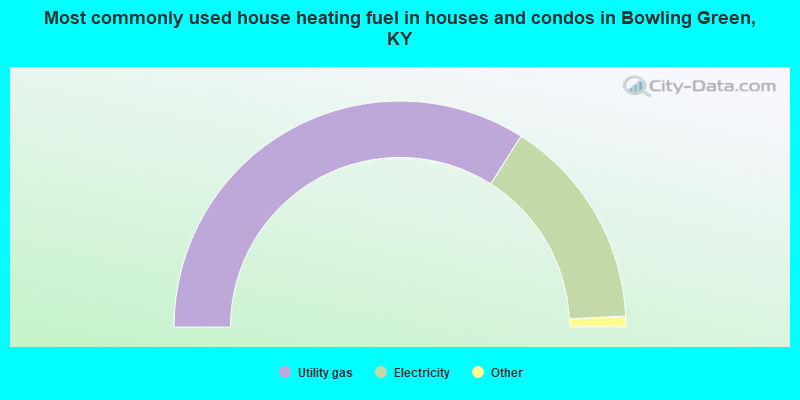
House heating fuel used in houses and condos - Utility gas (%)
House heating fuel used in houses and condos - Bottled, tank, or LP gas (%)
House heating fuel used in houses and condos - Electricity (%)
House heating fuel used in houses and condos - Fuel oil, kerosene, etc. (%)
House heating fuel used in houses and condos - Coal or coke (%)
House heating fuel used in houses and condos - Wood (%)
House heating fuel used in houses and condos - Solar energy (%)
House heating fuel used in houses and condos - Other fuel (%)
House heating fuel used in houses and condos - No fuel used (%)
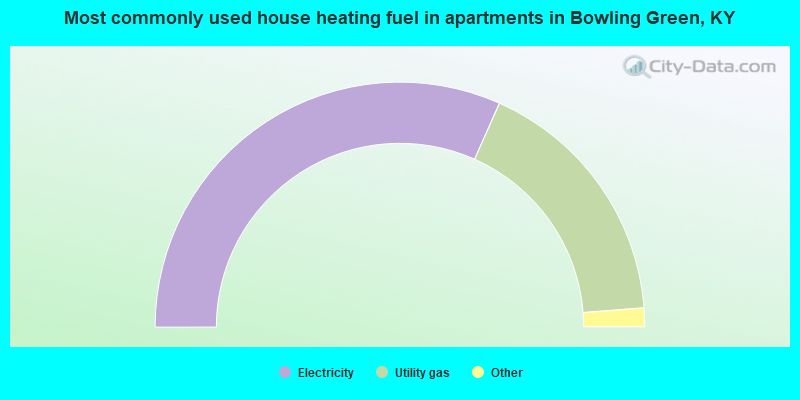
House heating fuel used in apartments - Utility gas (%)
House heating fuel used in apartments - Bottled, tank, or LP gas (%)
House heating fuel used in apartments - Electricity (%)
House heating fuel used in apartments - Fuel oil, kerosene, etc. (%)
House heating fuel used in apartments - Coal or coke (%)
House heating fuel used in apartments - Wood (%)
House heating fuel used in apartments - Solar energy (%)
House heating fuel used in apartments - Other fuel (%)
House heating fuel used in apartments - No fuel used (%)
Median year house/condo built: 1993Median year apartment built: 1991Household type by relationship:
Households: 74,929
Male householders: 14,753 (6,510 living alone ), Female householders: 16,777 (6,906 living alone )9,740 spouses (9,564 opposite-sex spouses ), 2,169 unmarried partners , (1,743 opposite-sex unmarried partners ), 16,529 children (16,186 natural , 66 adopted , 277 stepchildren ), 1,546 grandchildren , 556 brothers or sisters , 601 parents , 0 foster children , 872 other relatives , 6,318 non-relatives In group quarters: 5,068
Size of family households: 5,991 2-persons , 3,551 3-persons , 2,699 4-persons , 729 5-persons , 555 6-persons , 534 7-or-more-persons .
Size of nonfamily households: 13,416 1-person , 2,135 2-persons , 707 3-persons , 1,168 4-persons , 45 6-persons .
8,531 married couples with children. single-parent households (485 men , 4,023 women ).
81.3% of residents of Bowling Green speak English at home. of residents speak Spanish at home (53% speak English very well , 24% speak English well , 18% speak English not well , 5% don't speak English at all ).of residents speak other Indo-European language at home (59% speak English very well , 28% speak English well , 12% speak English not well , 1% don't speak English at all ).of residents speak Asian or Pacific Island language at home (42% speak English very well , 29% speak English well , 17% speak English not well , 12% don't speak English at all ).of residents speak other language at home (22% speak English very well , 33% speak English well , 36% speak English not well , 9% don't speak English at all ).
Foreign born population: 12,238 (16.3%)of them are naturalized citizens )
Median number of rooms in houses and condos:
Median number of rooms in apartments
Owner-occupied Renter-occupied
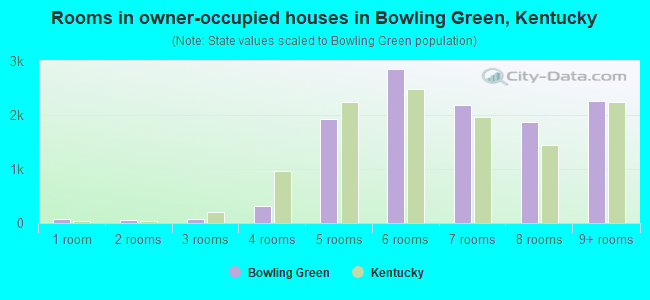
Rooms in owner-occupied houses in Bowling Green, Kentucky
80 1 room 63 2 rooms 78 3 rooms 321 4 rooms 1,918 5 rooms 2,843 6 rooms 2,176 7 rooms 1,866 8 rooms 2,260 9+ rooms
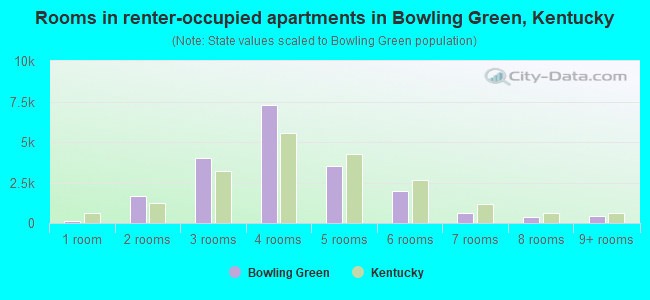
Rooms in renter-occupied apartments in Bowling Green, Kentucky
110 1 room 1,638 2 rooms 4,019 3 rooms 7,280 4 rooms 3,490 5 rooms 1,984 6 rooms 623 7 rooms 378 8 rooms 403 9+ rooms
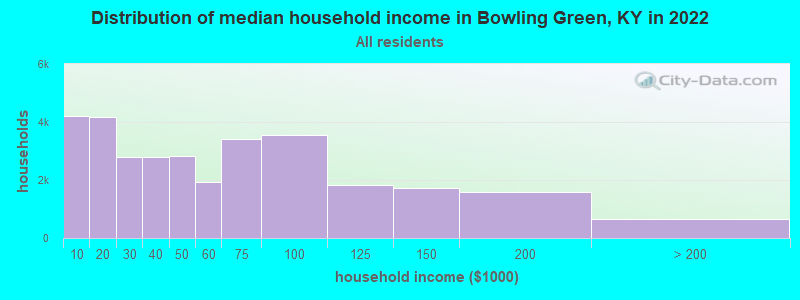
Bowling Green, KY household income distribution 4,207 Less than $10,0004,175 $10,000 to $19,9992,795 $20,000 to $29,9992,790 $30,000 to $39,9992,840 $40,000 to $49,9991,948 $50,000 to $59,9993,418 $60,000 to $74,9993,568 $75,000 to $99,9991,836 $100,000 to $124,9991,716 $125,000 to $149,9991,596 $150,000 to $199,999641 $200,000 or more
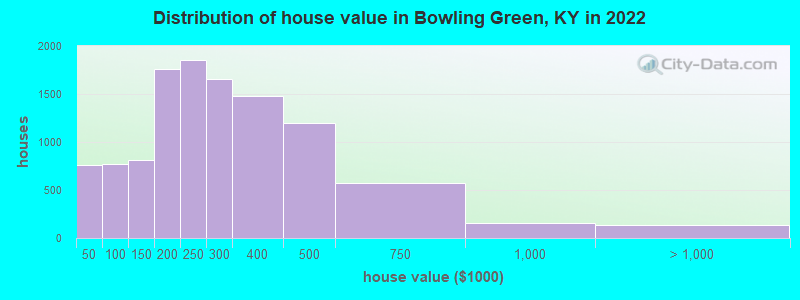
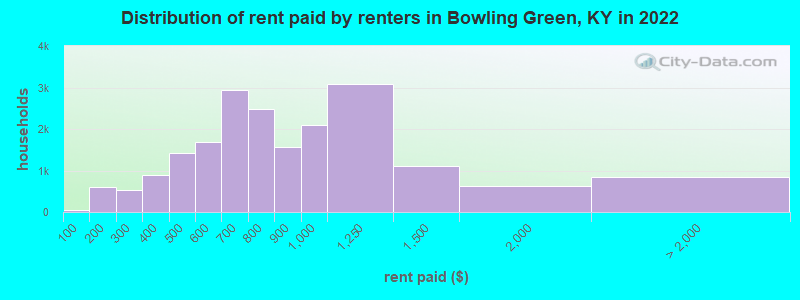
Home value of owner - occupied houses in 2022 in Bowling Green, KY 398 Less than $10,00034 $10,000 to $14,99944 $15,000 to $19,999107 $20,000 to $24,99993 $25,000 to $29,99983 $40,000 to $49,99958 $50,000 to $59,999156 $60,000 to $69,99999 $70,000 to $79,999200 $80,000 to $89,999171 $90,000 to $99,999233 $100,000 to $124,999582 $125,000 to $149,999978 $150,000 to $174,999781 $175,000 to $199,9991,848 $200,000 to $249,9991,657 $250,000 to $299,9991,481 $300,000 to $399,9991,202 $400,000 to $499,999577 $500,000 to $749,999156 $750,000 to $999,99970 $1,000,000 to $1,499,99918 $1,500,000 to $1,999,99952 $2,000,000 or moreRent paid by renters in 2022 in Bowling Green, KY 46 Less than $100329 $100 to $149279 $150 to $199167 $200 to $249371 $250 to $299387 $300 to $349505 $350 to $399765 $400 to $449646 $450 to $4991,248 $500 to $549441 $550 to $599888 $600 to $6492,052 $650 to $699884 $700 to $7491,603 $750 to $7991,559 $800 to $8992,093 $900 to $9993,075 $1,000 to $1,2491,116 $1,250 to $1,499626 $1,500 to $1,999174 $2,000 to $2,49979 $2,500 to $2,99993 $3,500 or more499 No cash rent
Percentage of workers working in this county: 85.5%Number of people working at home: 2,273 (6.3% of all workers )
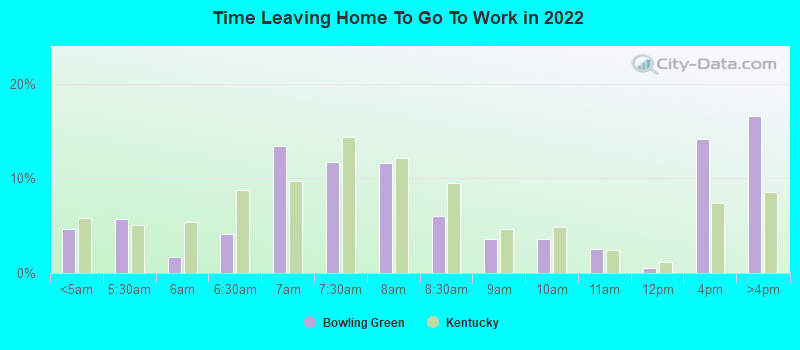
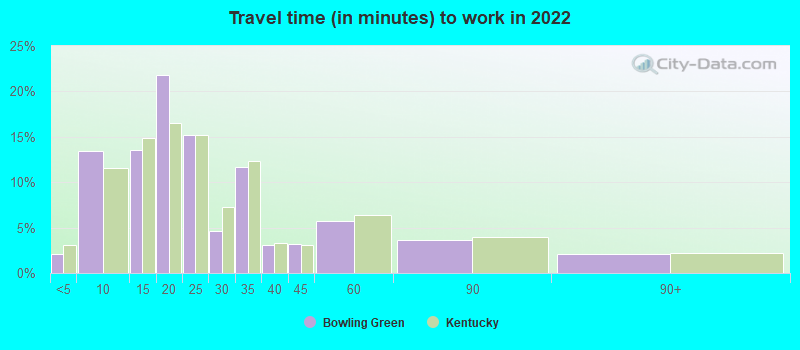
Travel time to work (commute)
Less than 5 minutes: 7515 to 9 minutes: 5,92710 to 14 minutes: 6,30015 to 19 minutes: 7,22520 to 24 minutes: 3,93325 to 29 minutes: 1,42730 to 34 minutes: 3,32635 to 39 minutes: 60040 to 44 minutes: 1,07645 to 59 minutes: 1,00260 to 89 minutes: 56990 or more minutes: 90
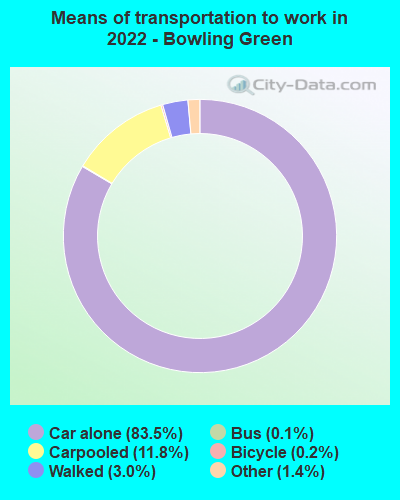
Means of transportation to work:
Drove a car alone: 48,517 (78.2%)Carpooled: 7,547 (12.2%)Bus : 41 (0.1%)Taxi: 997 (1.6%)Bicycle: 90 (0.1%)Walked: 1,776 (2.9%)Worked at home: 2,273 (3.7%)
Unemployment by race in 2022
Unemployment rate for White non-Hispanic residents 3.0% Males5.4% FemalesUnemployment rate for Black residents 9.3% Males10.1% FemalesUnemployment rate for Asian residents 5.4% MalesUnemployment rate for other race residents 1.1% MalesUnemployment rate for two or more race residents 9.6% Males15.6% FemalesUnemployment rate for Hispanic or Latino residents 0.7% Males3.2% Females
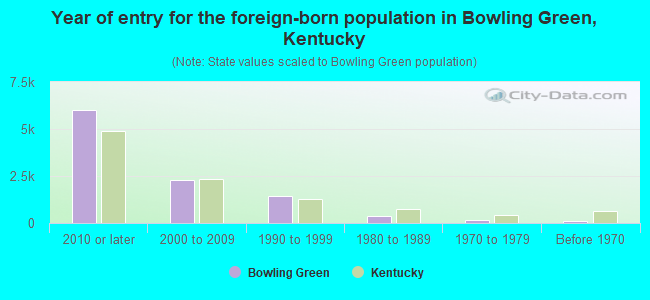
Year of entry for the foreign-born population in Bowling Green, Kentucky
5,992 2010 or later 2,294 2000 to 2009 1,424 1990 to 1999 388 1980 to 1989 138 1970 to 1979 109 Before 1970
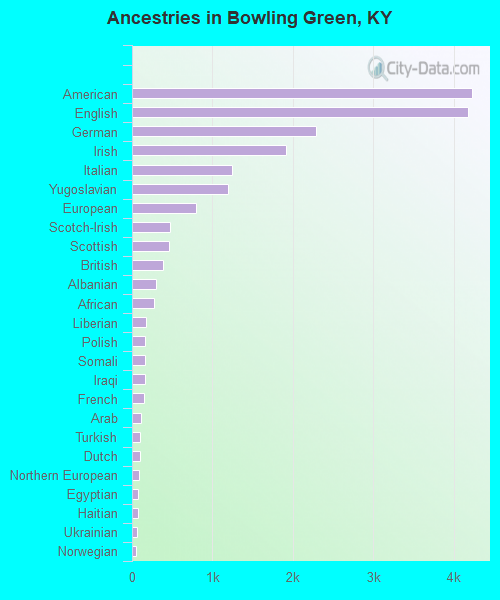
First ancestries reported:
American: 4,230 (11.5%)
English: 4,185 (11.4%)
German: 2,293 (6.2%)
Irish: 1,912 (5.2%)
Italian: 1,250 (3.4%)
Yugoslavian: 1,197 (3.3%)
European: 795 (2.2%)
Scotch-Irish: 467 (1.3%)
Scottish: 462 (1.3%)
British: 386 (1.1%)
Albanian: 294 (0.8%)
African: 270 (0.7%)
Liberian: 169 (0.5%)
Polish: 164 (0.4%)
Somali: 159 (0.4%)
Iraqi: 156 (0.4%)
French: 150 (0.4%)
Arab: 116 (0.3%)
Turkish: 103 (0.3%)
Dutch: 95 (0.3%)
Northern European: 82 (0.2%)
Egyptian: 77 (0.2%)
Haitian: 76 (0.2%)
Ukrainian: 56 (0.2%)
Norwegian: 51 (0.1%)
Russian: 48 (0.1%)
Jamaican: 47 (0.1%)
Portuguese: 45 (0.1%)
Lebanese: 39 (0.1%)
Scandinavian: 35 (0.10%)
Sierra Leonean: 30 (0.08%)
Welsh: 26 (0.07%)
Serbian: 25 (0.07%)
Ethiopian: 19 (0.05%)
French Canadian: 17 (0.05%)
Swedish: 16 (0.04%)
Canadian: 13 (0.04%)
Greek: 11 (0.03%)
Kenyan: 10 (0.03%)
Croatian: 10 (0.03%)
Palestinian: 9 (0.02%)
Australian: 8 (0.02%) Most common places of birth for foreign-born residents (%): Burma (Myanmar) Bowling Green:
18.1% (1,856)Kentucky:
1.9% (3,470)
Mexico Bowling Green:
11.0% (1,131)Kentucky:
15.8% (29,070)
Bosnia and Herzegovina Bowling Green:
7.0% (721)Kentucky:
1.7% (3,094)
El Salvador Bowling Green:
5.5% (566)Kentucky:
0.9% (1,652)
China, excluding Hong Kong and Taiwan Bowling Green:
5.0% (512)Kentucky:
4.2% (7,734)
Micronesia Bowling Green:
4.2% (426)Kentucky:
0.4% (764)
Tanzania Bowling Green:
4.1% (421)Kentucky:
0.4% (736)
Thailand Bowling Green:
3.1% (314)Kentucky:
1.1% (1,962)
Philippines Bowling Green:
2.7% (281)Kentucky:
3.3% (6,109)
India Bowling Green:
2.4% (245)Kentucky:
7.3% (13,454)
Malaysia Bowling Green:
2.4% (244)Kentucky:
0.3% (644)
Congo Bowling Green:
2.2% (221)Kentucky:
1.2% (2,276)
Honduras Bowling Green:
2.1% (211)Kentucky:
2.5% (4,639)
Somalia Bowling Green:
2.1% (210)Kentucky:
1.0% (1,776)
Vietnam Bowling Green:
2.1% (210)Kentucky:
2.0% (3,654)
Iraq Bowling Green:
2.0% (205)Kentucky:
1.5% (2,689)
Nepal Bowling Green:
2.0% (202)Kentucky:
1.2% (2,276)
Bhutan Bowling Green:
1.7% (169)Kentucky:
0.8% (1,459)
Japan Bowling Green:
1.6% (161)Kentucky:
1.6% (2,893)
Place of birth for U.S.-born residents:
This state: 37,663Other state: 24,294Northeast: 2,350Midwest: 9,082South: 10,465West: 2,397 71.3% of Bowling Green residents lived in the same house 1 years ago.
Out of people who lived in different houses, 32.5% lived in this county.
Out of people who lived in different counties, 45.8% lived in Kentucky.
Bowling Green:
71.3%State average:
87.2%
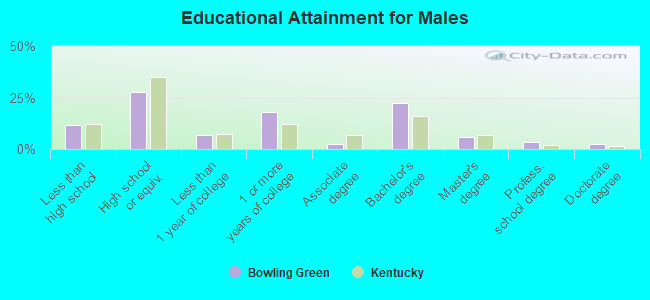
Education attainment for males 25 years and older:
No schooling: 771Nursery to 4th grade: 695th and 6th grade: 5127th and 8th grade: 3109th grade: 19710th grade: 26611th grade: 4212th grade, no diploma: 201High school graduate (or equivalency): 5,619Less than 1 year of college: 1,355Some college more than 1 year, no degree: 3,638Associate degree: 459Bachelor's degree: 4,488Master's degree: 1,186Professional school degree: 693Doctorate degree: 508
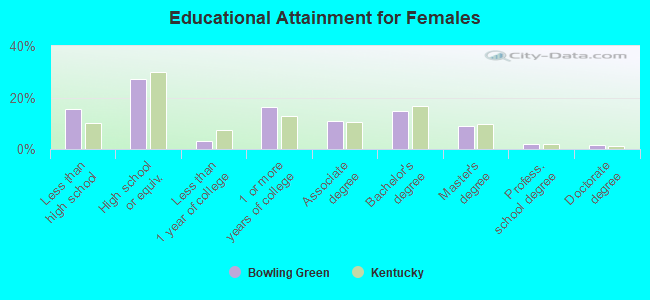
Education attainment for females 25 years and older:
No schooling: 986Nursery to 4th grade: 1785th and 6th grade: 5717th and 8th grade: 6479th grade: 20410th grade: 57411th grade: 16012th grade, no diploma: 262High school graduate (or equivalency): 6,266Less than 1 year of college: 703Some college more than 1 year, no degree: 3,711Associate degree: 2,448Bachelor's degree: 3,406Master's degree: 2,043Professional school degree: 427Doctorate degree: 337
Housing units in structures:
One, detached: 15,739One, attached: 921Two: 2,2773 or 4: 3,0335 to 9: 4,03410 to 19: 3,29620 to 49: 2,57450 or more: 1,362Mobile homes: 1,751Median worth of mobile homes: $25,923
Housing units lacking complete plumbing facilities in 2022: 0.2%Housing units lacking complete kitchen facilities in 2022: 1.5%House/condo owner moved in on average 9 years ago
Renter moved in on average 1 years ago
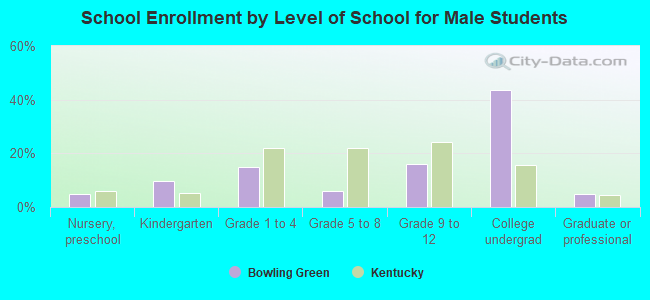
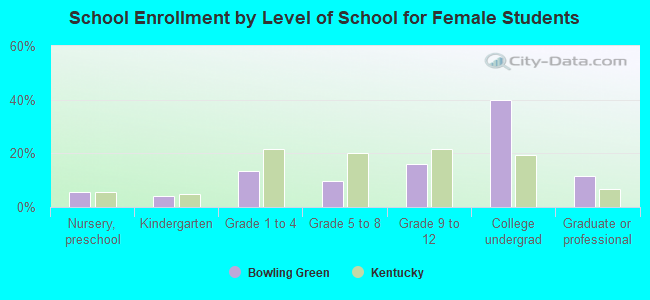
Private vs. public school enrollment:
Students in private schools in grades 1 to 8 (elementary and middle school): 41 Students in private schools in grades 9 to 12 (high school): 243 Students in private undergraduate colleges: 882