Brentwood, TN (Tennessee) Houses and Residents
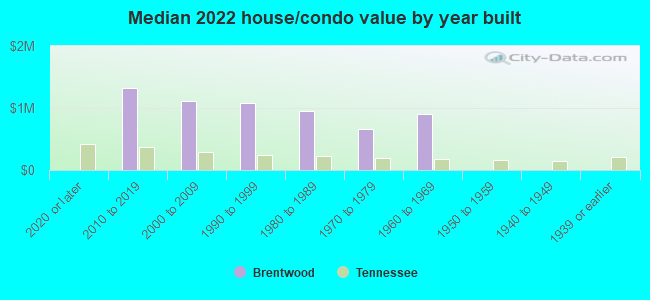
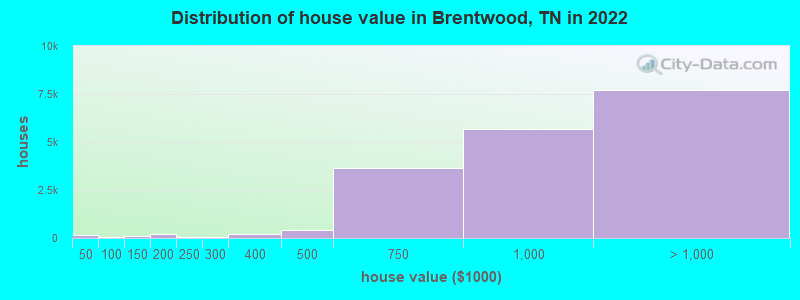
Estimated median house or condo value in 2022: $1,021,191 (it was $312,500 in 2000 )
Brentwood:
$1,021,191Tennessee:
$284,800
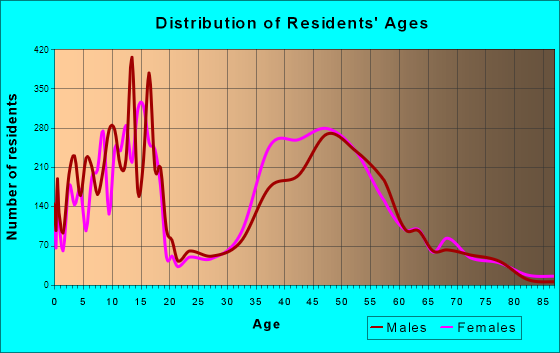
Lower value quartile - upper value quartile: $760,417 - $1,292,451Total population: 40,982 (Urban population: 21,118, Rural population: 2,707 (51 farm, 2,656 nonfarm ))
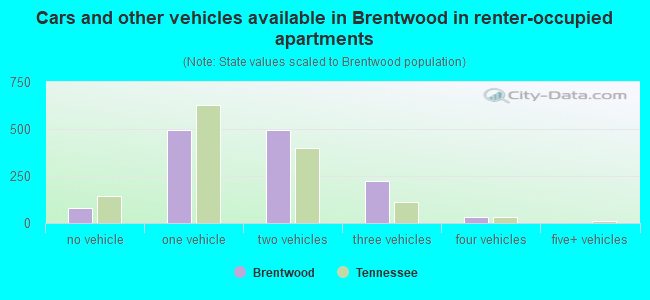
Houses: 16,529 (15,882 occupied: 14,487 owner occupied, 1,322 renter occupied )
% of renters here:
8%State:
33%
Housing density: 477 houses/condos per square mile
Median price asked for vacant for-sale houses and condos in 2022: $1,170,744.
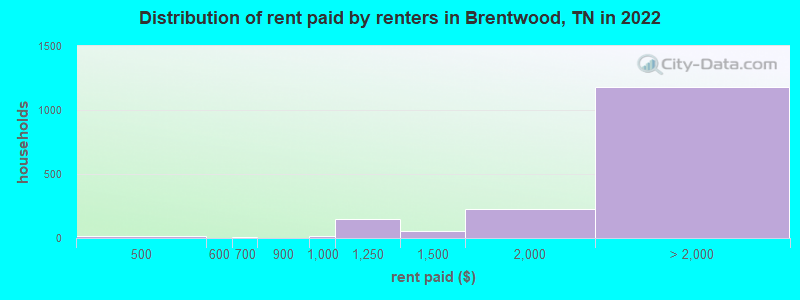
Median contract rent in 2022: over $2,000 (lower quartile is $1,696, upper quartile is over $2,000)
Median rent asked for vacant for-rent units in 2022: $6,557
Median gross rent in Brentwood, TN in 2022: over $2,000
Housing units in Brentwood with a mortgage: 9,544 (1,940 second mortgage, 151 home equity loan, 1,784 both second mortgage and home equity loan )Houses without a mortgage: 537
Median household income for houses/condos with a mortgage: $213,181
Median household income for apartments without a mortgage: $146,470
Median monthly housing costs: $2,477
Data:
Median house or condo value ($)
Median house or condo value ($ change since 2000)
Median house or condo value ($) - White
Median house or condo value ($) - Black or African American
Median house or condo value ($) - Asian
Median house or condo value ($) - Hispanic or Latino
Median house or condo value ($) - American Indian and Alaska Native
Median house or condo value ($) - Multirace
Median house or condo value ($) - Other Race
Median price asked for mobile homes ($)
Household density (households per square mile)
Mean house or condo value by units in structure - 1, detached ($)
Mean house or condo value by units in structure - 1, attached ($)
Mean house or condo value by units in structure - 2 ($)
Mean house or condo value by units in structure by units in structure - 3 or 4 ($)
Mean house or condo value by units in structure - 5 or more ($)
Mean house or condo value by units in structure - Boat, RV, van, etc. ($)
Mean house or condo value by units in structure - Mobile home ($)
Median contract rent ($)
Median contract rent - Lower quartile ($)
Median contract rent - Upper quartile ($)
Median gross rent ($)
Urban houses (%)
Rural houses (%)
Houses occupied (%)
Houses occupied (% change since 2000)
Houses owner occupied (%)
Houses owner occupied (% change since 2000)
Houses renter occupied (%)
Houses renter occupied (% change since 2000)
Vacant housing units - For rent (%)
Vacant housing units - For rent (% change since 2000)
Vacant housing units - For sale only (%)
Vacant housing units - For sale only (% change since 2000)
Vacant housing units - Rented or sold, not occupied (%)
Vacant housing units - Rented or sold, not occupied (% change since 2000)
Vacant housing units - For seasonal, recreational, or occasional use (%)
Vacant housing units - For seasonal, recreational, or occasional use (% change since 2000)
Vacant housing units - For migrant workers (%)
Vacant housing units - For migrant workers (% change since 2000)
Vacant housing units - Other vacant (%)
Vacant housing units - Other vacant (% change since 2000)
Median monthly housing costs ($)
Median household income for houses/condos with a mortgage ($)
Median household income for houses/condos without a mortgage ($)
Median household income ($)
Median household income ($) - White
Median household income ($) - Black or African American
Median household income ($) - Asian
Median household income ($) - Hispanic or Latino
Median household income ($) - American Indian and Alaska Native
Median household income ($) - Multirace
Median household income ($) - Other Race
Mortgage status - with mortgage (%)
Mortgage status - with second mortgage (%)
Mortgage status - with home equity loan (%)
Mortgage status - with both second mortgage and home equity loan (%)
Mortgage status - without a mortgage (%)
Median year house/condo built
Median year apartment built
Household type by relationship - Male householder living alone (%)
Household type by relationship - Male householder not living alone (%)
Household type by relationship - Female householder living alone (%)
Household type by relationship - Female householder not living alone (%)
Household type by relationship - Opposite-Sex spouse (%)
Household type by relationship - Same-Sex spouse (%)
Household type by relationship - Opposite-Sex unmarried partner (%)
Household type by relationship - Same-Sex unmarried partner (%)
Household type by relationship - In group quarters (%)
Size of family households - 2-person household (%)
Size of family households - 3-person household (%)
Size of family households - 4-person household (%)
Size of family households - 5-person household (%)
Size of family households - 6-person household (%)
Size of family households - 7-or-more-person household (%)
Size of nonfamily households - 1-person household (%)
Size of nonfamily households - 2-person household (%)
Size of nonfamily households - 3-person household (%)
Size of nonfamily households - 4-person household (%)
Size of nonfamily households - 5-person household (%)
Size of nonfamily households - 6-person household (%)
Size of nonfamily households - 7-or-moreperson household (%)
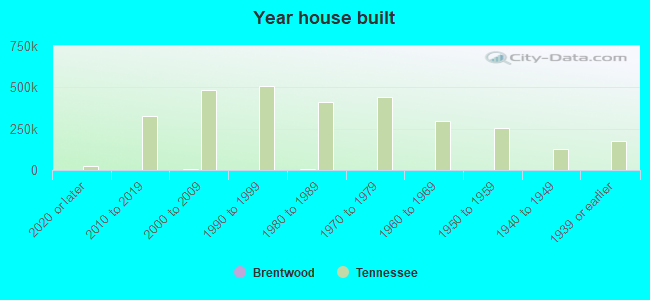
Year house built - Built 2010 or later (%)
Year house built - Built 2000 to 2009 (%)
Year house built - Built 1990 to 1999 (%)
Year house built - Built 1980 to 1989 (%)
Year house built - Built 1970 to 1979 (%)
Year house built - Built 1960 to 1969 (%)
Year house built - Built 1950 to 1959 (%)
Year house built - Built 1940 to 1949 (%)
Year house built - Built 1939 or earlier (%)
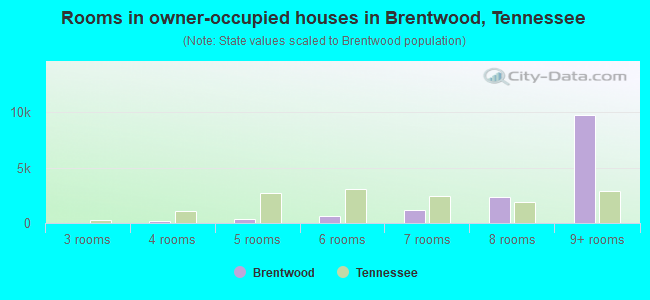
Median number of rooms in houses and condos
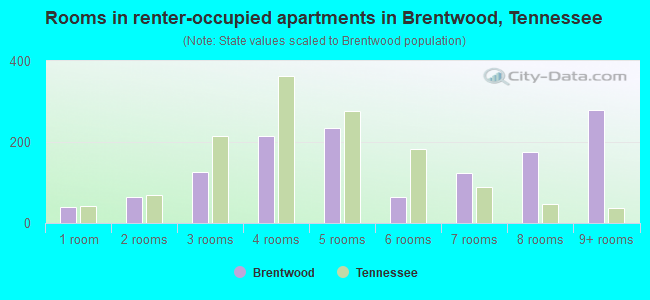
Median number of rooms in apartments
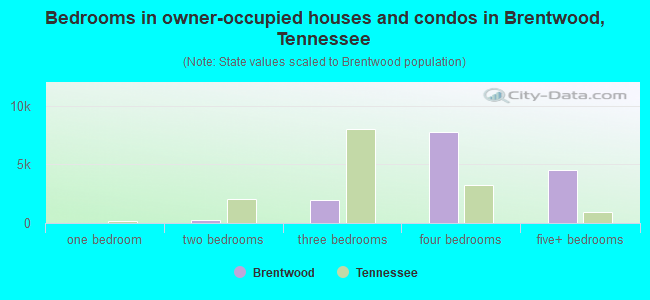
Median number of bedrooms in owner occupied houses
Mean number of bedrooms in owner occupied houses
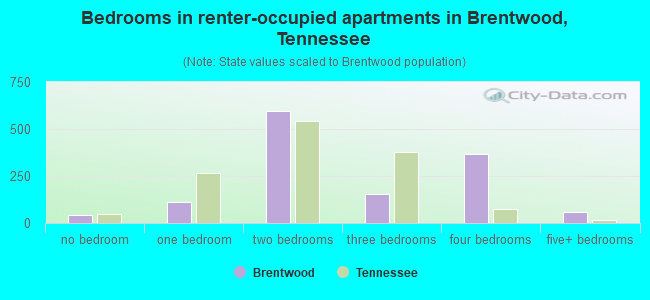
Median number of bedrooms in renter occupied houses
Mean number of bedrooms in renter occupied houses
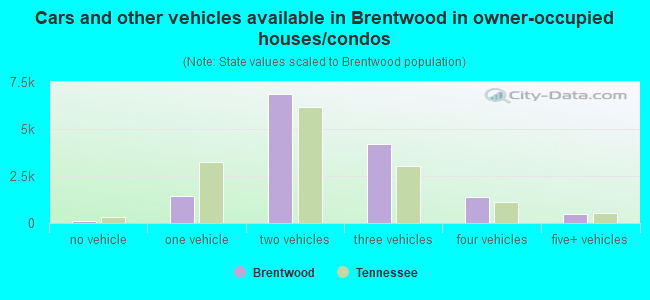
Median number of vehichles in owner occupied houses
Mean number of vehichles in owner occupied houses
Median number of vehichles in renter occupied houses
Mean number of vehichles in renter occupied houses
Rooms in owner-occupied houses - 1 room (%)
Rooms in owner-occupied houses - 2 rooms (%)
Rooms in owner-occupied houses - 3 rooms (%)
Rooms in owner-occupied houses - 4 rooms (%)
Rooms in owner-occupied houses - 5 rooms (%)
Rooms in owner-occupied houses - 6 rooms (%)
Rooms in owner-occupied houses - 7 rooms (%)
Rooms in owner-occupied houses - 8 rooms (%)
Rooms in owner-occupied houses - 9+ rooms (%)
Rooms in renter-occupied houses - 1 room (%)
Rooms in renter-occupied houses - 2 rooms (%)
Rooms in renter-occupied houses - 3 rooms (%)
Rooms in renter-occupied houses - 4 rooms (%)
Rooms in renter-occupied houses - 5 rooms (%)
Rooms in renter-occupied houses - 6 rooms (%)
Rooms in renter-occupied houses - 7 rooms (%)
Rooms in renter-occupied houses - 8 rooms (%)
Rooms in renter-occupied houses - 9+ rooms (%)
Bedrooms in owner-occupied houses - no bedrooms (%)
Bedrooms in owner-occupied houses - 1 bedroom (%)
Bedrooms in owner-occupied houses - 2 bedrooms (%)
Bedrooms in owner-occupied houses - 3 bedrooms (%)
Bedrooms in owner-occupied houses - 4 bedrooms (%)
Bedrooms in owner-occupied houses - 5+ bedrooms (%)
Bedrooms in renter-occupied houses - no bedrooms (%)
Bedrooms in renter-occupied houses - 1 bedroom (%)
Bedrooms in renter-occupied houses - 2 bedrooms (%)
Bedrooms in renter-occupied houses - 3 bedrooms (%)
Bedrooms in renter-occupied houses - 4 bedrooms (%)
Bedrooms in renter-occupied houses - 5+ bedrooms (%)
Vehicles available in owner-occupied houses - no vehicle available (%)
Vehicles available in owner-occupied houses - 1 vehicle available(%)
Vehicles available in owner-occupied houses - 2 Vehicles available (%)
Vehicles available in owner-occupied houses - 3 Vehicles available (%)
Vehicles available in owner-occupied houses - 4 Vehicles available (%)
Vehicles available in owner-occupied houses - 5+ Vehicles available (%)
Vehicles available in renter-occupied houses - no vehicle available (%)
Vehicles available in renter-occupied houses - 1 vehicle available (%)
Vehicles available in renter-occupied houses - 2 Vehicles available (%)
Vehicles available in renter-occupied houses - 3 Vehicles available (%)
Vehicles available in renter-occupied houses - 4 Vehicles available (%)
Vehicles available in renter-occupied houses - 5+ Vehicles available (%)
Housing units in structures - 1, detached (%)
Housing units in structures - 1, attached (%)
Housing units in structures - 2 (%)
Housing units in structures - 3 or 4 (%)
Housing units in structures - 5 to 9 (%)
Housing units in structures - 10 to 19 (%)
Housing units in structures - 20 to 49 (%)
Housing units in structures - 50 or more (%)
Housing units in structures - Mobile home (%)
Housing units in structures - Boat, RV, van, etc. (%)
Housing units in structures - Owners - 1, detached (%)
Housing units in structures - Owners - 1, attached (%)
Housing units in structures - Owners - 2 (%)
Housing units in structures - Owners - 3 or 4 (%)
Housing units in structures - Owners - 5 to 9 (%)
Housing units in structures - Owners - 10 to 19 (%)
Housing units in structures - Owners - 20 to 49 (%)
Housing units in structures - Owners - 50 or more (%)
Housing units in structures - Owners - Mobile home (%)
Housing units in structures - Owners - Boat, RV, van, etc. (%)
Housing units in structures - Renters - 1, detached (%)
Housing units in structures - Renters - 1, attached (%)
Housing units in structures - Renters - 2 (%)
Housing units in structures - Renters - 3 or 4 (%)
Housing units in structures - Renters - 5 to 9 (%)
Housing units in structures - Renters - 10 to 19 (%)
Housing units in structures - Renters - 20 to 49 (%)
Housing units in structures - Renters - 50 or more (%)
Housing units in structures - Renters - Mobile home (%)
Housing units in structures - Renters - Boat, RV, van, etc. (%)
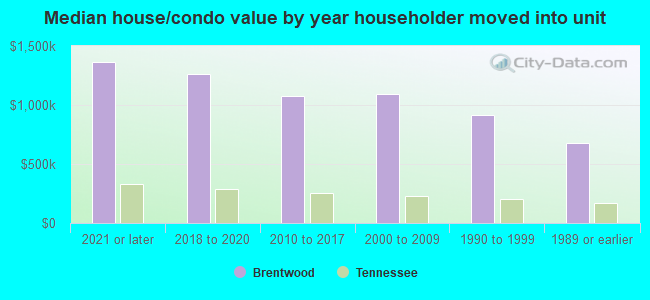
House/condo owner moved in on average (years ago)
Renter moved in on average (years ago)
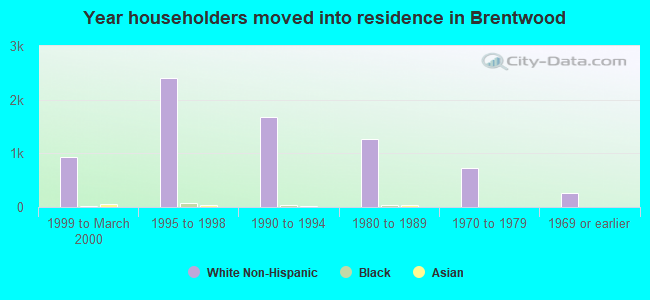
Year householder moved into unit - Moved in 1999 to March 2000 (%)
Year householder moved into unit - Moved in 1999 to March 2000 (%) - White
Year householder moved into unit - Moved in 1999 to March 2000 (%) - Black or African American
Year householder moved into unit - Moved in 1999 to March 2000 (%) - Asian
Year householder moved into unit - Moved in 1999 to March 2000 (%) - Hispanic or Latino
Year householder moved into unit - Moved in 1999 to March 2000 (%) - American Indian and Alaska Native
Year householder moved into unit - Moved in 1999 to March 2000 (%) - Multirace
Year householder moved into unit - Moved in 1999 to March 2000 (%) - Other Race
Year householder moved into unit - Moved in 1995 to 1998 (%)
Year householder moved into unit - Moved in 1995 to 1998 (%) - White
Year householder moved into unit - Moved in 1995 to 1998 (%) - Black or African American
Year householder moved into unit - Moved in 1995 to 1998 (%) - Asian
Year householder moved into unit - Moved in 1995 to 1998 (%) - Hispanic or Latino
Year householder moved into unit - Moved in 1995 to 1998 (%) - American Indian and Alaska Native
Year householder moved into unit - Moved in 1995 to 1998 (%) - Multirace
Year householder moved into unit - Moved in 1995 to 1998 (%) - Other Race
Year householder moved into unit - Moved in 1990 to 1994 (%)
Year householder moved into unit - Moved in 1990 to 1994 (%) - White
Year householder moved into unit - Moved in 1990 to 1994 (%) - Black or African American
Year householder moved into unit - Moved in 1990 to 1994 (%) - Asian
Year householder moved into unit - Moved in 1990 to 1994 (%) - Hispanic or Latino
Year householder moved into unit - Moved in 1990 to 1994 (%) - American Indian and Alaska Native
Year householder moved into unit - Moved in 1990 to 1994 (%) - Multirace
Year householder moved into unit - Moved in 1990 to 1994 (%) - Other Race
Year householder moved into unit - Moved in 1980 to 1989 (%)
Year householder moved into unit - Moved in 1980 to 1989 (%) - White
Year householder moved into unit - Moved in 1980 to 1989 (%) - Black or African American
Year householder moved into unit - Moved in 1980 to 1989 (%) - Asian
Year householder moved into unit - Moved in 1980 to 1989 (%) - Hispanic or Latino
Year householder moved into unit - Moved in 1980 to 1989 (%) - American Indian and Alaska Native
Year householder moved into unit - Moved in 1980 to 1989 (%) - Multirace
Year householder moved into unit - Moved in 1980 to 1989 (%) - Other Race
Year householder moved into unit - Moved in 1970 to 1979 (%)
Year householder moved into unit - Moved in 1970 to 1979 (%) - White
Year householder moved into unit - Moved in 1970 to 1979 (%) - Black or African American
Year householder moved into unit - Moved in 1970 to 1979 (%) - Asian
Year householder moved into unit - Moved in 1970 to 1979 (%) - Hispanic or Latino
Year householder moved into unit - Moved in 1970 to 1979 (%) - American Indian and Alaska Native
Year householder moved into unit - Moved in 1970 to 1979 (%) - Multirace
Year householder moved into unit - Moved in 1970 to 1979 (%) - Other Race
Year householder moved into unit - Moved in 1969 or earlier (%)
Year householder moved into unit - Moved in 1969 or earlier (%) - White
Year householder moved into unit - Moved in 1969 or earlier (%) - Black or African American
Year householder moved into unit - Moved in 1969 or earlier (%) - Asian
Year householder moved into unit - Moved in 1969 or earlier (%) - Hispanic or Latino
Year householder moved into unit - Moved in 1969 or earlier (%) - American Indian and Alaska Native
Year householder moved into unit - Moved in 1969 or earlier (%) - Multirace
Year householder moved into unit - Moved in 1969 or earlier (%) - Other Race
Housing units lacking complete plumbing facilities (%)
Housing units lacking complete kitchen facilities (%)
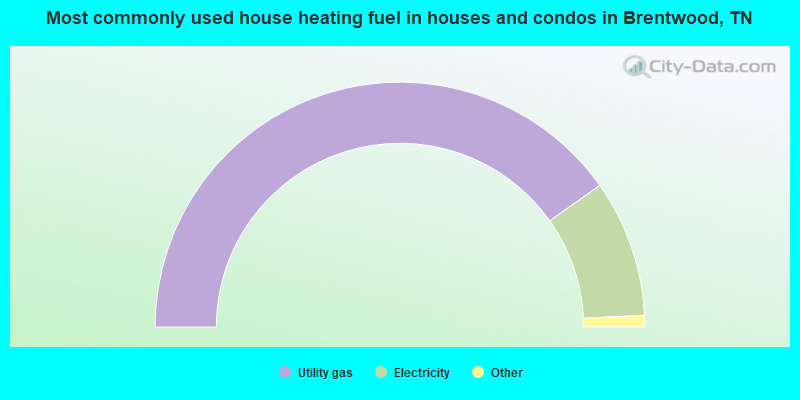
House heating fuel used in houses and condos - Utility gas (%)
House heating fuel used in houses and condos - Bottled, tank, or LP gas (%)
House heating fuel used in houses and condos - Electricity (%)
House heating fuel used in houses and condos - Fuel oil, kerosene, etc. (%)
House heating fuel used in houses and condos - Coal or coke (%)
House heating fuel used in houses and condos - Wood (%)
House heating fuel used in houses and condos - Solar energy (%)
House heating fuel used in houses and condos - Other fuel (%)
House heating fuel used in houses and condos - No fuel used (%)
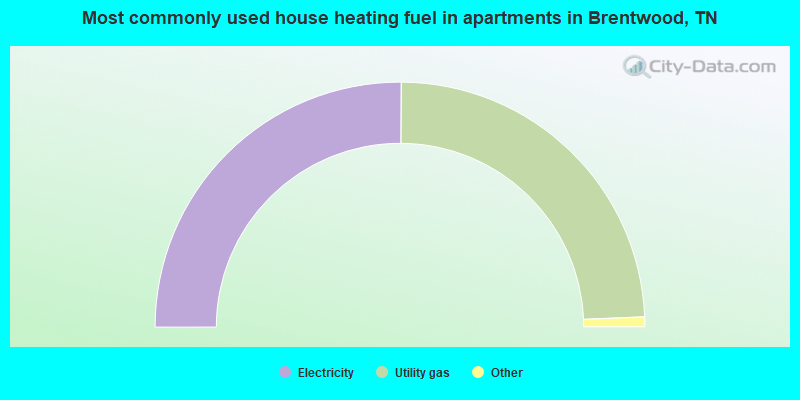
House heating fuel used in apartments - Utility gas (%)
House heating fuel used in apartments - Bottled, tank, or LP gas (%)
House heating fuel used in apartments - Electricity (%)
House heating fuel used in apartments - Fuel oil, kerosene, etc. (%)
House heating fuel used in apartments - Coal or coke (%)
House heating fuel used in apartments - Wood (%)
House heating fuel used in apartments - Solar energy (%)
House heating fuel used in apartments - Other fuel (%)
House heating fuel used in apartments - No fuel used (%)
Latest news about housing in Brentwood, TN collected exclusively by city-data.com from local newspapers, TV, and radio stations
Median year house/condo built: 1996Median year apartment built: 2006Household type by relationship:
Households: 46,976
Male householders: 8,736 (512 living alone ), Female householders: 6,856 (1,567 living alone )12,226 spouses (12,149 opposite-sex spouses ), 285 unmarried partners , (280 opposite-sex unmarried partners ), 16,928 children (16,015 natural , 607 adopted , 304 stepchildren ), 649 grandchildren , 79 brothers or sisters , 527 parents , 0 foster children , 276 other relatives , 297 non-relatives In group quarters: 113
Size of family households: 5,748 2-persons , 3,146 3-persons , 3,192 4-persons , 1,660 5-persons , 338 6-persons , 96 7-or-more-persons .
Size of nonfamily households: 1,864 1-person , 77 2-persons .
10,787 married couples with children. single-parent households (283 men , 626 women ).
89.6% of residents of Brentwood speak English at home. of residents speak Spanish at home (77% speak English very well , 16% speak English well , 6% speak English not well , 1% don't speak English at all ).of residents speak other Indo-European language at home (86% speak English very well , 9% speak English well , 5% speak English not well , 1% don't speak English at all ).of residents speak Asian or Pacific Island language at home (82% speak English very well , 14% speak English well , 4% don't speak English at all ).of residents speak other language at home (60% speak English very well , 29% speak English well , 11% speak English not well ).
Foreign born population: 4,721 (10.0%)of them are naturalized citizens )
Median number of rooms in houses and condos:
Median number of rooms in apartments
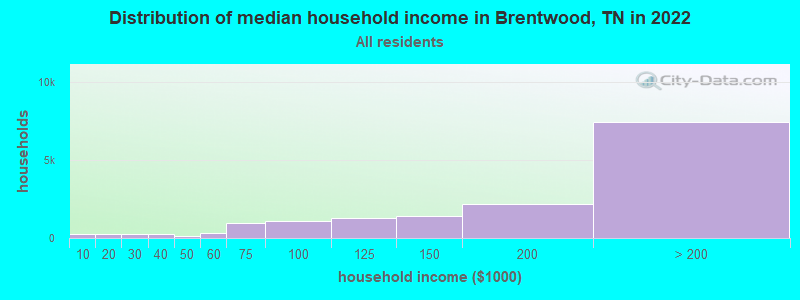
Brentwood, TN household income distribution 283 Less than $10,000259 $10,000 to $19,999273 $20,000 to $29,999257 $30,000 to $39,999137 $40,000 to $49,999299 $50,000 to $59,999972 $60,000 to $74,9991,118 $75,000 to $99,9991,284 $100,000 to $124,9991,430 $125,000 to $149,9992,197 $150,000 to $199,9997,429 $200,000 or more
Home value of owner - occupied houses in 2022 in Brentwood, TN 137 Less than $10,0007 $10,000 to $14,99911 $20,000 to $24,9993 $40,000 to $49,99912 $50,000 to $59,99910 $60,000 to $69,9995 $70,000 to $79,9996 $80,000 to $89,99939 $90,000 to $99,99946 $100,000 to $124,99937 $125,000 to $149,999118 $150,000 to $174,99989 $175,000 to $199,99955 $200,000 to $249,99945 $250,000 to $299,999207 $300,000 to $399,999417 $400,000 to $499,9993,627 $500,000 to $749,9995,694 $750,000 to $999,9994,462 $1,000,000 to $1,499,9992,019 $1,500,000 to $1,999,9991,222 $2,000,000 or moreRent paid by renters in 2022 in Brentwood, TN 7 $200 to $24911 $450 to $49911 $600 to $64914 $900 to $999147 $1,000 to $1,24956 $1,250 to $1,499228 $1,500 to $1,999408 $2,000 to $2,499242 $2,500 to $2,99958 $3,000 to $3,499387 $3,500 or more86 No cash rent
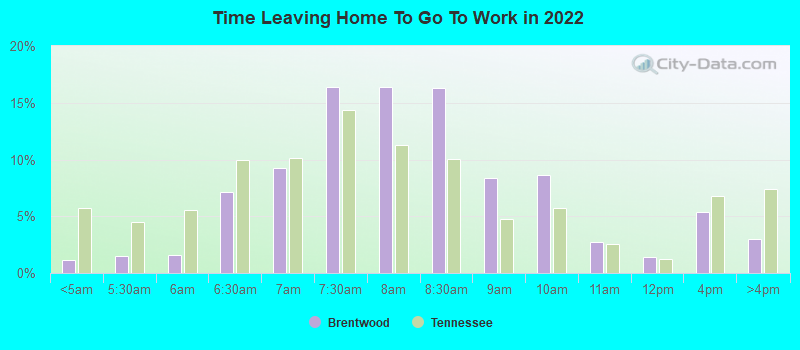
Percentage of workers working in this county: 62.8%Number of people working at home: 6,852 (30.6% of all workers )
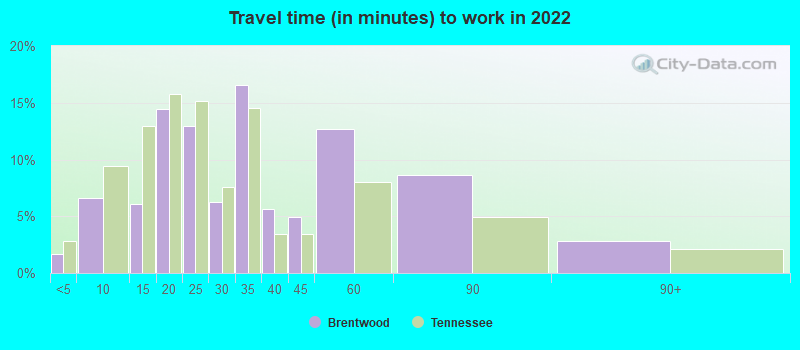
Travel time to work (commute)
Less than 5 minutes: 3845 to 9 minutes: 99710 to 14 minutes: 1,43915 to 19 minutes: 2,74120 to 24 minutes: 2,57925 to 29 minutes: 1,43630 to 34 minutes: 3,55335 to 39 minutes: 70040 to 44 minutes: 65845 to 59 minutes: 85560 to 89 minutes: 25890 or more minutes: 442
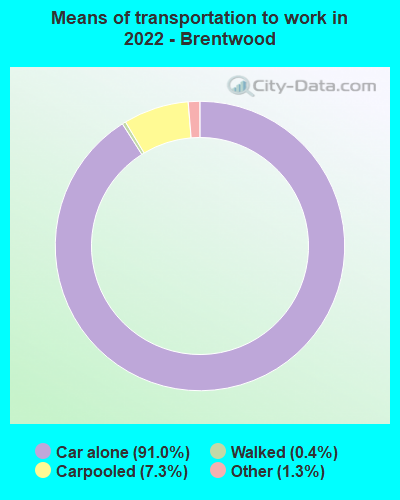
Means of transportation to work:
Drove a car alone: 27,540 (72.7%)Carpooled: 2,765 (7.3%)Subway or elevated rail : 14 (0.0%)Taxi: 511 (1.3%)Bicycle: 6 (0.0%)Walked: 103 (0.3%)Worked at home: 6,128 (16.2%)
Unemployment by race in 2022
Unemployment rate for White non-Hispanic residents 2.4% Males2.4% FemalesUnemployment rate for Black residents 1.4% Males1.2% FemalesUnemployment rate for Asian residents 0.2% FemalesUnemployment rate for other race residents 30.8% FemalesUnemployment rate for two or more race residents 2.2% Males7.9% FemalesUnemployment rate for Hispanic or Latino residents 8.1% Females
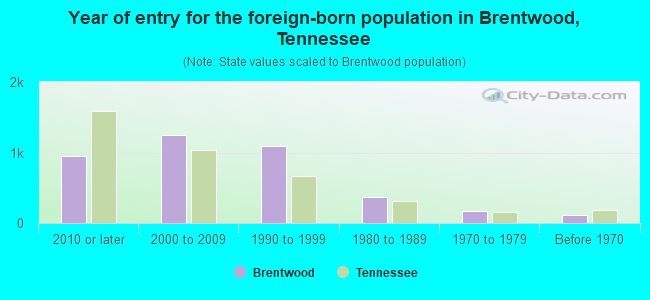
Year of entry for the foreign-born population in Brentwood, Tennessee
948 2010 or later 1,244 2000 to 2009 1,088 1990 to 1999 374 1980 to 1989 173 1970 to 1979 114 Before 1970
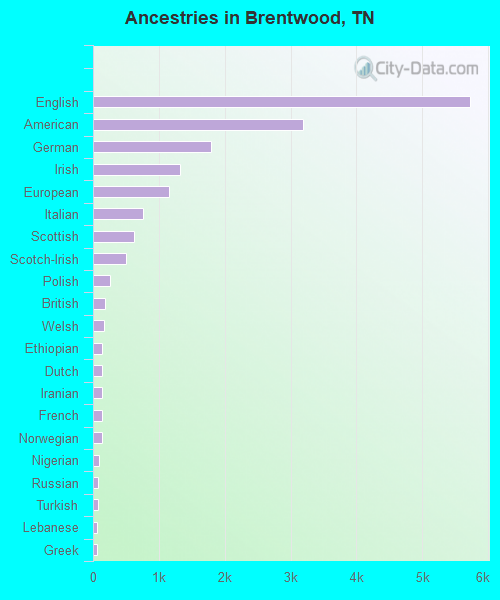
First ancestries reported:
English: 5,726 (24.0%)
American: 3,189 (13.4%)
German: 1,793 (7.5%)
Irish: 1,326 (5.6%)
European: 1,148 (4.8%)
Italian: 756 (3.2%)
Scottish: 619 (2.6%)
Scotch-Irish: 508 (2.1%)
Polish: 251 (1.1%)
British: 185 (0.8%)
Welsh: 173 (0.7%)
Ethiopian: 144 (0.6%)
Dutch: 143 (0.6%)
Iranian: 140 (0.6%)
French: 140 (0.6%)
Norwegian: 139 (0.6%)
Nigerian: 90 (0.4%)
Russian: 82 (0.3%)
Turkish: 70 (0.3%)
Lebanese: 65 (0.3%)
Greek: 58 (0.2%)
Lithuanian: 50 (0.2%)
Danish: 50 (0.2%)
French Canadian: 47 (0.2%)
Canadian: 47 (0.2%)
Latvian: 46 (0.2%)
Cape Verdean: 46 (0.2%)
Egyptian: 43 (0.2%)
Swiss: 38 (0.2%)
Hungarian: 36 (0.2%)
Northern European: 35 (0.1%)
South African: 35 (0.1%)
Scandinavian: 34 (0.1%)
Eastern European: 29 (0.1%)
Serbian: 20 (0.08%)
Jamaican: 18 (0.08%)
Ukrainian: 18 (0.08%)
Brazilian: 16 (0.07%)
Belgian: 15 (0.06%)
Croatian: 12 (0.05%)
African: 10 (0.04%)
Portuguese: 9 (0.04%)
Romanian: 9 (0.04%)
Slovak: 9 (0.04%)
Swedish: 9 (0.04%)
Austrian: 7 (0.03%)
Celtic: 7 (0.03%)
Estonian: 6 (0.03%)
Armenian: 5 (0.02%)
Bulgarian: 4 (0.02%)
Icelander: 4 (0.02%)
Finnish: 4 (0.02%)
Most common places of birth for foreign-born residents (%): India Brentwood:
22.6% (957)Tennessee:
6.1% (23,079)
Canada Brentwood:
8.1% (344)Tennessee:
2.7% (10,295)
Korea Brentwood:
8.1% (341)Tennessee:
2.3% (8,490)
China, excluding Hong Kong and Taiwan Brentwood:
7.4% (313)Tennessee:
3.3% (12,582)
Mexico Brentwood:
6.0% (254)Tennessee:
23.0% (86,435)
Vietnam Brentwood:
5.3% (226)Tennessee:
2.4% (8,894)
Other Eastern Asia Brentwood:
3.2% (136)Tennessee:
0.0% (159)
Iran Brentwood:
3.2% (134)Tennessee:
0.8% (2,872)
Brazil Brentwood:
2.6% (111)Tennessee:
0.8% (3,098)
Ethiopia Brentwood:
2.6% (108)Tennessee:
1.4% (5,265)
Honduras Brentwood:
2.2% (91)Tennessee:
4.6% (17,433)
South Africa Brentwood:
2.0% (84)Tennessee:
0.5% (1,731)
Egypt Brentwood:
1.9% (81)Tennessee:
3.1% (11,761)
Nigeria Brentwood:
1.9% (81)Tennessee:
1.2% (4,662)
Place of birth for U.S.-born residents:
This state: 18,365Other state: 23,290Northeast: 4,005Midwest: 6,677South: 9,839West: 2,832 91.7% of Brentwood residents lived in the same house 1 years ago.
Out of people who lived in different houses, 35.0% lived in this county.
Out of people who lived in different counties, 50.2% lived in Tennessee.
Brentwood:
91.7%State average:
87.0%
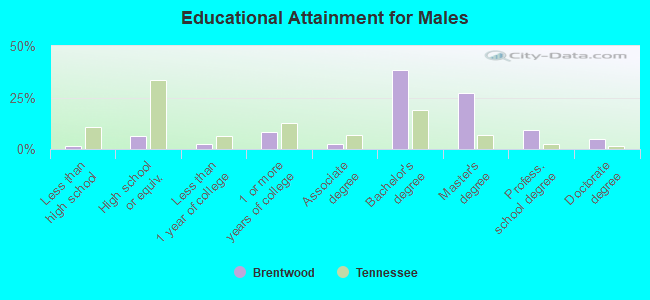
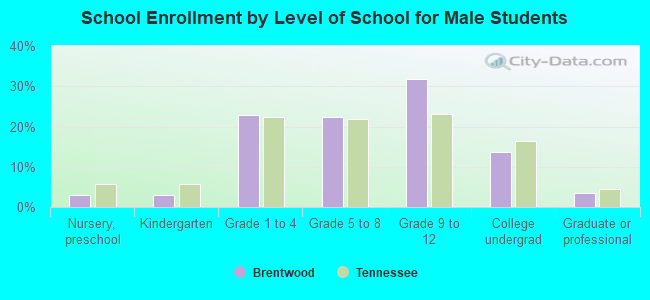
Education attainment for males 25 years and older:
No schooling: 84Nursery to 4th grade: 05th and 6th grade: 207th and 8th grade: 669th grade: 310th grade: 011th grade: 1412th grade, no diploma: 23High school graduate (or equivalency): 895Less than 1 year of college: 347Some college more than 1 year, no degree: 1,221Associate degree: 365Bachelor's degree: 5,660Master's degree: 3,980Professional school degree: 1,332Doctorate degree: 736
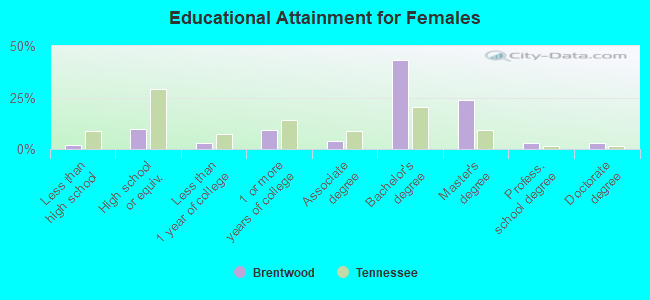
Education attainment for females 25 years and older:
No schooling: 126Nursery to 4th grade: 05th and 6th grade: 117th and 8th grade: 79th grade: 1910th grade: 3311th grade: 1412th grade, no diploma: 102High school graduate (or equivalency): 1,529Less than 1 year of college: 459Some college more than 1 year, no degree: 1,448Associate degree: 623Bachelor's degree: 6,933Master's degree: 3,835Professional school degree: 463Doctorate degree: 484
Housing units in structures:
One, detached: 14,918One, attached: 571Two: 243 or 4: 2020 to 49: 7450 or more: 899Mobile homes: 12Boats, RVs, vans, etc.: 7Housing units lacking complete plumbing facilities in 2022: 0.1%Housing units lacking complete kitchen facilities in 2022: 1.8%Private vs. public school enrollment:
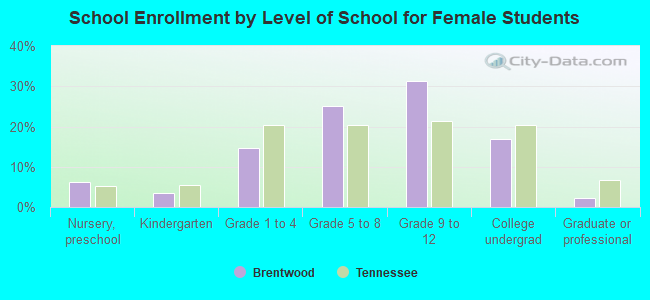
Students in private schools in grades 1 to 8 (elementary and middle school): 797 Here:
12.5%Tennessee:
15.0%
Students in private schools in grades 9 to 12 (high school): 869 Here:
18.5%Tennessee:
16.2%
Students in private undergraduate colleges: 662 Here:
26.5%Tennessee:
23.5%