Bristol, CT (Connecticut) Houses and Residents
Estimated median house or condo value in 2022: $252,811 (it was $123,700 in 2000 )
Bristol:
$252,811Connecticut:
$347,200
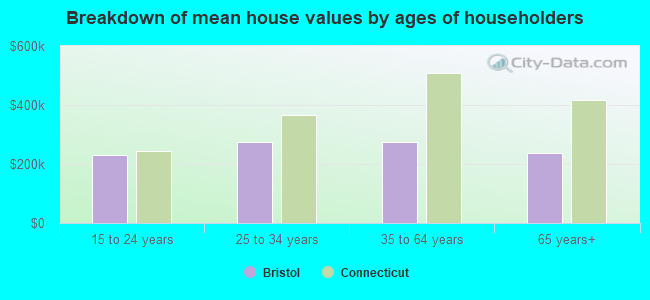
Lower value quartile - upper value quartile: $195,835 - $320,295Mean price in 2022: Detached houses: $279,210 Here:
$279,210State:
$503,946
Townhouses or other attached units: $170,054 Here:
$170,054State:
$304,959
In 2-unit structures: $207,419 Here:
$207,419State:
$304,133
In 3-to-4-unit structures: $303,038 Here:
$303,038State:
$272,970
In 5-or-more-unit structures: $118,073 Here:
$118,073State:
$249,308
Mobile homes: $85,742 Here:
$85,742State:
$151,361
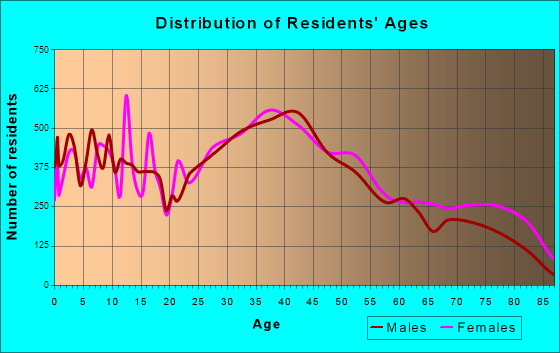
Total population: 60,570 (Urban population: 59,766, Rural population: 296 (all nonfarm) )
Houses: 26,310 (24,216 occupied: 15,923 owner occupied, 8,559 renter occupied )
% of renters here:
35%State:
34%
Housing density: 993 houses/condos per square mile
Median price asked for vacant for-sale houses and condos in 2022: $332,908.
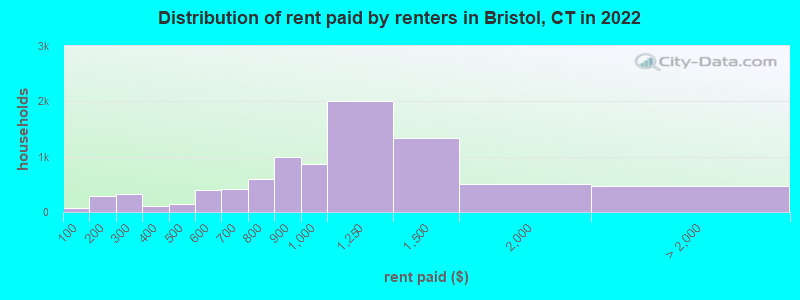
Median contract rent in 2022: $997 (lower quartile is $763, upper quartile is $1,270)
Median rent asked for vacant for-rent units in 2022: $660
Median gross rent in Bristol, CT in 2022: $1,215
Housing units in Bristol with a mortgage: 11,146 (1,298 second mortgage, 168 home equity loan, 884 both second mortgage and home equity loan )Houses without a mortgage: 474
Median household income for houses/condos with a mortgage: $113,903
Median household income for apartments without a mortgage: $88,890
Median monthly housing costs: $1,402
Data:
Median house or condo value ($)
Median house or condo value ($ change since 2000)
Median house or condo value ($) - White
Median house or condo value ($) - Black or African American
Median house or condo value ($) - Asian
Median house or condo value ($) - Hispanic or Latino
Median house or condo value ($) - American Indian and Alaska Native
Median house or condo value ($) - Multirace
Median house or condo value ($) - Other Race
Median price asked for mobile homes ($)
Household density (households per square mile)
Mean house or condo value by units in structure - 1, detached ($)
Mean house or condo value by units in structure - 1, attached ($)
Mean house or condo value by units in structure - 2 ($)
Mean house or condo value by units in structure by units in structure - 3 or 4 ($)
Mean house or condo value by units in structure - 5 or more ($)
Mean house or condo value by units in structure - Boat, RV, van, etc. ($)
Mean house or condo value by units in structure - Mobile home ($)
Median contract rent ($)
Median contract rent - Lower quartile ($)
Median contract rent - Upper quartile ($)
Median gross rent ($)
Urban houses (%)
Rural houses (%)
Houses occupied (%)
Houses occupied (% change since 2000)
Houses owner occupied (%)
Houses owner occupied (% change since 2000)
Houses renter occupied (%)
Houses renter occupied (% change since 2000)
Vacant housing units - For rent (%)
Vacant housing units - For rent (% change since 2000)
Vacant housing units - For sale only (%)
Vacant housing units - For sale only (% change since 2000)
Vacant housing units - Rented or sold, not occupied (%)
Vacant housing units - Rented or sold, not occupied (% change since 2000)
Vacant housing units - For seasonal, recreational, or occasional use (%)
Vacant housing units - For seasonal, recreational, or occasional use (% change since 2000)
Vacant housing units - For migrant workers (%)
Vacant housing units - For migrant workers (% change since 2000)
Vacant housing units - Other vacant (%)
Vacant housing units - Other vacant (% change since 2000)
Median monthly housing costs ($)
Median household income for houses/condos with a mortgage ($)
Median household income for houses/condos without a mortgage ($)
Median household income ($)
Median household income ($) - White
Median household income ($) - Black or African American
Median household income ($) - Asian
Median household income ($) - Hispanic or Latino
Median household income ($) - American Indian and Alaska Native
Median household income ($) - Multirace
Median household income ($) - Other Race
Mortgage status - with mortgage (%)
Mortgage status - with second mortgage (%)
Mortgage status - with home equity loan (%)
Mortgage status - with both second mortgage and home equity loan (%)
Mortgage status - without a mortgage (%)
Median year house/condo built
Median year apartment built
Household type by relationship - Male householder living alone (%)
Household type by relationship - Male householder not living alone (%)
Household type by relationship - Female householder living alone (%)
Household type by relationship - Female householder not living alone (%)
Household type by relationship - Opposite-Sex spouse (%)
Household type by relationship - Same-Sex spouse (%)
Household type by relationship - Opposite-Sex unmarried partner (%)
Household type by relationship - Same-Sex unmarried partner (%)
Household type by relationship - In group quarters (%)
Size of family households - 2-person household (%)
Size of family households - 3-person household (%)
Size of family households - 4-person household (%)
Size of family households - 5-person household (%)
Size of family households - 6-person household (%)
Size of family households - 7-or-more-person household (%)
Size of nonfamily households - 1-person household (%)
Size of nonfamily households - 2-person household (%)
Size of nonfamily households - 3-person household (%)
Size of nonfamily households - 4-person household (%)
Size of nonfamily households - 5-person household (%)
Size of nonfamily households - 6-person household (%)
Size of nonfamily households - 7-or-moreperson household (%)
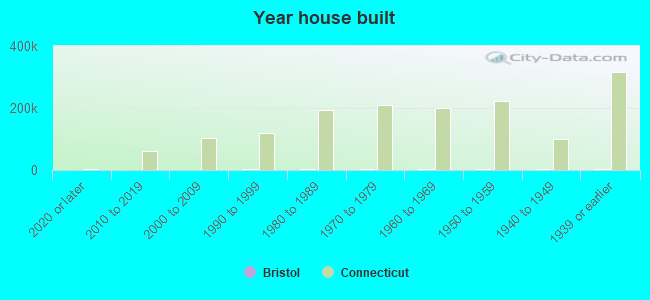
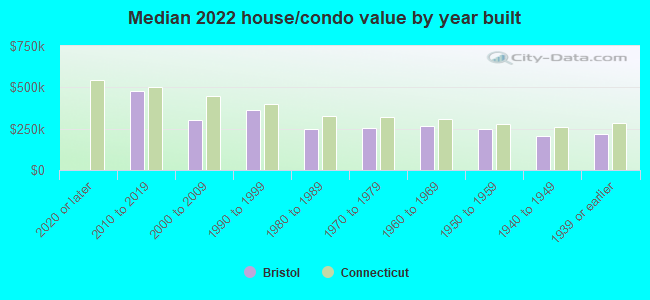
Year house built - Built 2010 or later (%)
Year house built - Built 2000 to 2009 (%)
Year house built - Built 1990 to 1999 (%)
Year house built - Built 1980 to 1989 (%)
Year house built - Built 1970 to 1979 (%)
Year house built - Built 1960 to 1969 (%)
Year house built - Built 1950 to 1959 (%)
Year house built - Built 1940 to 1949 (%)
Year house built - Built 1939 or earlier (%)
Median number of rooms in houses and condos
Median number of rooms in apartments
Median number of bedrooms in owner occupied houses
Mean number of bedrooms in owner occupied houses
Median number of bedrooms in renter occupied houses
Mean number of bedrooms in renter occupied houses
Median number of vehichles in owner occupied houses
Mean number of vehichles in owner occupied houses
Median number of vehichles in renter occupied houses
Mean number of vehichles in renter occupied houses
Rooms in owner-occupied houses - 1 room (%)
Rooms in owner-occupied houses - 2 rooms (%)
Rooms in owner-occupied houses - 3 rooms (%)
Rooms in owner-occupied houses - 4 rooms (%)
Rooms in owner-occupied houses - 5 rooms (%)
Rooms in owner-occupied houses - 6 rooms (%)
Rooms in owner-occupied houses - 7 rooms (%)
Rooms in owner-occupied houses - 8 rooms (%)
Rooms in owner-occupied houses - 9+ rooms (%)
Rooms in renter-occupied houses - 1 room (%)
Rooms in renter-occupied houses - 2 rooms (%)
Rooms in renter-occupied houses - 3 rooms (%)
Rooms in renter-occupied houses - 4 rooms (%)
Rooms in renter-occupied houses - 5 rooms (%)
Rooms in renter-occupied houses - 6 rooms (%)
Rooms in renter-occupied houses - 7 rooms (%)
Rooms in renter-occupied houses - 8 rooms (%)
Rooms in renter-occupied houses - 9+ rooms (%)
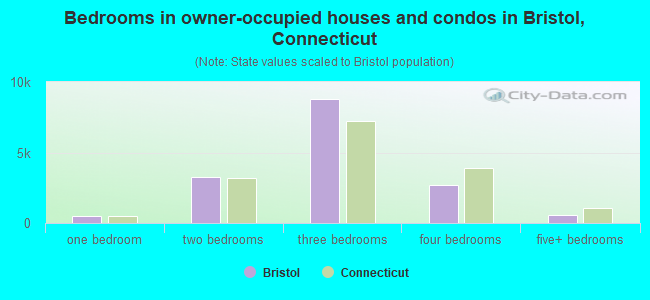
Bedrooms in owner-occupied houses - no bedrooms (%)
Bedrooms in owner-occupied houses - 1 bedroom (%)
Bedrooms in owner-occupied houses - 2 bedrooms (%)
Bedrooms in owner-occupied houses - 3 bedrooms (%)
Bedrooms in owner-occupied houses - 4 bedrooms (%)
Bedrooms in owner-occupied houses - 5+ bedrooms (%)
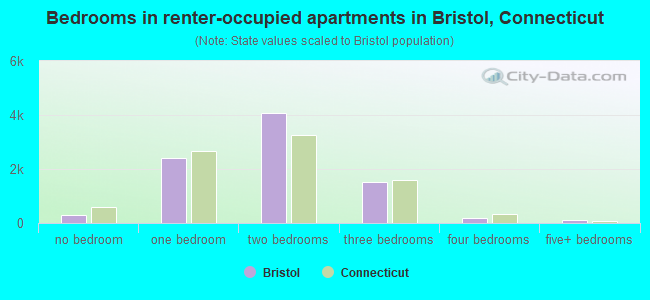
Bedrooms in renter-occupied houses - no bedrooms (%)
Bedrooms in renter-occupied houses - 1 bedroom (%)
Bedrooms in renter-occupied houses - 2 bedrooms (%)
Bedrooms in renter-occupied houses - 3 bedrooms (%)
Bedrooms in renter-occupied houses - 4 bedrooms (%)
Bedrooms in renter-occupied houses - 5+ bedrooms (%)
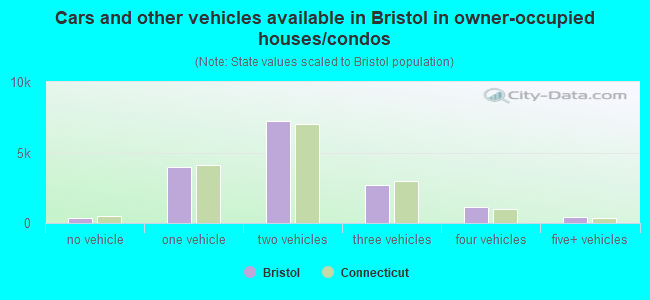
Vehicles available in owner-occupied houses - no vehicle available (%)
Vehicles available in owner-occupied houses - 1 vehicle available(%)
Vehicles available in owner-occupied houses - 2 Vehicles available (%)
Vehicles available in owner-occupied houses - 3 Vehicles available (%)
Vehicles available in owner-occupied houses - 4 Vehicles available (%)
Vehicles available in owner-occupied houses - 5+ Vehicles available (%)
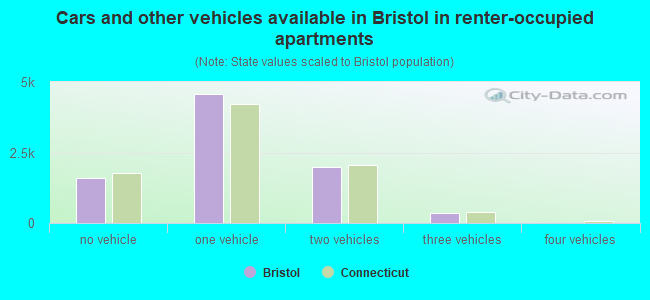
Vehicles available in renter-occupied houses - no vehicle available (%)
Vehicles available in renter-occupied houses - 1 vehicle available (%)
Vehicles available in renter-occupied houses - 2 Vehicles available (%)
Vehicles available in renter-occupied houses - 3 Vehicles available (%)
Vehicles available in renter-occupied houses - 4 Vehicles available (%)
Vehicles available in renter-occupied houses - 5+ Vehicles available (%)
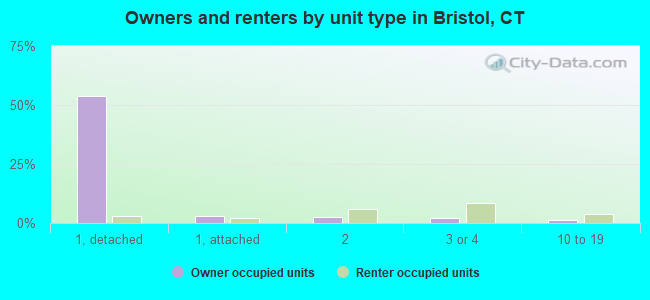
Housing units in structures - 1, detached (%)
Housing units in structures - 1, attached (%)
Housing units in structures - 2 (%)
Housing units in structures - 3 or 4 (%)
Housing units in structures - 5 to 9 (%)
Housing units in structures - 10 to 19 (%)
Housing units in structures - 20 to 49 (%)
Housing units in structures - 50 or more (%)
Housing units in structures - Mobile home (%)
Housing units in structures - Boat, RV, van, etc. (%)
Housing units in structures - Owners - 1, detached (%)
Housing units in structures - Owners - 1, attached (%)
Housing units in structures - Owners - 2 (%)
Housing units in structures - Owners - 3 or 4 (%)
Housing units in structures - Owners - 5 to 9 (%)
Housing units in structures - Owners - 10 to 19 (%)
Housing units in structures - Owners - 20 to 49 (%)
Housing units in structures - Owners - 50 or more (%)
Housing units in structures - Owners - Mobile home (%)
Housing units in structures - Owners - Boat, RV, van, etc. (%)
Housing units in structures - Renters - 1, detached (%)
Housing units in structures - Renters - 1, attached (%)
Housing units in structures - Renters - 2 (%)
Housing units in structures - Renters - 3 or 4 (%)
Housing units in structures - Renters - 5 to 9 (%)
Housing units in structures - Renters - 10 to 19 (%)
Housing units in structures - Renters - 20 to 49 (%)
Housing units in structures - Renters - 50 or more (%)
Housing units in structures - Renters - Mobile home (%)
Housing units in structures - Renters - Boat, RV, van, etc. (%)
House/condo owner moved in on average (years ago)
Renter moved in on average (years ago)
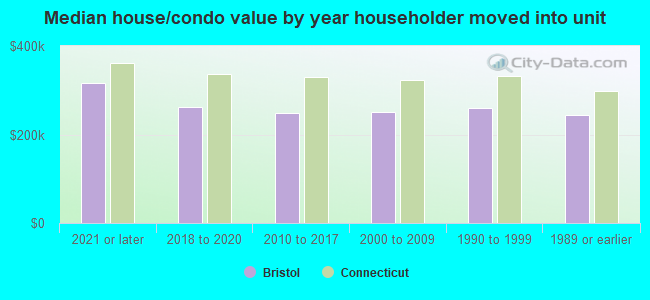
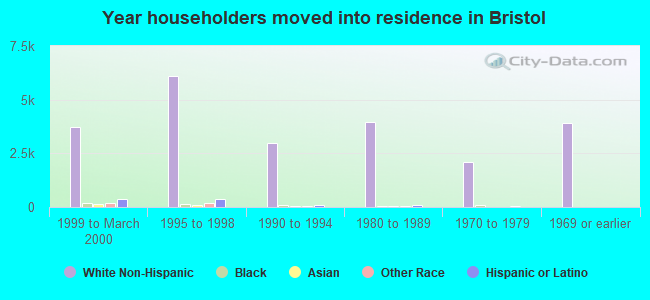
Year householder moved into unit - Moved in 1999 to March 2000 (%)
Year householder moved into unit - Moved in 1999 to March 2000 (%) - White
Year householder moved into unit - Moved in 1999 to March 2000 (%) - Black or African American
Year householder moved into unit - Moved in 1999 to March 2000 (%) - Asian
Year householder moved into unit - Moved in 1999 to March 2000 (%) - Hispanic or Latino
Year householder moved into unit - Moved in 1999 to March 2000 (%) - American Indian and Alaska Native
Year householder moved into unit - Moved in 1999 to March 2000 (%) - Multirace
Year householder moved into unit - Moved in 1999 to March 2000 (%) - Other Race
Year householder moved into unit - Moved in 1995 to 1998 (%)
Year householder moved into unit - Moved in 1995 to 1998 (%) - White
Year householder moved into unit - Moved in 1995 to 1998 (%) - Black or African American
Year householder moved into unit - Moved in 1995 to 1998 (%) - Asian
Year householder moved into unit - Moved in 1995 to 1998 (%) - Hispanic or Latino
Year householder moved into unit - Moved in 1995 to 1998 (%) - American Indian and Alaska Native
Year householder moved into unit - Moved in 1995 to 1998 (%) - Multirace
Year householder moved into unit - Moved in 1995 to 1998 (%) - Other Race
Year householder moved into unit - Moved in 1990 to 1994 (%)
Year householder moved into unit - Moved in 1990 to 1994 (%) - White
Year householder moved into unit - Moved in 1990 to 1994 (%) - Black or African American
Year householder moved into unit - Moved in 1990 to 1994 (%) - Asian
Year householder moved into unit - Moved in 1990 to 1994 (%) - Hispanic or Latino
Year householder moved into unit - Moved in 1990 to 1994 (%) - American Indian and Alaska Native
Year householder moved into unit - Moved in 1990 to 1994 (%) - Multirace
Year householder moved into unit - Moved in 1990 to 1994 (%) - Other Race
Year householder moved into unit - Moved in 1980 to 1989 (%)
Year householder moved into unit - Moved in 1980 to 1989 (%) - White
Year householder moved into unit - Moved in 1980 to 1989 (%) - Black or African American
Year householder moved into unit - Moved in 1980 to 1989 (%) - Asian
Year householder moved into unit - Moved in 1980 to 1989 (%) - Hispanic or Latino
Year householder moved into unit - Moved in 1980 to 1989 (%) - American Indian and Alaska Native
Year householder moved into unit - Moved in 1980 to 1989 (%) - Multirace
Year householder moved into unit - Moved in 1980 to 1989 (%) - Other Race
Year householder moved into unit - Moved in 1970 to 1979 (%)
Year householder moved into unit - Moved in 1970 to 1979 (%) - White
Year householder moved into unit - Moved in 1970 to 1979 (%) - Black or African American
Year householder moved into unit - Moved in 1970 to 1979 (%) - Asian
Year householder moved into unit - Moved in 1970 to 1979 (%) - Hispanic or Latino
Year householder moved into unit - Moved in 1970 to 1979 (%) - American Indian and Alaska Native
Year householder moved into unit - Moved in 1970 to 1979 (%) - Multirace
Year householder moved into unit - Moved in 1970 to 1979 (%) - Other Race
Year householder moved into unit - Moved in 1969 or earlier (%)
Year householder moved into unit - Moved in 1969 or earlier (%) - White
Year householder moved into unit - Moved in 1969 or earlier (%) - Black or African American
Year householder moved into unit - Moved in 1969 or earlier (%) - Asian
Year householder moved into unit - Moved in 1969 or earlier (%) - Hispanic or Latino
Year householder moved into unit - Moved in 1969 or earlier (%) - American Indian and Alaska Native
Year householder moved into unit - Moved in 1969 or earlier (%) - Multirace
Year householder moved into unit - Moved in 1969 or earlier (%) - Other Race
Housing units lacking complete plumbing facilities (%)
Housing units lacking complete kitchen facilities (%)
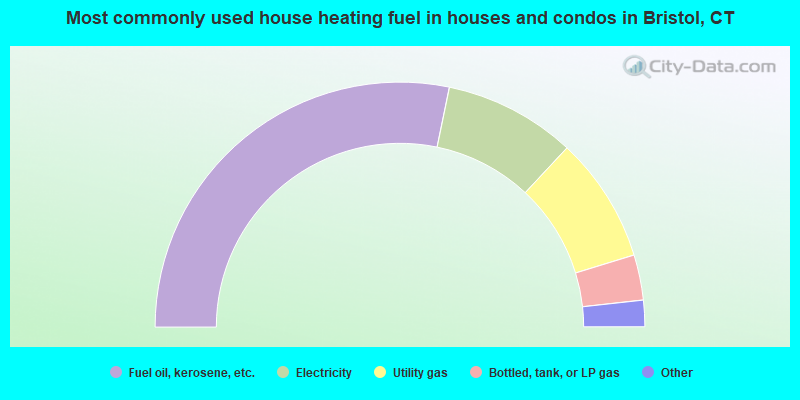
House heating fuel used in houses and condos - Utility gas (%)
House heating fuel used in houses and condos - Bottled, tank, or LP gas (%)
House heating fuel used in houses and condos - Electricity (%)
House heating fuel used in houses and condos - Fuel oil, kerosene, etc. (%)
House heating fuel used in houses and condos - Coal or coke (%)
House heating fuel used in houses and condos - Wood (%)
House heating fuel used in houses and condos - Solar energy (%)
House heating fuel used in houses and condos - Other fuel (%)
House heating fuel used in houses and condos - No fuel used (%)
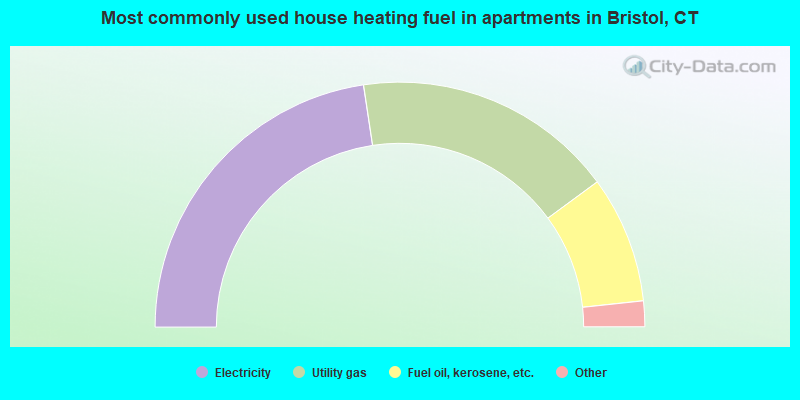
House heating fuel used in apartments - Utility gas (%)
House heating fuel used in apartments - Bottled, tank, or LP gas (%)
House heating fuel used in apartments - Electricity (%)
House heating fuel used in apartments - Fuel oil, kerosene, etc. (%)
House heating fuel used in apartments - Coal or coke (%)
House heating fuel used in apartments - Wood (%)
House heating fuel used in apartments - Solar energy (%)
House heating fuel used in apartments - Other fuel (%)
House heating fuel used in apartments - No fuel used (%)
Latest news about housing in Bristol, CT collected exclusively by city-data.com from local newspapers, TV, and radio stations
Median year house/condo built: 1966Median year apartment built: 1972Household type by relationship:
Households: 61,303
Male householders: 11,416 (3,331 living alone ), Female householders: 12,758 (3,593 living alone )10,215 spouses (10,028 opposite-sex spouses ), 2,505 unmarried partners , (2,347 opposite-sex unmarried partners ), 18,692 children (17,732 natural , 429 adopted , 530 stepchildren ), 1,028 grandchildren , 780 brothers or sisters , 916 parents , 8 foster children , 923 other relatives , 1,281 non-relatives In group quarters: 776
Size of family households: 6,482 2-persons , 3,571 3-persons , 3,528 4-persons , 993 5-persons , 275 6-persons , 210 7-or-more-persons .
Size of nonfamily households: 7,311 1-person , 1,955 2-persons , 159 3-persons , 23 4-persons , 31 6-persons .
7,542 married couples with children. single-parent households (727 men , 3,212 women ).
77.9% of residents of Bristol speak English at home. of residents speak Spanish at home (60% speak English very well , 20% speak English well , 16% speak English not well , 5% don't speak English at all ).of residents speak other Indo-European language at home (77% speak English very well , 14% speak English well , 8% speak English not well , 2% don't speak English at all ).of residents speak Asian or Pacific Island language at home (65% speak English very well , 20% speak English well , 10% speak English not well , 5% don't speak English at all ).of residents speak other language at home (79% speak English very well , 12% speak English well , 9% speak English not well ).
Foreign born population: 5,976 (9.7%)of them are naturalized citizens )
Median number of rooms in houses and condos:
Median number of rooms in apartments
Owner-occupied Renter-occupied
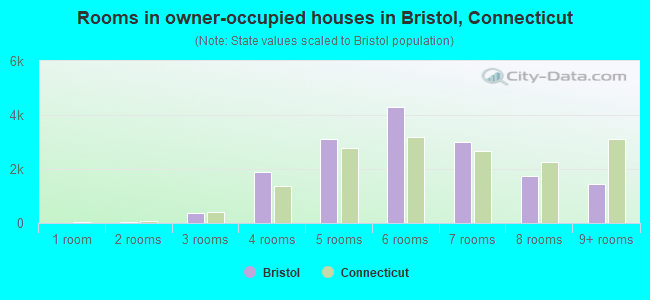
Rooms in owner-occupied houses in Bristol, Connecticut
17 1 room 20 2 rooms 388 3 rooms 1,900 4 rooms 3,111 5 rooms 4,300 6 rooms 2,994 7 rooms 1,750 8 rooms 1,443 9+ rooms
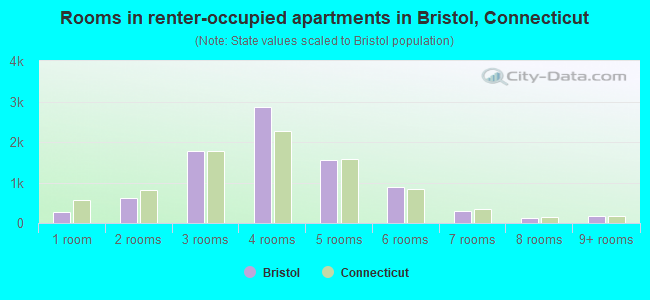
Rooms in renter-occupied apartments in Bristol, Connecticut
266 1 room 611 2 rooms 1,780 3 rooms 2,863 4 rooms 1,564 5 rooms 881 6 rooms 298 7 rooms 125 8 rooms 172 9+ rooms
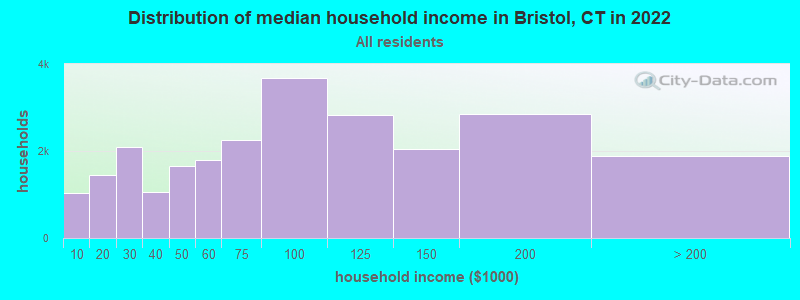
Bristol, CT household income distribution 1,023 Less than $10,0001,446 $10,000 to $19,9992,082 $20,000 to $29,9991,046 $30,000 to $39,9991,645 $40,000 to $49,9991,801 $50,000 to $59,9992,253 $60,000 to $74,9993,689 $75,000 to $99,9992,825 $100,000 to $124,9992,045 $125,000 to $149,9992,846 $150,000 to $199,9991,886 $200,000 or more
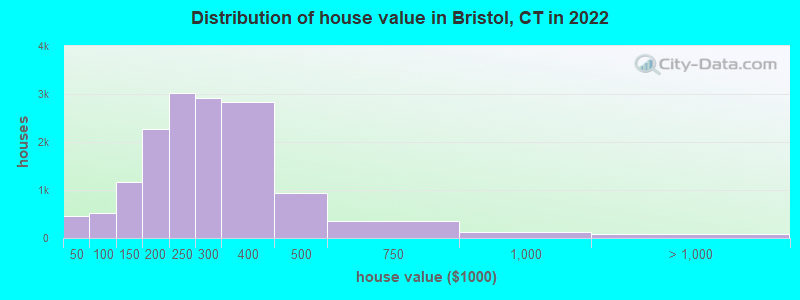
Home value of owner - occupied houses in 2022 in Bristol, CT 122 Less than $10,00014 $10,000 to $14,99994 $15,000 to $19,99919 $20,000 to $24,99929 $25,000 to $29,99918 $30,000 to $34,99940 $35,000 to $39,999112 $40,000 to $49,9993 $50,000 to $59,99963 $60,000 to $69,999158 $80,000 to $89,999185 $90,000 to $99,999617 $100,000 to $124,999549 $125,000 to $149,999936 $150,000 to $174,9991,324 $175,000 to $199,9993,020 $200,000 to $249,9992,927 $250,000 to $299,9992,840 $300,000 to $399,999936 $400,000 to $499,999352 $500,000 to $749,999134 $750,000 to $999,99958 $1,000,000 to $1,499,99920 $1,500,000 to $1,999,999Rent paid by renters in 2022 in Bristol, CT 78 Less than $100120 $100 to $149168 $150 to $199178 $200 to $249140 $250 to $29928 $300 to $34983 $350 to $39925 $400 to $449111 $450 to $499201 $500 to $549188 $550 to $599232 $600 to $649177 $650 to $699140 $700 to $749453 $750 to $799992 $800 to $899869 $900 to $9992,014 $1,000 to $1,2491,342 $1,250 to $1,499513 $1,500 to $1,999128 $2,000 to $2,49919 $3,000 to $3,49912 $3,500 or more301 No cash rent
Percentage of workers working in this county: 44.5%Number of people working at home: 4,043 (12.3% of all workers )
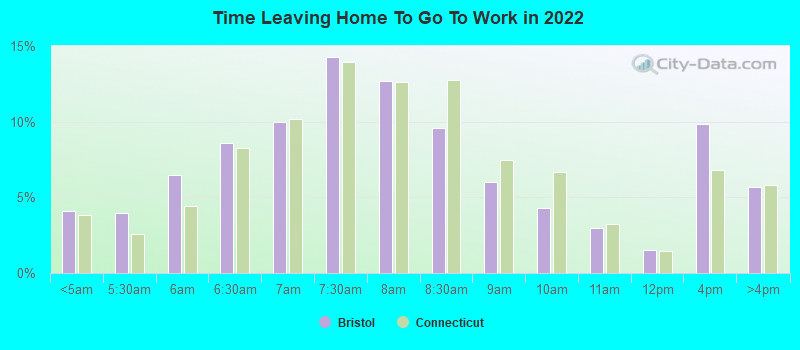
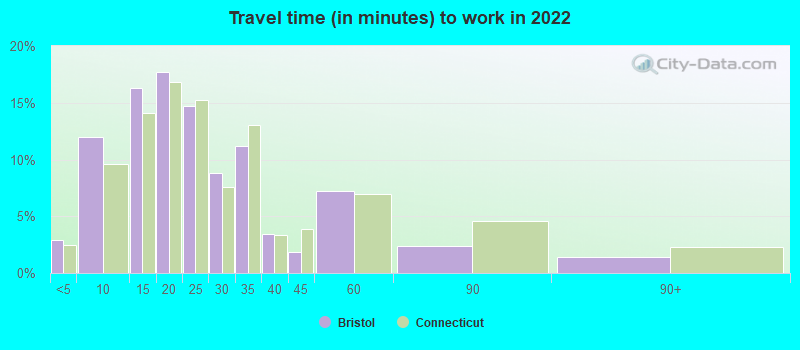
Travel time to work (commute)
Less than 5 minutes: 6435 to 9 minutes: 2,66710 to 14 minutes: 4,07915 to 19 minutes: 4,22220 to 24 minutes: 4,22225 to 29 minutes: 2,84130 to 34 minutes: 3,48735 to 39 minutes: 1,22740 to 44 minutes: 1,24245 to 59 minutes: 2,28160 to 89 minutes: 1,00690 or more minutes: 554
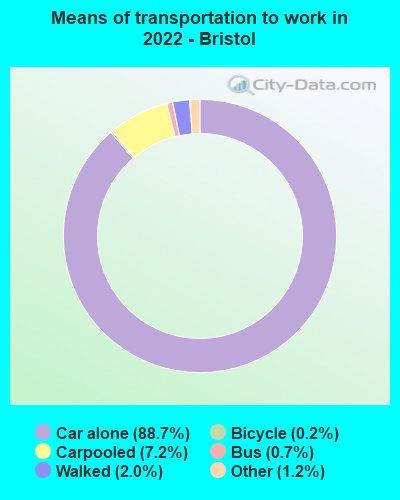
Means of transportation to work:
Drove a car alone: 17,934 (73.3%)Carpooled: 1,551 (6.3%)Bus : 138 (0.6%)Ferryboat: 5 (0.0%)Taxi: 286 (1.2%)Bicycle: 36 (0.1%)Walked: 438 (1.8%)Worked at home: 4,043 (16.5%)
Unemployment by race in 2022
Unemployment rate for White non-Hispanic residents 3.7% Males4.5% FemalesUnemployment rate for Black residents 6.5% Males2.5% FemalesUnemployment rate for American Indian and Alaska Native residents 82.3% FemalesUnemployment rate for Asian residents 3.8% MalesUnemployment rate for other race residents 2.2% Males8.1% FemalesUnemployment rate for two or more race residents 17.2% Males4.3% FemalesUnemployment rate for Hispanic or Latino residents 10.7% Males7.9% Females
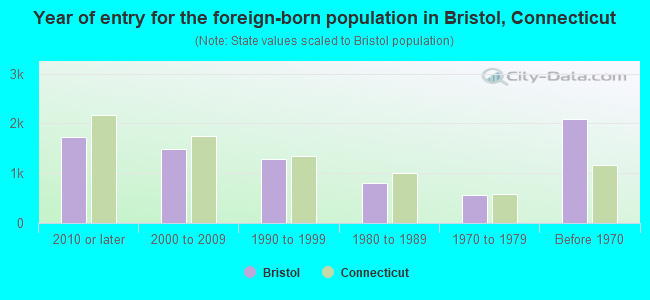
Year of entry for the foreign-born population in Bristol, Connecticut
1,733 2010 or later 1,492 2000 to 2009 1,292 1990 to 1999 813 1980 to 1989 558 1970 to 1979 2,097 Before 1970
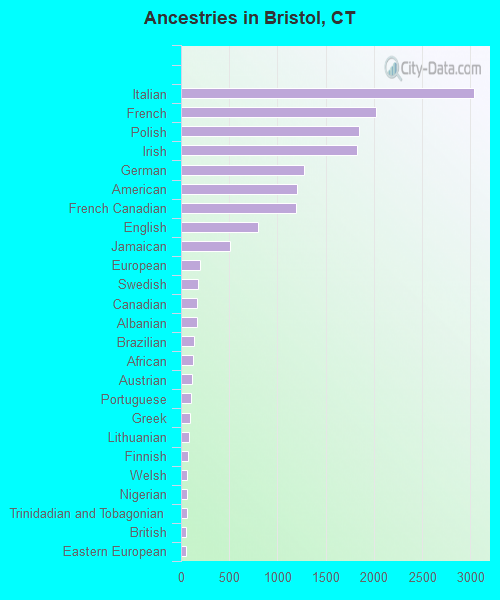
First ancestries reported:
Italian: 3,042 (11.2%)
French: 2,019 (7.4%)
Polish: 1,847 (6.8%)
Irish: 1,821 (6.7%)
German: 1,273 (4.7%)
American: 1,199 (4.4%)
French Canadian: 1,197 (4.4%)
English: 801 (3.0%)
Jamaican: 513 (1.9%)
European: 193 (0.7%)
Swedish: 175 (0.6%)
Canadian: 163 (0.6%)
Albanian: 161 (0.6%)
Brazilian: 132 (0.5%)
African: 127 (0.5%)
Austrian: 113 (0.4%)
Portuguese: 106 (0.4%)
Greek: 94 (0.3%)
Lithuanian: 88 (0.3%)
Finnish: 75 (0.3%)
Welsh: 63 (0.2%)
Nigerian: 62 (0.2%)
Trinidadian and Tobagonian: 59 (0.2%)
British: 56 (0.2%)
Eastern European: 49 (0.2%)
Cape Verdean: 45 (0.2%)
Scandinavian: 45 (0.2%)
Scotch-Irish: 43 (0.2%)
Scottish: 42 (0.2%)
Belgian: 35 (0.1%)
Lebanese: 24 (0.09%)
Slovak: 19 (0.07%)
Iranian: 18 (0.07%)
Moroccan: 17 (0.06%)
Armenian: 14 (0.05%)
Bulgarian: 13 (0.05%)
Dutch: 13 (0.05%)
Russian: 12 (0.04%)
Haitian: 12 (0.04%)
British West Indian: 10 (0.04%)
Czech: 9 (0.03%)
Romanian: 9 (0.03%)
Danish: 9 (0.03%)
West Indian: 8 (0.03%)
Hungarian: 7 (0.03%)
Czechoslovakian: 7 (0.03%)
Celtic: 6 (0.02%)
Yugoslavian: 5 (0.02%)
Most common places of birth for foreign-born residents (%): Ecuador Bristol:
9.5% (568)Connecticut:
4.4% (24,026)
Poland Bristol:
9.3% (555)Connecticut:
4.0% (21,729)
Jamaica Bristol:
8.9% (532)Connecticut:
7.5% (40,568)
Honduras Bristol:
7.1% (427)Connecticut:
1.3% (7,220)
Canada Bristol:
6.4% (383)Connecticut:
2.3% (12,380)
Pakistan Bristol:
6.2% (373)Connecticut:
1.3% (7,003)
Philippines Bristol:
5.1% (305)Connecticut:
1.9% (10,545)
Dominican Republic Bristol:
4.0% (240)Connecticut:
5.0% (27,361)
England Bristol:
3.5% (208)Connecticut:
1.2% (6,551)
India Bristol:
3.4% (202)Connecticut:
7.3% (39,879)
Brazil Bristol:
3.1% (184)Connecticut:
4.7% (25,461)
Italy Bristol:
3.0% (177)Connecticut:
2.8% (15,141)
Mexico Bristol:
2.9% (171)Connecticut:
4.8% (25,802)
Vietnam Bristol:
2.8% (168)Connecticut:
1.2% (6,448)
Colombia Bristol:
2.7% (164)Connecticut:
3.3% (18,124)
Cambodia Bristol:
2.0% (119)Connecticut:
0.3% (1,550)
Place of birth for U.S.-born residents:
This state: 39,726Other state: 11,099Northeast: 6,907Midwest: 1,449South: 1,592West: 1,153 88.6% of Bristol residents lived in the same house 1 years ago.
Out of people who lived in different houses, 29.9% lived in this county.
Out of people who lived in different counties, 51.2% lived in Connecticut.
Bristol:
88.6%State average:
88.4%
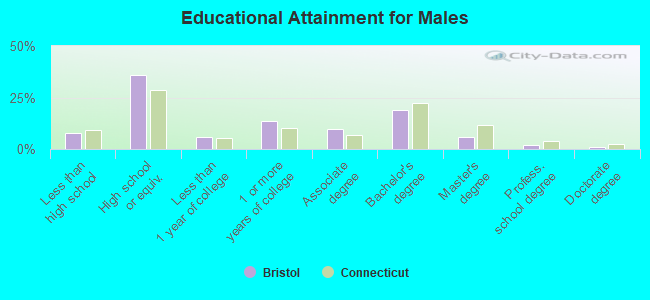
Education attainment for males 25 years and older:
No schooling: 299Nursery to 4th grade: 355th and 6th grade: 1187th and 8th grade: 3109th grade: 7810th grade: 10911th grade: 31712th grade, no diploma: 319High school graduate (or equivalency): 7,526Less than 1 year of college: 1,239Some college more than 1 year, no degree: 2,889Associate degree: 2,027Bachelor's degree: 3,945Master's degree: 1,210Professional school degree: 386Doctorate degree: 165
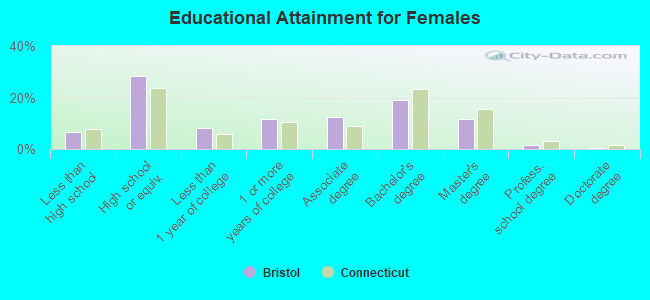
Education attainment for females 25 years and older:
No schooling: 209Nursery to 4th grade: 565th and 6th grade: 1057th and 8th grade: 979th grade: 10910th grade: 14611th grade: 31712th grade, no diploma: 394High school graduate (or equivalency): 6,272Less than 1 year of college: 1,761Some college more than 1 year, no degree: 2,592Associate degree: 2,748Bachelor's degree: 4,201Master's degree: 2,565Professional school degree: 330Doctorate degree: 96
Housing units in structures:
One, detached: 14,297One, attached: 1,134Two: 2,6663 or 4: 2,9035 to 9: 1,41710 to 19: 1,16820 to 49: 1,11850 or more: 1,369Mobile homes: 233Median worth of mobile homes: $77,049
Housing units lacking complete plumbing facilities in 2022: 0.7%Housing units lacking complete kitchen facilities in 2022: 1.6%House/condo owner moved in on average 11 years ago
Renter moved in on average 3 years ago
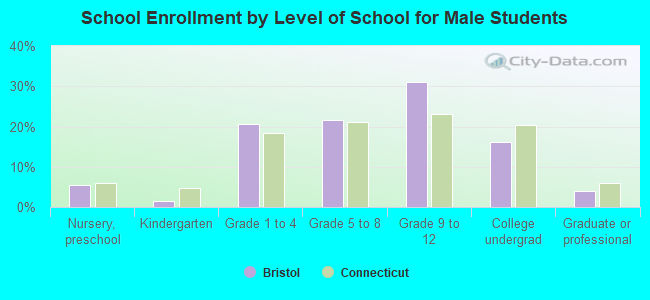
Private vs. public school enrollment:
Students in private schools in grades 1 to 8 (elementary and middle school): 539 Here:
8.8%Connecticut:
9.5%
Students in private schools in grades 9 to 12 (high school): 254 Here:
7.5%Connecticut:
12.9%
Students in private undergraduate colleges: 891 Here:
34.2%Connecticut:
35.5%