Broken Arrow, OK (Oklahoma) Houses and Residents
Estimated median house or condo value in 2022: $236,600 (it was $98,500 in 2000 )
Broken Arrow:
$236,600Oklahoma:
$191,700
Lower value quartile - upper value quartile: $168,400 - $318,200Mean price in 2022: Detached houses: $302,331 Here:
$302,331State:
$255,409
Townhouses or other attached units: $343,925 Here:
$343,925State:
$206,466
In 2-unit structures: $198,535 Here:
$198,535State:
$195,100
In 3-to-4-unit structures: $160,731 Here:
$160,731State:
$140,612
In 5-or-more-unit structures: $150,718 Here:
$150,718State:
$233,805
Mobile homes: $66,329 Here:
$66,329State:
$110,804
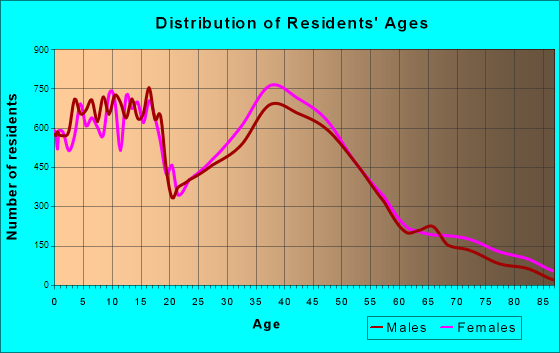
Total population: 104,726 (Urban population: 74,364, Rural population: 592 (all nonfarm) )
Houses: 47,352 (45,550 occupied: 34,379 owner occupied, 11,171 renter occupied )
% of renters here:
25%State:
35%
Housing density: 1,053 houses/condos per square mile
Median price asked for vacant for-sale houses and condos in 2022: $247,238.
Median contract rent in 2022: $1,021 (lower quartile is $828, upper quartile is $1,237)
Median rent asked for vacant for-rent units in 2022: $1,890
Median gross rent in Broken Arrow, OK in 2022: $1,212
Housing units in Broken Arrow with a mortgage: 22,196 (1,359 second mortgage, 0 home equity loan, 1,152 both second mortgage and home equity loan )Houses without a mortgage: 303
Median household income for houses/condos with a mortgage: $98,150
Median household income for apartments without a mortgage: $72,585
Median monthly housing costs: $1,193
Data:
Median house or condo value ($)
Median house or condo value ($ change since 2000)
Median house or condo value ($) - White
Median house or condo value ($) - Black or African American
Median house or condo value ($) - Asian
Median house or condo value ($) - Hispanic or Latino
Median house or condo value ($) - American Indian and Alaska Native
Median house or condo value ($) - Multirace
Median house or condo value ($) - Other Race
Median price asked for mobile homes ($)
Household density (households per square mile)
Mean house or condo value by units in structure - 1, detached ($)
Mean house or condo value by units in structure - 1, attached ($)
Mean house or condo value by units in structure - 2 ($)
Mean house or condo value by units in structure by units in structure - 3 or 4 ($)
Mean house or condo value by units in structure - 5 or more ($)
Mean house or condo value by units in structure - Boat, RV, van, etc. ($)
Mean house or condo value by units in structure - Mobile home ($)
Median contract rent ($)
Median contract rent - Lower quartile ($)
Median contract rent - Upper quartile ($)
Median gross rent ($)
Urban houses (%)
Rural houses (%)
Houses occupied (%)
Houses occupied (% change since 2000)
Houses owner occupied (%)
Houses owner occupied (% change since 2000)
Houses renter occupied (%)
Houses renter occupied (% change since 2000)
Vacant housing units - For rent (%)
Vacant housing units - For rent (% change since 2000)
Vacant housing units - For sale only (%)
Vacant housing units - For sale only (% change since 2000)
Vacant housing units - Rented or sold, not occupied (%)
Vacant housing units - Rented or sold, not occupied (% change since 2000)
Vacant housing units - For seasonal, recreational, or occasional use (%)
Vacant housing units - For seasonal, recreational, or occasional use (% change since 2000)
Vacant housing units - For migrant workers (%)
Vacant housing units - For migrant workers (% change since 2000)
Vacant housing units - Other vacant (%)
Vacant housing units - Other vacant (% change since 2000)
Median monthly housing costs ($)
Median household income for houses/condos with a mortgage ($)
Median household income for houses/condos without a mortgage ($)
Median household income ($)
Median household income ($) - White
Median household income ($) - Black or African American
Median household income ($) - Asian
Median household income ($) - Hispanic or Latino
Median household income ($) - American Indian and Alaska Native
Median household income ($) - Multirace
Median household income ($) - Other Race
Mortgage status - with mortgage (%)
Mortgage status - with second mortgage (%)
Mortgage status - with home equity loan (%)
Mortgage status - with both second mortgage and home equity loan (%)
Mortgage status - without a mortgage (%)
Median year house/condo built
Median year apartment built
Household type by relationship - Male householder living alone (%)
Household type by relationship - Male householder not living alone (%)
Household type by relationship - Female householder living alone (%)
Household type by relationship - Female householder not living alone (%)
Household type by relationship - Opposite-Sex spouse (%)
Household type by relationship - Same-Sex spouse (%)
Household type by relationship - Opposite-Sex unmarried partner (%)
Household type by relationship - Same-Sex unmarried partner (%)
Household type by relationship - In group quarters (%)
Size of family households - 2-person household (%)
Size of family households - 3-person household (%)
Size of family households - 4-person household (%)
Size of family households - 5-person household (%)
Size of family households - 6-person household (%)
Size of family households - 7-or-more-person household (%)
Size of nonfamily households - 1-person household (%)
Size of nonfamily households - 2-person household (%)
Size of nonfamily households - 3-person household (%)
Size of nonfamily households - 4-person household (%)
Size of nonfamily households - 5-person household (%)
Size of nonfamily households - 6-person household (%)
Size of nonfamily households - 7-or-moreperson household (%)
Year house built - Built 2010 or later (%)
Year house built - Built 2000 to 2009 (%)
Year house built - Built 1990 to 1999 (%)
Year house built - Built 1980 to 1989 (%)
Year house built - Built 1970 to 1979 (%)
Year house built - Built 1960 to 1969 (%)
Year house built - Built 1950 to 1959 (%)
Year house built - Built 1940 to 1949 (%)
Year house built - Built 1939 or earlier (%)
Median number of rooms in houses and condos
Median number of rooms in apartments
Median number of bedrooms in owner occupied houses
Mean number of bedrooms in owner occupied houses
Median number of bedrooms in renter occupied houses
Mean number of bedrooms in renter occupied houses
Median number of vehichles in owner occupied houses
Mean number of vehichles in owner occupied houses
Median number of vehichles in renter occupied houses
Mean number of vehichles in renter occupied houses
Rooms in owner-occupied houses - 1 room (%)
Rooms in owner-occupied houses - 2 rooms (%)
Rooms in owner-occupied houses - 3 rooms (%)
Rooms in owner-occupied houses - 4 rooms (%)
Rooms in owner-occupied houses - 5 rooms (%)
Rooms in owner-occupied houses - 6 rooms (%)
Rooms in owner-occupied houses - 7 rooms (%)
Rooms in owner-occupied houses - 8 rooms (%)
Rooms in owner-occupied houses - 9+ rooms (%)
Rooms in renter-occupied houses - 1 room (%)
Rooms in renter-occupied houses - 2 rooms (%)
Rooms in renter-occupied houses - 3 rooms (%)
Rooms in renter-occupied houses - 4 rooms (%)
Rooms in renter-occupied houses - 5 rooms (%)
Rooms in renter-occupied houses - 6 rooms (%)
Rooms in renter-occupied houses - 7 rooms (%)
Rooms in renter-occupied houses - 8 rooms (%)
Rooms in renter-occupied houses - 9+ rooms (%)
Bedrooms in owner-occupied houses - no bedrooms (%)
Bedrooms in owner-occupied houses - 1 bedroom (%)
Bedrooms in owner-occupied houses - 2 bedrooms (%)
Bedrooms in owner-occupied houses - 3 bedrooms (%)
Bedrooms in owner-occupied houses - 4 bedrooms (%)
Bedrooms in owner-occupied houses - 5+ bedrooms (%)
Bedrooms in renter-occupied houses - no bedrooms (%)
Bedrooms in renter-occupied houses - 1 bedroom (%)
Bedrooms in renter-occupied houses - 2 bedrooms (%)
Bedrooms in renter-occupied houses - 3 bedrooms (%)
Bedrooms in renter-occupied houses - 4 bedrooms (%)
Bedrooms in renter-occupied houses - 5+ bedrooms (%)
Vehicles available in owner-occupied houses - no vehicle available (%)
Vehicles available in owner-occupied houses - 1 vehicle available(%)
Vehicles available in owner-occupied houses - 2 Vehicles available (%)
Vehicles available in owner-occupied houses - 3 Vehicles available (%)
Vehicles available in owner-occupied houses - 4 Vehicles available (%)
Vehicles available in owner-occupied houses - 5+ Vehicles available (%)
Vehicles available in renter-occupied houses - no vehicle available (%)
Vehicles available in renter-occupied houses - 1 vehicle available (%)
Vehicles available in renter-occupied houses - 2 Vehicles available (%)
Vehicles available in renter-occupied houses - 3 Vehicles available (%)
Vehicles available in renter-occupied houses - 4 Vehicles available (%)
Vehicles available in renter-occupied houses - 5+ Vehicles available (%)
Housing units in structures - 1, detached (%)
Housing units in structures - 1, attached (%)
Housing units in structures - 2 (%)
Housing units in structures - 3 or 4 (%)
Housing units in structures - 5 to 9 (%)
Housing units in structures - 10 to 19 (%)
Housing units in structures - 20 to 49 (%)
Housing units in structures - 50 or more (%)
Housing units in structures - Mobile home (%)
Housing units in structures - Boat, RV, van, etc. (%)
Housing units in structures - Owners - 1, detached (%)
Housing units in structures - Owners - 1, attached (%)
Housing units in structures - Owners - 2 (%)
Housing units in structures - Owners - 3 or 4 (%)
Housing units in structures - Owners - 5 to 9 (%)
Housing units in structures - Owners - 10 to 19 (%)
Housing units in structures - Owners - 20 to 49 (%)
Housing units in structures - Owners - 50 or more (%)
Housing units in structures - Owners - Mobile home (%)
Housing units in structures - Owners - Boat, RV, van, etc. (%)
Housing units in structures - Renters - 1, detached (%)
Housing units in structures - Renters - 1, attached (%)
Housing units in structures - Renters - 2 (%)
Housing units in structures - Renters - 3 or 4 (%)
Housing units in structures - Renters - 5 to 9 (%)
Housing units in structures - Renters - 10 to 19 (%)
Housing units in structures - Renters - 20 to 49 (%)
Housing units in structures - Renters - 50 or more (%)
Housing units in structures - Renters - Mobile home (%)
Housing units in structures - Renters - Boat, RV, van, etc. (%)
House/condo owner moved in on average (years ago)
Renter moved in on average (years ago)
Year householder moved into unit - Moved in 1999 to March 2000 (%)
Year householder moved into unit - Moved in 1999 to March 2000 (%) - White
Year householder moved into unit - Moved in 1999 to March 2000 (%) - Black or African American
Year householder moved into unit - Moved in 1999 to March 2000 (%) - Asian
Year householder moved into unit - Moved in 1999 to March 2000 (%) - Hispanic or Latino
Year householder moved into unit - Moved in 1999 to March 2000 (%) - American Indian and Alaska Native
Year householder moved into unit - Moved in 1999 to March 2000 (%) - Multirace
Year householder moved into unit - Moved in 1999 to March 2000 (%) - Other Race
Year householder moved into unit - Moved in 1995 to 1998 (%)
Year householder moved into unit - Moved in 1995 to 1998 (%) - White
Year householder moved into unit - Moved in 1995 to 1998 (%) - Black or African American
Year householder moved into unit - Moved in 1995 to 1998 (%) - Asian
Year householder moved into unit - Moved in 1995 to 1998 (%) - Hispanic or Latino
Year householder moved into unit - Moved in 1995 to 1998 (%) - American Indian and Alaska Native
Year householder moved into unit - Moved in 1995 to 1998 (%) - Multirace
Year householder moved into unit - Moved in 1995 to 1998 (%) - Other Race
Year householder moved into unit - Moved in 1990 to 1994 (%)
Year householder moved into unit - Moved in 1990 to 1994 (%) - White
Year householder moved into unit - Moved in 1990 to 1994 (%) - Black or African American
Year householder moved into unit - Moved in 1990 to 1994 (%) - Asian
Year householder moved into unit - Moved in 1990 to 1994 (%) - Hispanic or Latino
Year householder moved into unit - Moved in 1990 to 1994 (%) - American Indian and Alaska Native
Year householder moved into unit - Moved in 1990 to 1994 (%) - Multirace
Year householder moved into unit - Moved in 1990 to 1994 (%) - Other Race
Year householder moved into unit - Moved in 1980 to 1989 (%)
Year householder moved into unit - Moved in 1980 to 1989 (%) - White
Year householder moved into unit - Moved in 1980 to 1989 (%) - Black or African American
Year householder moved into unit - Moved in 1980 to 1989 (%) - Asian
Year householder moved into unit - Moved in 1980 to 1989 (%) - Hispanic or Latino
Year householder moved into unit - Moved in 1980 to 1989 (%) - American Indian and Alaska Native
Year householder moved into unit - Moved in 1980 to 1989 (%) - Multirace
Year householder moved into unit - Moved in 1980 to 1989 (%) - Other Race
Year householder moved into unit - Moved in 1970 to 1979 (%)
Year householder moved into unit - Moved in 1970 to 1979 (%) - White
Year householder moved into unit - Moved in 1970 to 1979 (%) - Black or African American
Year householder moved into unit - Moved in 1970 to 1979 (%) - Asian
Year householder moved into unit - Moved in 1970 to 1979 (%) - Hispanic or Latino
Year householder moved into unit - Moved in 1970 to 1979 (%) - American Indian and Alaska Native
Year householder moved into unit - Moved in 1970 to 1979 (%) - Multirace
Year householder moved into unit - Moved in 1970 to 1979 (%) - Other Race
Year householder moved into unit - Moved in 1969 or earlier (%)
Year householder moved into unit - Moved in 1969 or earlier (%) - White
Year householder moved into unit - Moved in 1969 or earlier (%) - Black or African American
Year householder moved into unit - Moved in 1969 or earlier (%) - Asian
Year householder moved into unit - Moved in 1969 or earlier (%) - Hispanic or Latino
Year householder moved into unit - Moved in 1969 or earlier (%) - American Indian and Alaska Native
Year householder moved into unit - Moved in 1969 or earlier (%) - Multirace
Year householder moved into unit - Moved in 1969 or earlier (%) - Other Race
Housing units lacking complete plumbing facilities (%)
Housing units lacking complete kitchen facilities (%)
House heating fuel used in houses and condos - Utility gas (%)
House heating fuel used in houses and condos - Bottled, tank, or LP gas (%)
House heating fuel used in houses and condos - Electricity (%)
House heating fuel used in houses and condos - Fuel oil, kerosene, etc. (%)
House heating fuel used in houses and condos - Coal or coke (%)
House heating fuel used in houses and condos - Wood (%)
House heating fuel used in houses and condos - Solar energy (%)
House heating fuel used in houses and condos - Other fuel (%)
House heating fuel used in houses and condos - No fuel used (%)
House heating fuel used in apartments - Utility gas (%)
House heating fuel used in apartments - Bottled, tank, or LP gas (%)
House heating fuel used in apartments - Electricity (%)
House heating fuel used in apartments - Fuel oil, kerosene, etc. (%)
House heating fuel used in apartments - Coal or coke (%)
House heating fuel used in apartments - Wood (%)
House heating fuel used in apartments - Solar energy (%)
House heating fuel used in apartments - Other fuel (%)
House heating fuel used in apartments - No fuel used (%)
Median year house/condo built: 1991Median year apartment built: 1997Household type by relationship:
Households: 120,448
Male householders: 23,337 (3,925 living alone ), Female householders: 22,213 (6,201 living alone )26,624 spouses (26,264 opposite-sex spouses ), 2,875 unmarried partners , (2,875 opposite-sex unmarried partners ), 37,162 children (34,076 natural , 910 adopted , 2,176 stepchildren ), 1,456 grandchildren , 737 brothers or sisters , 1,300 parents , 244 foster children , 784 other relatives , 3,072 non-relatives In group quarters: 644
Size of family households: 14,299 2-persons , 8,110 3-persons , 5,747 4-persons , 2,949 5-persons , 1,506 6-persons , 357 7-or-more-persons .
Size of nonfamily households: 10,126 1-person , 2,087 2-persons , 299 3-persons , 70 4-persons .
20,222 married couples with children. single-parent households (2,713 men , 4,447 women ).
87.8% of residents of Broken Arrow speak English at home. of residents speak Spanish at home (66% speak English very well , 18% speak English well , 13% speak English not well , 3% don't speak English at all ).of residents speak other Indo-European language at home (70% speak English very well , 16% speak English well , 10% speak English not well , 4% don't speak English at all ).of residents speak Asian or Pacific Island language at home (52% speak English very well , 29% speak English well , 16% speak English not well , 3% don't speak English at all ).of residents speak other language at home (73% speak English very well , 19% speak English well , 7% speak English not well , 1% don't speak English at all ).
Foreign born population: 9,281 (7.7%)of them are naturalized citizens )
Median number of rooms in houses and condos:
Median number of rooms in apartments
Owner-occupied Renter-occupied
Rooms in owner-occupied houses in Broken Arrow, Oklahoma
66 1 room 221 2 rooms 260 3 rooms 1,385 4 rooms 6,970 5 rooms 7,643 6 rooms 6,055 7 rooms 5,318 8 rooms 6,461 9+ rooms
Rooms in renter-occupied apartments in Broken Arrow, Oklahoma
317 1 room 753 2 rooms 1,902 3 rooms 2,713 4 rooms 2,133 5 rooms 1,523 6 rooms 781 7 rooms 411 8 rooms 638 9+ rooms
Broken Arrow, OK household income distribution 1,447 Less than $10,0001,941 $10,000 to $19,9992,893 $20,000 to $29,9992,470 $30,000 to $39,9993,386 $40,000 to $49,9993,803 $50,000 to $59,9995,269 $60,000 to $74,9997,386 $75,000 to $99,9995,630 $100,000 to $124,9994,222 $125,000 to $149,9993,804 $150,000 to $199,9993,299 $200,000 or more
Home value of owner - occupied houses in 2022 in Broken Arrow, OK 304 Less than $10,00067 $10,000 to $14,999185 $15,000 to $19,999195 $20,000 to $24,99930 $25,000 to $29,99982 $30,000 to $34,999122 $40,000 to $49,99949 $60,000 to $69,99985 $70,000 to $79,999232 $80,000 to $89,99976 $90,000 to $99,9992,140 $100,000 to $124,9992,386 $125,000 to $149,9993,596 $150,000 to $174,9993,370 $175,000 to $199,9995,833 $200,000 to $249,9995,946 $250,000 to $299,9995,972 $300,000 to $399,9992,043 $400,000 to $499,9991,356 $500,000 to $749,999147 $750,000 to $999,99965 $1,000,000 to $1,499,99939 $1,500,000 to $1,999,99959 $2,000,000 or moreRent paid by renters in 2022 in Broken Arrow, OK 20 Less than $100104 $150 to $199137 $200 to $249117 $250 to $29949 $300 to $349118 $350 to $39995 $400 to $44936 $450 to $49935 $500 to $549141 $550 to $599373 $600 to $649333 $650 to $699230 $700 to $749599 $750 to $7991,015 $800 to $8991,697 $900 to $9993,100 $1,000 to $1,2491,687 $1,250 to $1,499696 $1,500 to $1,999112 $2,000 to $2,49930 $3,500 or more447 No cash rent
Percentage of workers working in this county: 77.9%Number of people working at home: 6,745 (11.6% of all workers )
Travel time to work (commute)
Less than 5 minutes: 7475 to 9 minutes: 4,96410 to 14 minutes: 7,21015 to 19 minutes: 11,26520 to 24 minutes: 12,11225 to 29 minutes: 5,81830 to 34 minutes: 5,95635 to 39 minutes: 44740 to 44 minutes: 67445 to 59 minutes: 1,53960 to 89 minutes: 52090 or more minutes: 1,251
Means of transportation to work:
Drove a car alone: 32,039 (75.4%)Carpooled: 3,188 (7.5%)Bus : 29 (0.1%)Taxi: 640 (1.5%)Bicycle: 81 (0.2%)Walked: 370 (0.9%)Worked at home: 6,745 (15.9%)
Unemployment by race in 2022
Unemployment rate for White non-Hispanic residents 2.8% Males3.0% FemalesUnemployment rate for Black residents 2.0% Males5.8% FemalesUnemployment rate for American Indian and Alaska Native residents 2.5% Males5.2% FemalesUnemployment rate for Asian residents 5.2% Males6.6% FemalesUnemployment rate for other race residents 1.5% Males1.5% FemalesUnemployment rate for two or more race residents 3.6% Males4.3% FemalesUnemployment rate for Hispanic or Latino residents 2.8% Males3.6% Females
Year of entry for the foreign-born population in Broken Arrow, Oklahoma
2,782 2010 or later 2,632 2000 to 2009 1,971 1990 to 1999 688 1980 to 1989 445 1970 to 1979 526 Before 1970
First ancestries reported:
English: 7,060 (11.9%)
German: 5,018 (8.5%)
American: 4,999 (8.4%)
Irish: 3,642 (6.1%)
European: 1,545 (2.6%)
Italian: 1,329 (2.2%)
Northern European: 803 (1.4%)
Scottish: 727 (1.2%)
Scotch-Irish: 417 (0.7%)
Norwegian: 384 (0.6%)
Polish: 328 (0.6%)
French: 296 (0.5%)
Russian: 259 (0.4%)
Dutch: 227 (0.4%)
Syrian: 203 (0.3%)
Turkish: 198 (0.3%)
Swedish: 191 (0.3%)
French Canadian: 189 (0.3%)
Welsh: 182 (0.3%)
British: 182 (0.3%)
Ugandan: 160 (0.3%)
Scandinavian: 139 (0.2%)
African: 137 (0.2%)
Ukrainian: 131 (0.2%)
Nigerian: 130 (0.2%)
Greek: 120 (0.2%)
Lebanese: 103 (0.2%)
Czech: 89 (0.1%)
Pennsylvania German: 86 (0.1%)
Iraqi: 74 (0.1%)
West Indian: 70 (0.1%)
Eastern European: 70 (0.1%)
Jordanian: 68 (0.1%)
Iranian: 68 (0.1%)
Hungarian: 63 (0.1%)
Portuguese: 62 (0.1%)
U.S. Virgin Islander: 61 (0.1%)
Barbadian: 58 (0.10%)
Ethiopian: 53 (0.09%)
Jamaican: 49 (0.08%)
Czechoslovakian: 47 (0.08%)
Palestinian: 43 (0.07%)
Brazilian: 43 (0.07%)
Danish: 41 (0.07%)
Finnish: 34 (0.06%)
Canadian: 33 (0.06%)
Croatian: 26 (0.04%)
Romanian: 25 (0.04%)
Belgian: 24 (0.04%)
Austrian: 21 (0.04%)
British West Indian: 21 (0.04%)
Kenyan: 18 (0.03%)
German Russian: 18 (0.03%)
Dutch West Indian: 18 (0.03%)
Icelander: 15 (0.03%)
Swiss: 15 (0.03%)
Bahamian: 15 (0.03%)
Estonian: 15 (0.03%)
Slovene: 13 (0.02%)
Slovak: 12 (0.02%)
Arab: 11 (0.02%)
Belizean: 11 (0.02%)
Haitian: 11 (0.02%)
Egyptian: 10 (0.02%)
Guyanese: 9 (0.02%)
Australian: 7 (0.01%)
Cape Verdean: 6 (0.01%)
New Zealander: 6 (0.01%)
Moroccan: 5 (0.01%)
Cajun: 5 (0.01%)
Armenian: 4 (0.01%)
Bulgarian: 3 (0.01%)
Most common places of birth for foreign-born residents (%): Mexico Broken Arrow:
28.1% (2,449)Oklahoma:
42.4% (103,425)
Vietnam Broken Arrow:
13.2% (1,146)Oklahoma:
5.6% (13,699)
India Broken Arrow:
5.3% (462)Oklahoma:
4.1% (10,034)
Venezuela Broken Arrow:
3.7% (321)Oklahoma:
1.2% (3,010)
Philippines Broken Arrow:
3.4% (295)Oklahoma:
2.3% (5,671)
Laos Broken Arrow:
2.2% (191)Oklahoma:
1.2% (2,834)
Ukraine Broken Arrow:
1.8% (159)Oklahoma:
0.4% (983)
Syria Broken Arrow:
1.8% (159)Oklahoma:
0.3% (623)
Brazil Broken Arrow:
1.7% (150)Oklahoma:
0.6% (1,363)
Pakistan Broken Arrow:
1.7% (146)Oklahoma:
0.8% (1,923)
United Kingdom, excluding England and Scotland Broken Arrow:
1.7% (144)Oklahoma:
0.5% (1,194)
Canada Broken Arrow:
1.6% (143)Oklahoma:
2.0% (4,771)
Korea Broken Arrow:
1.6% (138)Oklahoma:
1.7% (4,140)
Russia Broken Arrow:
1.6% (136)Oklahoma:
0.5% (1,321)
China, excluding Hong Kong and Taiwan Broken Arrow:
1.6% (135)Oklahoma:
3.2% (7,698)
Turkey Broken Arrow:
1.5% (133)Oklahoma:
0.2% (473)
Uganda Broken Arrow:
1.5% (131)Oklahoma:
0.2% (429)
Place of birth for U.S.-born residents:
This state: 66,246Other state: 44,360Northeast: 3,475Midwest: 17,435South: 14,551West: 8,899 87.9% of Broken Arrow residents lived in the same house 1 years ago.
Out of people who lived in different houses, 38.4% lived in this county.
Out of people who lived in different counties, 49.5% lived in Oklahoma.
Broken Arrow:
87.9%State average:
85.5%
Education attainment for males 25 years and older:
No schooling: 648Nursery to 4th grade: 685th and 6th grade: 817th and 8th grade: 1769th grade: 28610th grade: 16111th grade: 56112th grade, no diploma: 741High school graduate (or equivalency): 9,297Less than 1 year of college: 2,406Some college more than 1 year, no degree: 6,152Associate degree: 4,747Bachelor's degree: 8,943Master's degree: 2,969Professional school degree: 861Doctorate degree: 459
Education attainment for females 25 years and older:
No schooling: 590Nursery to 4th grade: 1065th and 6th grade: 1177th and 8th grade: 1949th grade: 25610th grade: 46311th grade: 36212th grade, no diploma: 385High school graduate (or equivalency): 10,279Less than 1 year of college: 3,169Some college more than 1 year, no degree: 5,925Associate degree: 4,055Bachelor's degree: 11,867Master's degree: 3,775Professional school degree: 420Doctorate degree: 739
Housing units in structures:
One, detached: 38,268One, attached: 925Two: 8263 or 4: 5165 to 9: 1,27710 to 19: 2,37420 to 49: 1,07950 or more: 1,032Mobile homes: 1,055Median worth of mobile homes: $85,000
Housing units lacking complete plumbing facilities in 2022: 0.7%Housing units lacking complete kitchen facilities in 2022: 2.1%House/condo owner moved in on average 10 years ago
Renter moved in on average 2 years ago
Private vs. public school enrollment:
Students in private schools in grades 1 to 8 (elementary and middle school): 2,369 Students in private schools in grades 9 to 12 (high school): 961 Students in private undergraduate colleges: 1,357