Brooklyn, OH (Ohio) Houses and Residents
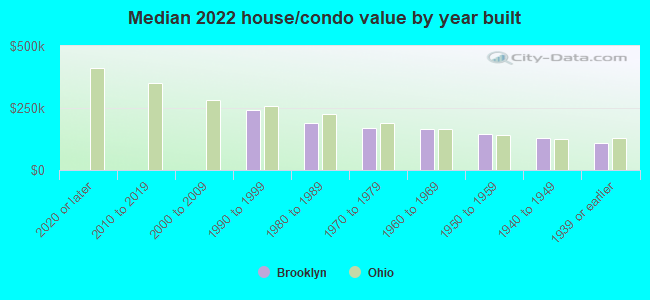
| Brooklyn: | $154,689 |
| Ohio: | $204,100 |
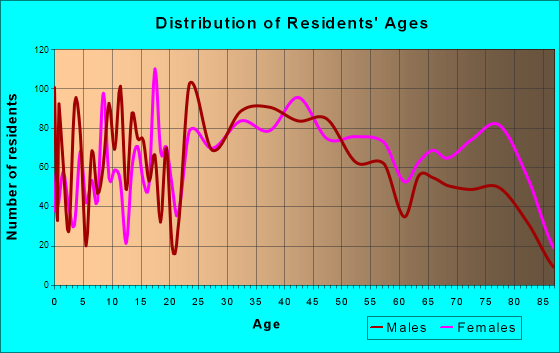
Total population: 10,947 (All urban)
Houses: 5,098 (4,756 occupied: 2,623 owner occupied, 2,160 renter occupied)
| % of renters here: | 45% |
| State: | 33% |
Housing density: 1,190 houses/condos per square mile
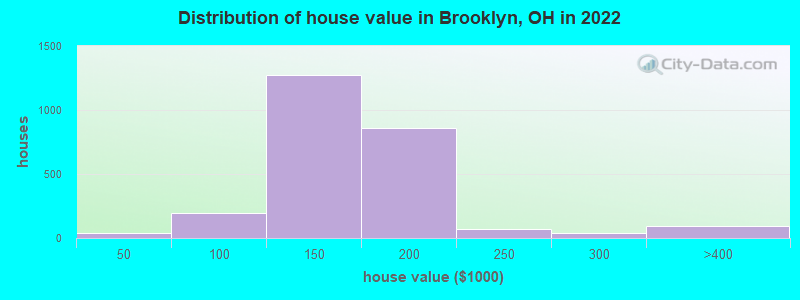
Median price asked for vacant for-sale houses and condos in 2022: $49,272.
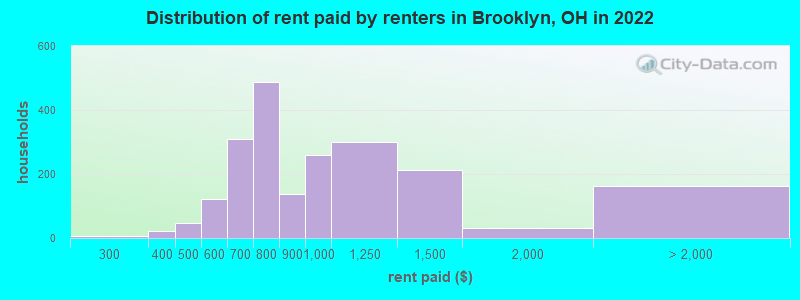
Median contract rent in 2022: $803 (lower quartile is $707, upper quartile is $1,058)
Median rent asked for vacant for-rent units in 2022: $959
Median gross rent in Brooklyn, OH in 2022: $963
Housing units in Brooklyn with a mortgage: 1,362 (97 second mortgage, 0 home equity loan, 53 both second mortgage and home equity loan)
Houses without a mortgage: 137
Median household income for houses/condos with a mortgage: $82,462
Median household income for apartments without a mortgage: $61,418
Median monthly housing costs: $913
Compare current foreclosures near Brooklyn, OH:
| Photo | Address | Area | Beds / Baths | Price | Details |
|---|---|---|---|---|---|

|
#1
E 137th St
Cleveland, OH 44120
|
1,637 sq. feet
|
1 baths 3 beds |
$59,900
|
show details |

|
#2
Ashland Dr
Brook Park, OH 44142
|
888 sq. feet
|
1 baths 3 beds |
$214,500
|
show details |

|
#3
W 52nd St
Cleveland, OH 44102
|
2,227 sq. feet
|
2 baths 4 beds |
$64,900
|
show details |

|
#4
Manorford Dr
Cleveland, OH 44130
|
1,247 sq. feet
|
1 baths 3 beds |
$164,900
|
show details |

|
#5
Sugar Ridge Rd
North Ridgeville, OH 44039
|
1,823 sq. feet
|
2 baths 4 beds |
$354,900
|
show details |

|
#6
E 194th St
Cleveland, OH 44119
|
2,342 sq. feet
|
2 baths 4 beds |
$99,900
|
show details |

|
#7
Hastings Rd
Cleveland, OH 44125
|
1,578 sq. feet
|
1 baths 4 beds |
$164,900
|
show details |

|
#8
Lee Rd
Cleveland, OH 44128
|
912 sq. feet
|
1 baths 3 beds |
$44,100
|
show details |

|
#9
Miller Ave
Cleveland, OH 44119
|
830 sq. feet
|
1 baths 2 beds |
$149,900
|
show details |

|
#10
E 128th St
Cleveland, OH 44120
|
1,894 sq. feet
|
1 baths 4 beds |
$44,900
|
show details |
| Photo | Address | Area | Beds / Baths | Price | Details |
|---|---|---|---|---|---|

|
#11
65 Noble Rd
Cleveland, OH 44112
|
- sq. feet
|
2 baths 4 beds |
$29,900
|
show details |

|
#12
Maryland Ave
Cleveland, OH 44105
|
1,908 sq. feet
|
2 baths 4 beds |
$29,900
|
show details |

|
#13
Stevenson Rd
Cleveland, OH 44110
|
2,502 sq. feet
|
2 baths 7 beds |
show details | |

|
#14
Worley Ave
Cleveland, OH 44105
|
1,956 sq. feet
|
2 baths 6 beds |
show details | |

|
#15
Daleford Rd
Cleveland, OH 44120
|
3,164 sq. feet
|
3 baths 6 beds |
show details | |

|
#16
Cleveland Rd
Cleveland, OH 44108
|
2,088 sq. feet
|
2 baths 4 beds |
show details | |

|
#17
Kirton Ave
Cleveland, OH 44135
|
1,092 sq. feet
|
1 baths 2 beds |
show details | |

|
#18
E 86th St
Cleveland, OH 44106
|
2,319 sq. feet
|
3 baths 4 beds |
show details | |

|
#19
Clifford Dr
North Olmsted, OH 44070
|
1,800 sq. feet
|
1 baths 2 beds |
show details | |

|
#20
Holland Rd
Brook Park, OH 44142
|
887 sq. feet
|
1 baths 2 beds |
show details |
| Photo | Address | Area | Beds / Baths | Price | Details |
|---|---|---|---|---|---|

|
#21
Birchwood Rd
Cleveland, OH 44125
|
1,196 sq. feet
|
1 baths 3 beds |
show details | |

|
#22
W 146th St
Cleveland, OH 44135
|
747 sq. feet
|
1 baths 2 beds |
show details | |

|
#23
Washington Blvd
Cleveland, OH 44118
|
2,005 sq. feet
|
4 baths 4 beds |
show details | |

|
#24
Berkshire Rd
Cleveland, OH 44118
|
1,690 sq. feet
|
1 baths 4 beds |
show details | |

|
#25
E 173rd St
Cleveland, OH 44110
|
1,226 sq. feet
|
1 baths 3 beds |
show details | |

|
#26
E 165th St
Cleveland, OH 44110
|
1,728 sq. feet
|
2 baths 4 beds |
show details | |

|
#27
Berkshire Rd
Cleveland, OH 44118
|
1,690 sq. feet
|
2 baths 4 beds |
show details | |

|
#28
Fayette Blvd
Brook Park, OH 44142
|
936 sq. feet
|
1 baths 3 beds |
show details | |

|
#29
Ellison Rd
Cleveland, OH 44121
|
1,498 sq. feet
|
1 baths 3 beds |
show details | |

|
#30
Hazelwood Ave
Maple Heights, OH 44137
|
1,664 sq. feet
|
2 baths 3 beds |
show details |
| Photo | Address | Area | Beds / Baths | Price | Details |
|---|---|---|---|---|---|

|
#31
Wilmore Ave
Euclid, OH 44123
|
1,356 sq. feet
|
1 baths 3 beds |
show details | |

|
#32
Gladys Ave
Lakewood, OH 44107
|
1,878 sq. feet
|
2 baths 4 beds |
show details | |

|
#33
Green Dr
Cleveland, OH 44125
|
1,120 sq. feet
|
1 baths 3 beds |
show details | |

|
#34
E 74th St
Cleveland, OH 44103
|
2,552 sq. feet
|
2 baths 6 beds |
show details | |

|
#35
Judson Dr
Cleveland, OH 44128
|
1,344 sq. feet
|
1 baths 2 beds |
show details | |

|
#36
Sandstone Ridge Way
Berea, OH 44017
|
3,657 sq. feet
|
2 baths 4 beds |
show details | |

|
#37
Skyview Dr
Independence, OH 44131
|
1,300 sq. feet
|
2 baths 3 beds |
show details | |

|
#38
Birchwood Rd
Cleveland, OH 44125
|
1,112 sq. feet
|
1 baths 4 beds |
show details | |

|
#39
Maplewood Rd
Cleveland, OH 44130
|
1,276 sq. feet
|
1 baths 3 beds |
show details | |

|
#40
David Ave
Cleveland, OH 44134
|
1,876 sq. feet
|
2 baths 4 beds |
show details |
| Photo | Address | Area | Beds / Baths | Price | Details |
|---|---|---|---|---|---|

|
#41
David Ave
Cleveland, OH 44134
|
1,876 sq. feet
|
2 baths 4 beds |
show details | |

|
#42
Glenfield Rd
Cleveland, OH 44119
|
- sq. feet
|
- baths - beds |
$34,900
|
show details |

|
#43
West 5th
Cleveland, OH 44113
|
3,341 sq. feet
|
4 baths 4 beds |
show details | |

|
#44
Helen Rd
Beachwood, OH 44122
|
1,612 sq. feet
|
1 baths 3 beds |
show details | |

|
#45
E Cobblestone Ln
Twinsburg, OH 44087
|
1,814 sq. feet
|
2 baths 3 beds |
show details | |

|
#46
W 140th St
Cleveland, OH 44111
|
1,009 sq. feet
|
1 baths 2 beds |
show details | |

|
#47
Portman Ave
Cleveland, OH 44109
|
1,248 sq. feet
|
1 baths 3 beds |
show details | |

|
#48
Prospect St
Berea, OH 44017
|
1,362 sq. feet
|
2 baths 3 beds |
show details | |

|
#49
Gladstone Rd
Beachwood, OH 44122
|
1,716 sq. feet
|
2 baths 4 beds |
show details | |

|
Check over 1 million property listings on Foreclosure.com!
|
browse all offers | |||

Latest news about housing in Brooklyn, OH collected exclusively by city-data.com from local newspapers, TV, and radio stations

 | Wow - hope housing prices remain reasonable (35 replies) |
| Cleveland's Real Estate Market is driving us crazy. (24 replies) |
| Old Brooklyn and Kamm's Corner (10 replies) |
| What are the neighborhoods like around Calvary Cemetary and Brooklyn Heights Cemetary? (1 reply) |
| Why is Ohio so cheap to live in? (57 replies) |
| Row Houses In Cleveland? (26 replies) |
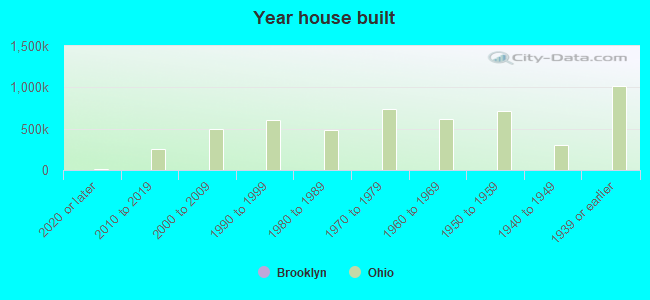
Median year apartment built: 1965
Household type by relationship:
Households: 11,074- Male householders: 2,036 (712 living alone), Female householders: 2,647 (973 living alone)
1,673 spouses (1,642 opposite-sex spouses), 465 unmarried partners, (458 opposite-sex unmarried partners), 3,084 children (2,780 natural, 34 adopted, 269 stepchildren), 133 grandchildren, 133 brothers or sisters, 405 parents, 0 foster children, 200 other relatives, 260 non-relatives
- In group quarters: 33
Size of family households: 1,414 2-persons, 598 3-persons, 461 4-persons, 222 5-persons, 12 6-persons, 71 7-or-more-persons.
Size of nonfamily households: 1,697 1-person, 249 2-persons, 64 3-persons.
913 married couples with children.
1,131 single-parent households (256 men, 875 women).
80.5% of residents of Brooklyn speak English at home.
7.7% of residents speak Spanish at home (43% speak English very well, 15% speak English well, 41% speak English not well, 1% don't speak English at all).
6.5% of residents speak other Indo-European language at home (56% speak English very well, 23% speak English well, 5% speak English not well, 17% don't speak English at all).
4.5% of residents speak Asian or Pacific Island language at home (61% speak English very well, 3% speak English well, 17% speak English not well, 19% don't speak English at all).
1.2% of residents speak other language at home (73% speak English very well, 25% speak English well, 2% speak English not well).
Foreign born population: 1,616 (14.6%)
(68.9% of them are naturalized citizens)
| Here: | 6.1 |
| State: | 6.7 |
| Here: | 4.2 |
| State: | 4.4 |
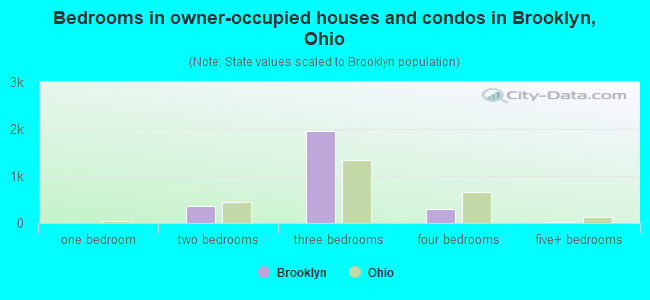
- Bedrooms in owner-occupied houses and condos in Brooklyn, Ohio
- 0no bedroom
- 81 bedroom
- 3572 bedrooms
- 1,9483 bedrooms
- 2974 bedrooms
- 135+ bedrooms
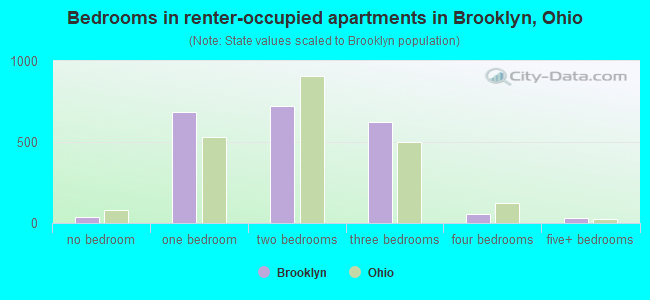
- Bedrooms in renter-occupied apartments in Brooklyn, Ohio
- 40no bedroom
- 6881 bedroom
- 7202 bedrooms
- 6233 bedrooms
- 574 bedrooms
- 325+ bedrooms
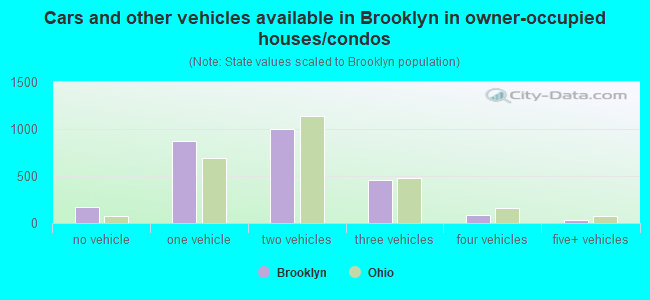
- Cars and other vehicles available in Brooklyn in owner-occupied houses/condos
- 168no vehicle
- 8771 vehicle
- 1,0022 vehicles
- 4583 vehicles
- 884 vehicles
- 305+ vehicles
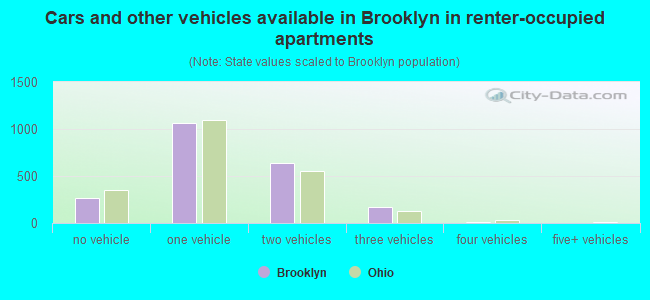
- Cars and other vehicles available in Brooklyn in renter-occupied apartments
- 269no vehicle
- 1,0681 vehicle
- 6402 vehicles
- 1693 vehicles
- 154 vehicles
- 05+ vehicles
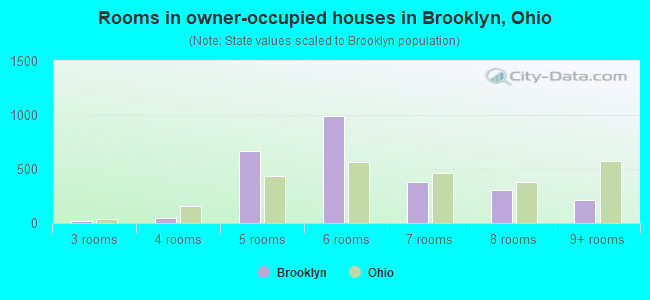
- Rooms in owner-occupied houses in Brooklyn, Ohio
- 01 room
- 02 rooms
- 233 rooms
- 434 rooms
- 6685 rooms
- 9886 rooms
- 3837 rooms
- 3088 rooms
- 2109+ rooms
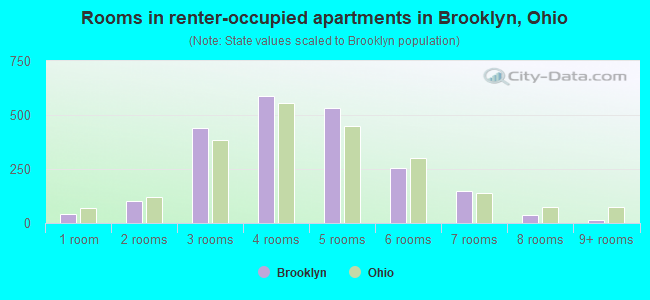
- Rooms in renter-occupied apartments in Brooklyn, Ohio
- 401 room
- 1042 rooms
- 4423 rooms
- 5864 rooms
- 5335 rooms
- 2566 rooms
- 1497 rooms
- 388 rooms
- 129+ rooms
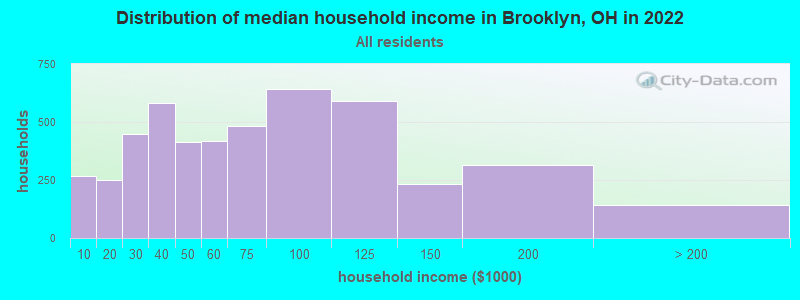
Brooklyn, OH household income distribution

- 266Less than $10,000
- 250$10,000 to $19,999
- 449$20,000 to $29,999
- 581$30,000 to $39,999
- 415$40,000 to $49,999
- 420$50,000 to $59,999
- 483$60,000 to $74,999
- 644$75,000 to $99,999
- 591$100,000 to $124,999
- 234$125,000 to $149,999
- 315$150,000 to $199,999
- 141$200,000 or more
Home value of owner - occupied houses in 2022 in Brooklyn, OH
-
- 10Less than $10,000
- 15$10,000 to $14,999
- 13$40,000 to $49,999
- 48$50,000 to $59,999
- 15$60,000 to $69,999
- 7$70,000 to $79,999
- 19$80,000 to $89,999
- 94$90,000 to $99,999
- 606$100,000 to $124,999
- 666$125,000 to $149,999
- 608$150,000 to $174,999
- 248$175,000 to $199,999
- 74$200,000 to $249,999
- 37$250,000 to $299,999
- 78$300,000 to $399,999
- 8$500,000 to $749,999
- 8$750,000 to $999,999
Rent paid by renters in 2022 in Brooklyn, OH
-
- 5$250 to $299
- 20$350 to $399
- 45$450 to $499
- 37$500 to $549
- 84$550 to $599
- 152$600 to $649
- 154$650 to $699
- 177$700 to $749
- 309$750 to $799
- 137$800 to $899
- 259$900 to $999
- 298$1,000 to $1,249
- 214$1,250 to $1,499
- 32$1,500 to $1,999
- 23$3,000 to $3,499
- 139No cash rent
Percentage of workers working in this county: 87.8%
Number of people working at home: 621 (11.9% of all workers)
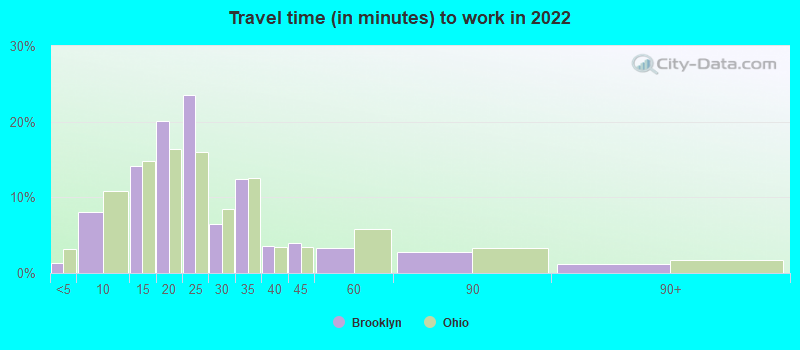
Travel time to work (commute)
- Less than 5 minutes: 67
- 5 to 9 minutes: 533
- 10 to 14 minutes: 684
- 15 to 19 minutes: 765
- 20 to 24 minutes: 948
- 25 to 29 minutes: 319
- 30 to 34 minutes: 721
- 35 to 39 minutes: 39
- 40 to 44 minutes: 132
- 45 to 59 minutes: 80
- 60 to 89 minutes: 172
- 90 or more minutes: 98
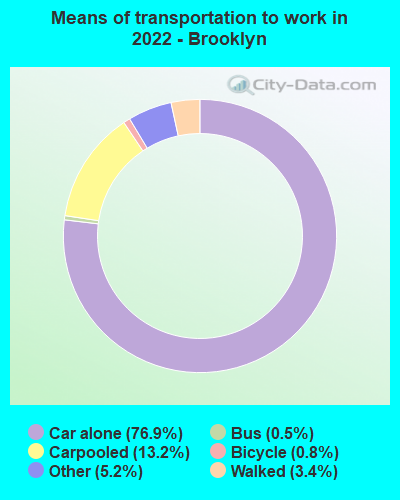
Means of transportation to work:
- Drove a car alone: 7,239 (70.0%)
- Carpooled: 1,258 (12.2%)
- Bus: 41 (0.4%)
- Taxi: 508 (4.9%)
- Bicycle: 120 (1.2%)
- Walked: 372 (3.6%)
- Worked at home: 621 (6.0%)
- Unemployment by race in 2022
- Unemployment rate for White non-Hispanic residents
- 1.7%Males
- 6.5%Females
- Unemployment rate for Black residents
- 3.9%Males
- Unemployment rate for two or more race residents
- 21.0%Females
- Unemployment rate for Hispanic or Latino residents
- 4.6%Males
- 4.2%Females
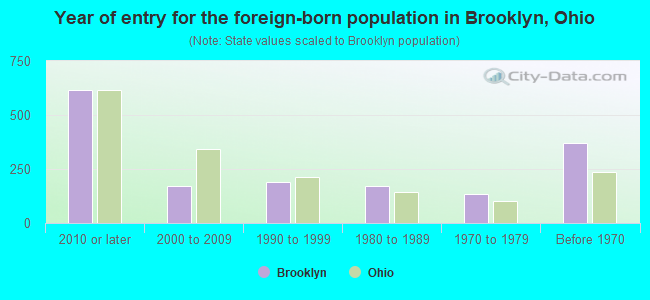
- Year of entry for the foreign-born population in Brooklyn, Ohio
- 6172010 or later
- 1702000 to 2009
- 1911990 to 1999
- 1701980 to 1989
- 1351970 to 1979
- 369Before 1970
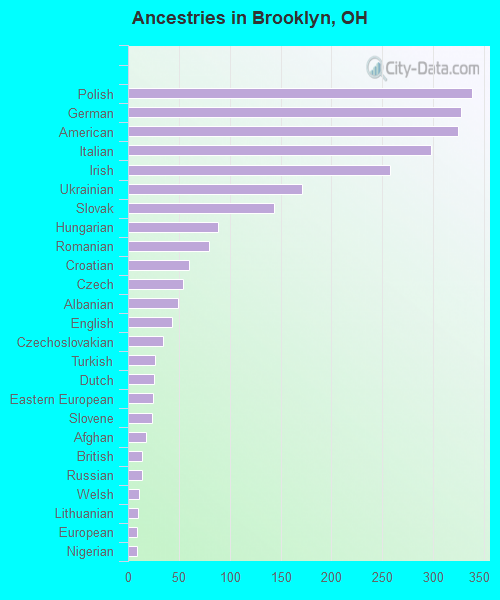
First ancestries reported:
- Polish: 338 (6.7%)
- German: 327 (6.5%)
- American: 324 (6.5%)
- Italian: 298 (5.9%)
- Irish: 258 (5.1%)
- Ukrainian: 171 (3.4%)
- Slovak: 144 (2.9%)
- Hungarian: 88 (1.8%)
- Romanian: 80 (1.6%)
- Croatian: 60 (1.2%)
- Czech: 54 (1.1%)
- Albanian: 49 (1.0%)
- English: 43 (0.9%)
- Czechoslovakian: 34 (0.7%)
- Turkish: 27 (0.5%)
- Dutch: 26 (0.5%)
- Eastern European: 25 (0.5%)
- Slovene: 24 (0.5%)
- Afghan: 18 (0.4%)
- British: 14 (0.3%)
- Russian: 14 (0.3%)
- Welsh: 11 (0.2%)
- Lithuanian: 10 (0.2%)
- European: 9 (0.2%)
- Nigerian: 9 (0.2%)
- Yugoslavian: 9 (0.2%)
- Scottish: 8 (0.2%)
- Moroccan: 7 (0.1%)
- African: 7 (0.1%)
- Swiss: 7 (0.1%)
Most common places of birth for foreign-born residents (%):
| Brooklyn: | 11.6% (195) |
| Ohio: | 1.6% (9,312) |
| Brooklyn: | 11.1% (186) |
| Ohio: | 2.0% (11,398) |
| Brooklyn: | 10.9% (183) |
| Ohio: | 2.4% (13,773) |
| Brooklyn: | 10.4% (174) |
| Ohio: | 3.1% (17,818) |
| Brooklyn: | 8.8% (147) |
| Ohio: | 1.9% (10,960) |
| Brooklyn: | 6.3% (105) |
| Ohio: | 1.1% (6,549) |
| Brooklyn: | 6.1% (102) |
| Ohio: | 1.1% (6,346) |
| Brooklyn: | 5.0% (84) |
| Ohio: | 0.2% (1,151) |
| Brooklyn: | 2.9% (49) |
| Ohio: | 1.2% (6,679) |
| Brooklyn: | 2.7% (46) |
| Ohio: | 0.4% (2,094) |
| Brooklyn: | 2.7% (46) |
| Ohio: | 0.7% (4,155) |
| Brooklyn: | 2.4% (40) |
| Ohio: | 1.7% (9,564) |
| Brooklyn: | 2.1% (36) |
| Ohio: | 0.1% (700) |
| Brooklyn: | 1.7% (29) |
| Ohio: | 0.4% (2,185) |
| Brooklyn: | 1.7% (29) |
| Ohio: | 0.5% (2,962) |
| Brooklyn: | 1.7% (28) |
| Ohio: | 1.9% (10,777) |
| Brooklyn: | 1.7% (28) |
| Ohio: | 2.2% (12,846) |
Place of birth for U.S.-born residents:
- This state: 7,747
- Other state: 1,525
- Northeast: 512
- Midwest: 221
- South: 585
- West: 203
85.2% of Brooklyn residents lived in the same house 1 years ago.
Out of people who lived in different houses, 41.3% lived in this county.
Out of people who lived in different counties, 96.0% lived in Ohio.
| Brooklyn: | 85.2% |
| State average: | 87.8% |
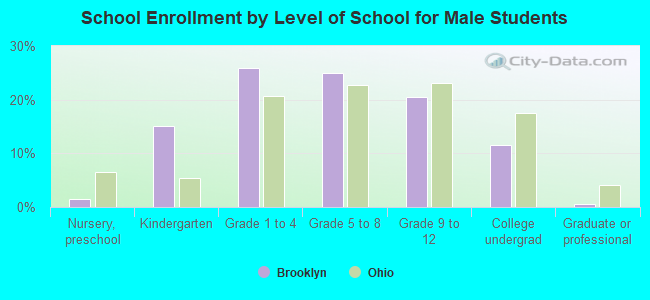
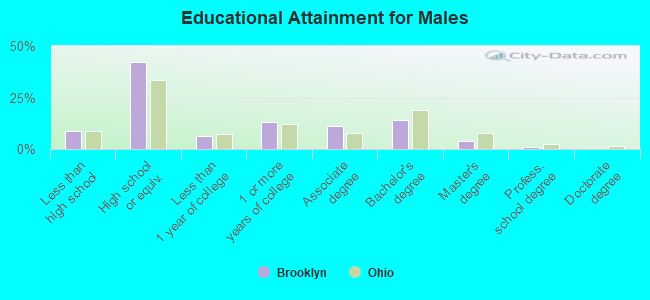
Education attainment for males 25 years and older:
- No schooling: 57
- Nursery to 4th grade: 0
- 5th and 6th grade: 22
- 7th and 8th grade: 38
- 9th grade: 29
- 10th grade: 24
- 11th grade: 47
- 12th grade, no diploma: 89
- High school graduate (or equivalency): 1,491
- Less than 1 year of college: 222
- Some college more than 1 year, no degree: 458
- Associate degree: 393
- Bachelor's degree: 495
- Master's degree: 142
- Professional school degree: 31
- Doctorate degree: 1
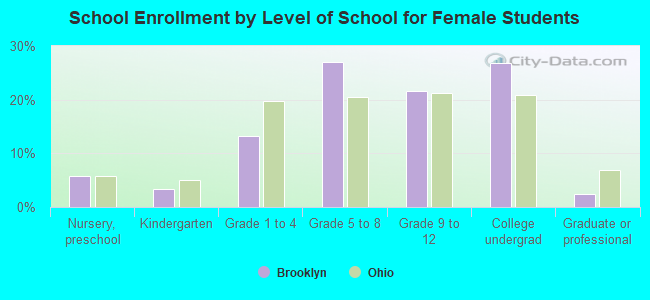
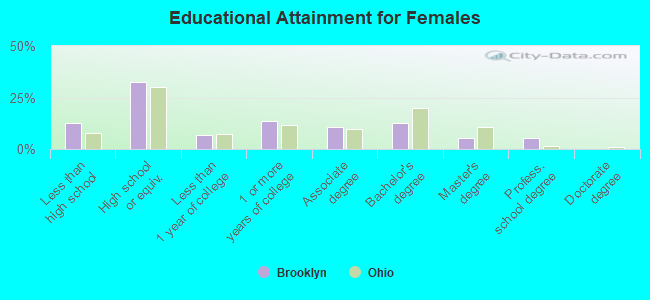
Education attainment for females 25 years and older:
- No schooling: 72
- Nursery to 4th grade: 14
- 5th and 6th grade: 18
- 7th and 8th grade: 13
- 9th grade: 213
- 10th grade: 76
- 11th grade: 75
- 12th grade, no diploma: 85
- High school graduate (or equivalency): 1,444
- Less than 1 year of college: 304
- Some college more than 1 year, no degree: 605
- Associate degree: 476
- Bachelor's degree: 552
- Master's degree: 247
- Professional school degree: 234
- Doctorate degree: 0
Housing units in structures:
- One, detached: 3,448
- One, attached: 169
- Two: 238
- 3 or 4: 46
- 5 to 9: 83
- 10 to 19: 330
- 20 to 49: 242
- 50 or more: 531
- Mobile homes: 5
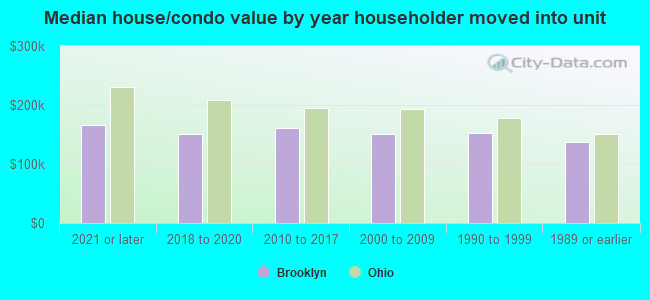
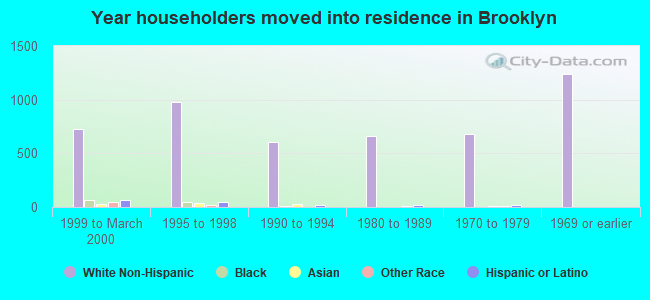
House/condo owner moved in on average 16 years ago
Renter moved in on average 5 years ago
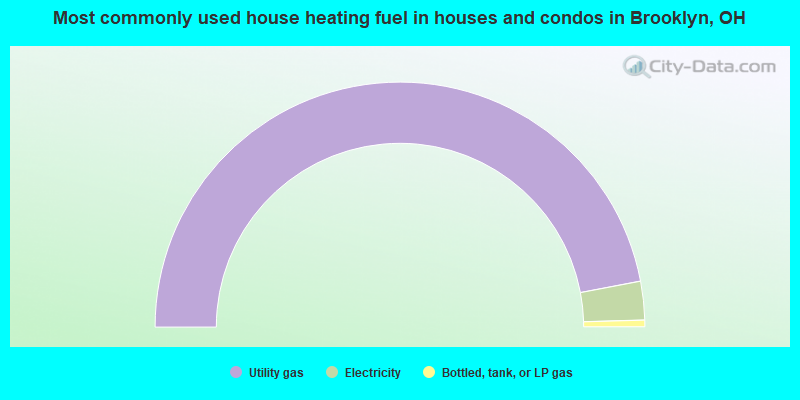
- 94.0%Utility gas
- 5.1%Electricity
- 0.9%Bottled, tank, or LP gas
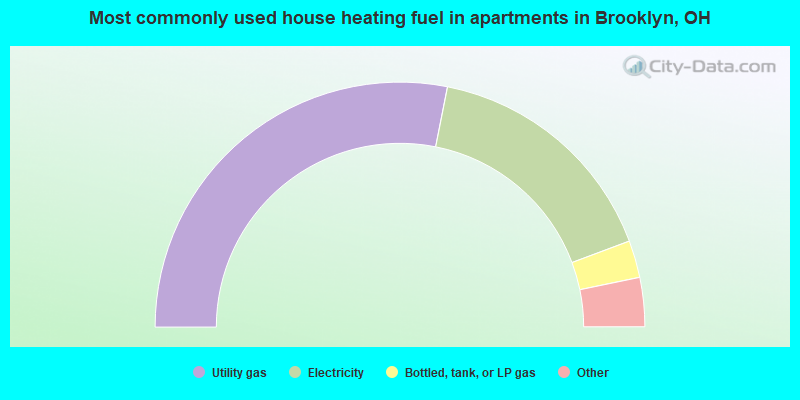
- 56.3%Utility gas
- 32.4%Electricity
- 4.9%Bottled, tank, or LP gas
- 3.3%Other fuel
- 2.1%No fuel used
- 1.0%Fuel oil, kerosene, etc.
Private vs. public school enrollment:
| Here: | 19.1% |
| Ohio: | 16.0% |
| Here: | 10.6% |
| Ohio: | 13.1% |
| Here: | 12.6% |
| Ohio: | 22.3% |