Housing density: 108 houses/condos per square mile
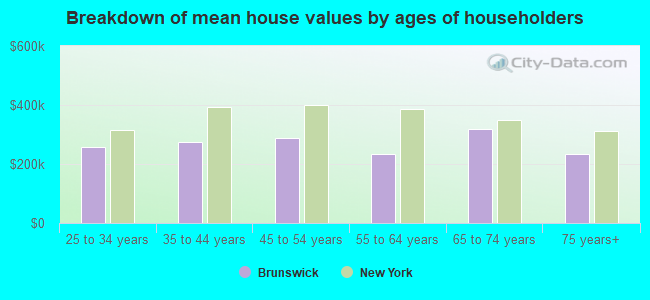
Median price asked for vacant for-sale houses and condos in 2022 in this county: $148,286.
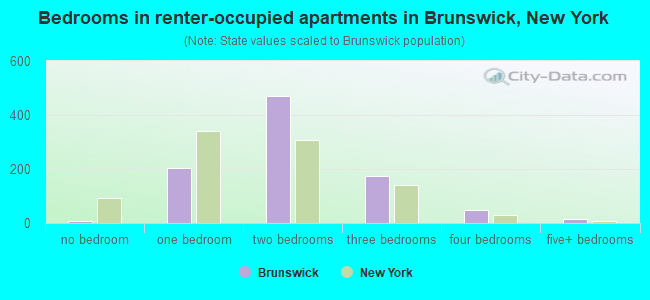
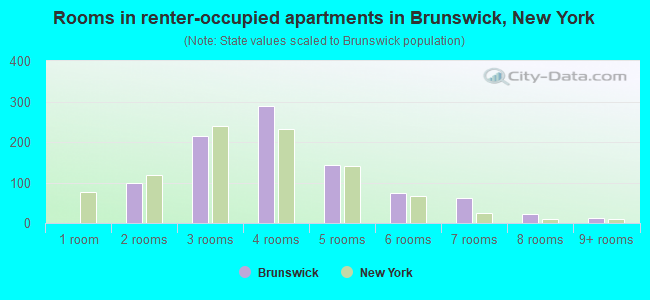
Median contract rent in 2022: $1,290 (lower quartile is $1,036, upper quartile is $1,560)
Median rent asked for vacant for-rent units in 2022: $1,144
Median gross rent in Brunswick, NY in 2022: $1,452
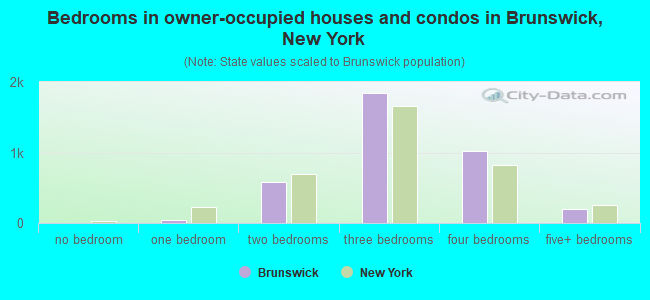
Housing units in Brunswick with a mortgage: 2,100 (127 second mortgage, 362 home equity loan, 0 both second mortgage and home equity loan) Houses without a mortgage: 981
In family households: 121,578 (26,086 male householders, 13,830 female householders)
28,550 spouses, 42,753 children (39,996 natural, 1,013 adopted, 1,744 stepchildren), 2,200 grandchildren, 1,165 brothers or sisters, 1,074 parents, foster children, 1,205 other relatives, 4,034 non-relatives
In nonfamily households: 32,244 (11,902 male householders (8,611 living alone)), 12,884 female householders (10,337 living alone)), 7,458 nonrelatives
In group quarters: 5,607 (1,424 institutionalized population)
24,272 married couples with children.
9,882 single-parent households (2,314 men, 7,568 women).
94.9% of residents of Brunswick speak English at home.
1.8% of residents speak Spanish at home (76% speak English very well, 21% speak English well, 4% speak English not well).
2.4% of residents speak other Indo-European language at home (80% speak English very well, 8% speak English well, 11% speak English not well).
0.7% of residents speak Asian or Pacific Island language at home (75% speak English very well, 25% speak English well).
0.1% of residents speak other language at home (47% speak English very well, 53% speak English not well).
Foreign born population: 630 (5.1%)
(85.4% of them are naturalized citizens)
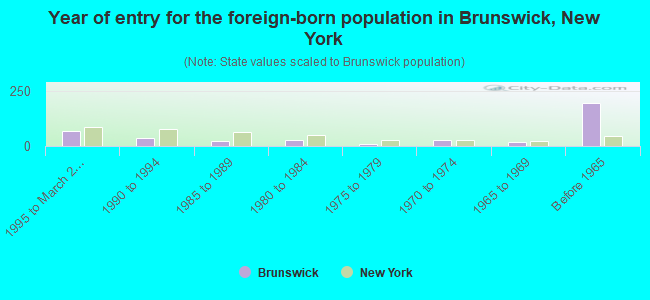
Year of entry for the foreign-born population in Brunswick, New York
701995 to March 2000
371990 to 1994
221985 to 1989
291980 to 1984
71975 to 1979
251970 to 1974
171965 to 1969
193Before 1965
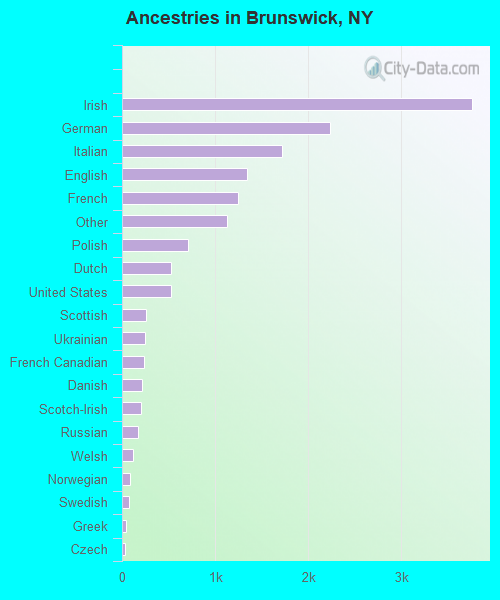
First ancestries reported:
Irish: 3,757 (25.1%)
German: 2,239 (14.9%)
Italian: 1,722 (11.5%)
English: 1,347 (9.0%)
French: 1,248 (8.3%)
Other: 1,127 (7.5%)
Polish: 713 (4.8%)
Dutch: 526 (3.5%)
United States: 524 (3.5%)
Scottish: 258 (1.7%)
Ukrainian: 242 (1.6%)
French Canadian: 238 (1.6%)
Danish: 216 (1.4%)
Scotch-Irish: 208 (1.4%)
Russian: 169 (1.1%)
Welsh: 114 (0.8%)
Norwegian: 84 (0.6%)
Swedish: 77 (0.5%)
Greek: 42 (0.3%)
Czech: 36 (0.2%)
Hungarian: 27 (0.2%)
Arab: 23 (0.2%)
Swiss: 21 (0.1%)
Lithuanian: 16 (0.1%)
Slovak: 15 (0.1%)
Portuguese: 8 (0.05%)
Most common places of birth for foreign-born residents (%):
Canada
Brunswick:
16.2% (65)
New York:
1.4% (54,876)
Korea
Brunswick:
11.5% (46)
New York:
2.5% (97,933)
Philippines
Brunswick:
8.2% (33)
New York:
1.9% (72,408)
Italy
Brunswick:
7.8% (31)
New York:
3.8% (147,729)
Taiwan
Brunswick:
5.0% (20)
New York:
0.8% (30,473)
India
Brunswick:
4.8% (19)
New York:
3.0% (117,238)
Dominican Republic
Brunswick:
4.2% (17)
New York:
10.5% (408,086)
Other Northern Europe
Brunswick:
4.0% (16)
New York:
0.2% (7,839)
Germany
Brunswick:
4.0% (16)
New York:
1.8% (69,327)
Ukraine
Brunswick:
4.0% (16)
New York:
2.1% (82,238)
United Kingdom
Brunswick:
3.5% (14)
New York:
1.6% (62,237)
Turkey
Brunswick:
3.5% (14)
New York:
0.4% (16,228)
Ireland
Brunswick:
3.2% (13)
New York:
1.1% (41,934)
Mexico
Brunswick:
3.2% (13)
New York:
4.2% (161,189)
Lebanon
Brunswick:
2.8% (11)
New York:
0.2% (7,531)
Japan
Brunswick:
2.5% (10)
New York:
0.8% (32,034)
China, excluding Hong Kong and Taiwan
Brunswick:
2.2% (9)
New York:
6.0% (233,766)
Jamaica
Brunswick:
2.0% (8)
New York:
5.9% (226,470)
Netherlands
Brunswick:
1.8% (7)
New York:
0.2% (6,545)
Other Australian and New Zealand Subregion
Brunswick:
1.8% (7)
New York:
0.0% (1,294)
Place of birth for U.S.-born residents:
This state: 9,967
Other state: 1,273
Northeast: 695
Midwest: 216
South: 265
West: 97
73% of Brunswick residents lived in the same house 5 years ago. Out of people who lived in different houses, 66% lived in this county. Out of people who lived in different counties, 70% lived in New York.
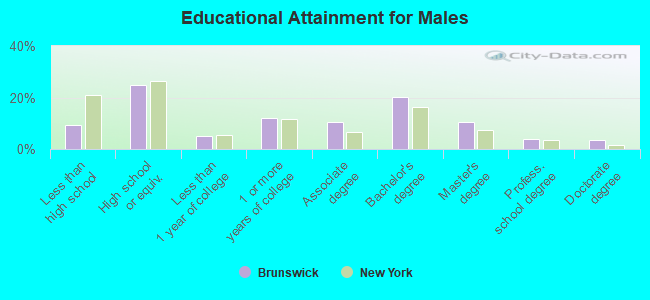
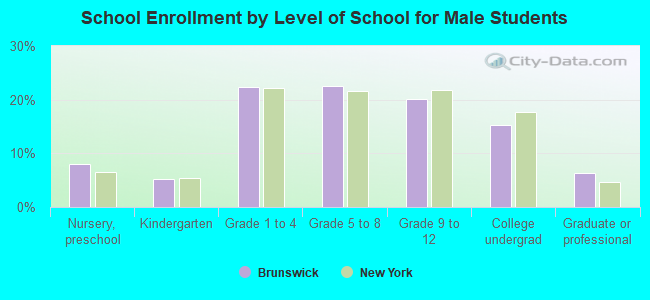
Education attainment for males 25 years and older:
No schooling: 0
Nursery to 4th grade: 17
5th and 6th grade: 0
7th and 8th grade: 95
9th grade: 76
10th grade: 49
11th grade: 25
12th grade, no diploma: 102
High school graduate (or equivalency): 960
Less than 1 year of college: 189
Some college more than 1 year, no degree: 462
Associate degree: 413
Bachelor's degree: 788
Master's degree: 414
Professional school degree: 158
Doctorate degree: 131
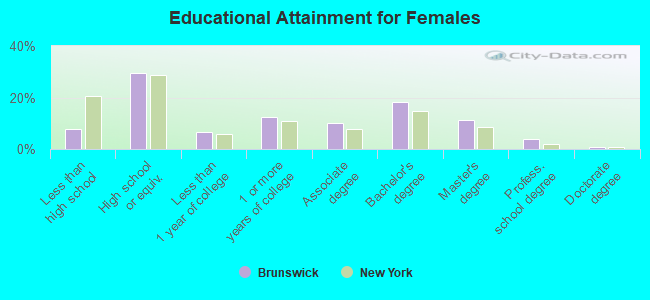
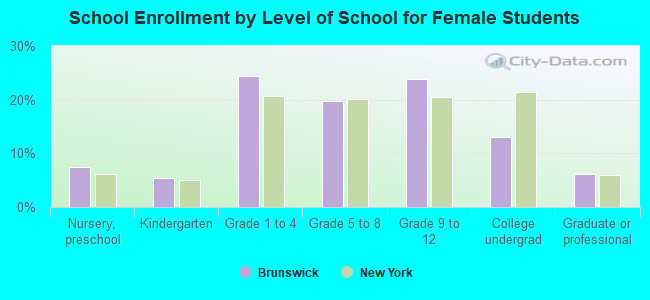
Education attainment for females 25 years and older:
No schooling: 7
Nursery to 4th grade: 35
5th and 6th grade: 16
7th and 8th grade: 80
9th grade: 51
10th grade: 34
11th grade: 5
12th grade, no diploma: 109
High school graduate (or equivalency): 1,260
Less than 1 year of college: 281
Some college more than 1 year, no degree: 528
Associate degree: 435
Bachelor's degree: 776
Master's degree: 485
Professional school degree: 159
Doctorate degree: 34
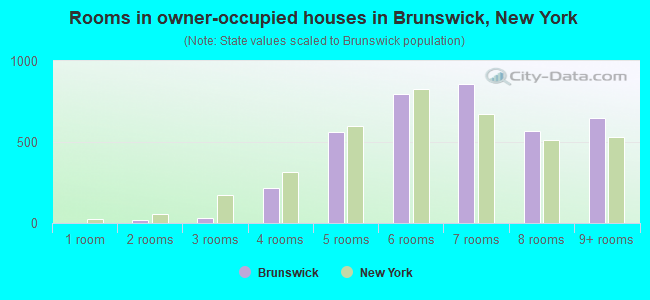
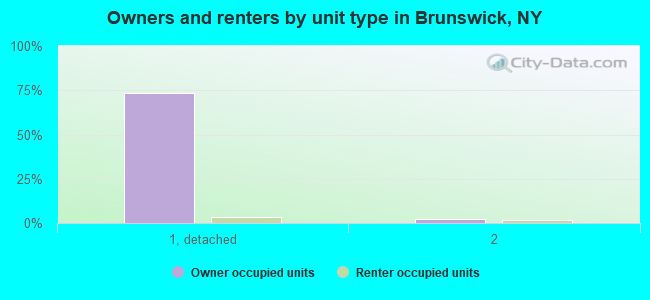
Housing units in structures:
One, detached: 3,669
One, attached: 93
Two: 178
3 or 4: 158
5 to 9: 69
10 to 19: 481
Mobile homes: 171
Median worth of mobile homes: $41,850
Housing units lacking complete plumbing facilities: 0.7%
Housing units lacking complete kitchen facilities: 0.5%