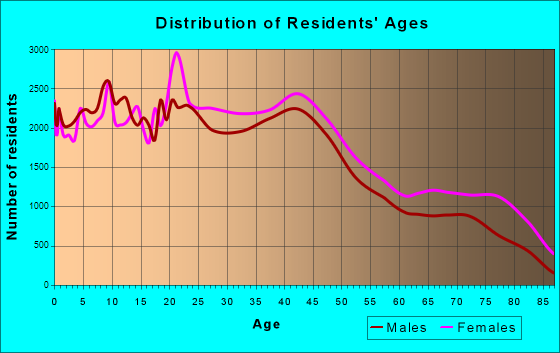
Buffalo, NY (New York) Houses and Residents
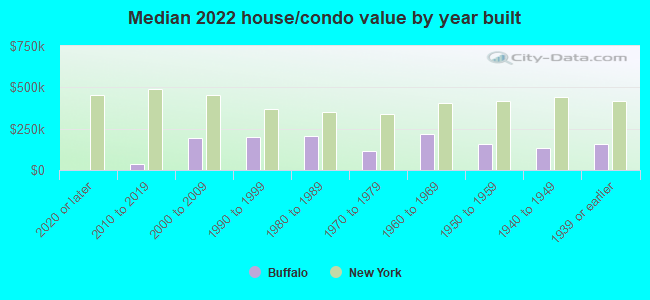
| Buffalo: | $160,700 |
| New York: | $400,400 |
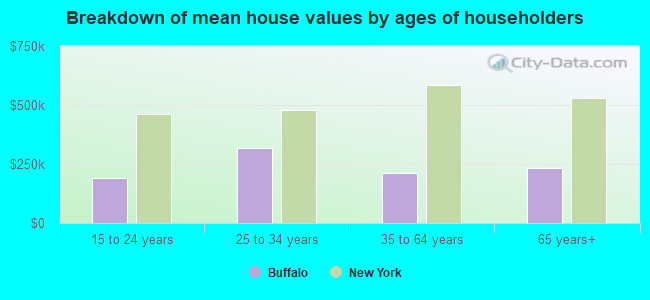
Mean price in 2022:
Detached houses: $186,583
Here: $186,583 State: $476,719 Townhouses or other attached units: $317,054
Here: $317,054 State: $699,270 In 2-unit structures: $201,013
Here: $201,013 State: $713,077 In 3-to-4-unit structures: $185,447
Here: $185,447 State: $764,568 In 5-or-more-unit structures: $496,977
Here: $496,977 State: $912,009 Mobile homes: $58,357
Here: $58,357 State: $88,925
Total population: 258,703 (All urban)
Houses: 139,156 (122,578 occupied: 53,390 owner occupied, 69,188 renter occupied)
| % of renters here: | 56% |
| State: | 46% |
Housing density: 3,426 houses/condos per square mile
Median price asked for vacant for-sale houses and condos in 2022: $98,997.
Median contract rent in 2022: $797 (lower quartile is $604, upper quartile is $1,101)
Median rent asked for vacant for-rent units in 2022: $1,109
Median gross rent in Buffalo, NY in 2022: $970
Housing units in Buffalo with a mortgage: 25,795 (2,521 second mortgage, 41 home equity loan, 2,331 both second mortgage and home equity loan)
Houses without a mortgage: 1,791
Median household income for houses/condos with a mortgage: $82,072
Median household income for apartments without a mortgage: $48,735
Median monthly housing costs: $875
Compare current foreclosures in Buffalo, NY:
| Photo | Address | Area | Beds / Baths | Price | Details |
|---|---|---|---|---|---|

|
#1
Heussy Ave
Buffalo, NY 14220
|
1,455 sq. feet
|
2 baths 3 beds |
$259,900
|
show details |

|
#2
Tremaine Ave
Buffalo, NY 14217
|
1,144 sq. feet
|
1 baths 3 beds |
$251,900
|
show details |

|
#3
Saint Lawrence Ave
Buffalo, NY 14216
|
1,868 sq. feet
|
2 baths 4 beds |
show details | |

|
#4
Newman St
Buffalo, NY 14218
|
1,344 sq. feet
|
1 baths 3 beds |
show details | |

|
#5
Fernhill Ave
Buffalo, NY 14215
|
2,180 sq. feet
|
2 baths 4 beds |
show details | |

|
#6
Palmer Ave
Buffalo, NY 14217
|
1,823 sq. feet
|
2 baths 3 beds |
show details | |

|
#7
Kenova St
Buffalo, NY 14214
|
1,105 sq. feet
|
1 baths 3 beds |
show details | |

|
#8
George Dr
Buffalo, NY 14224
|
1,706 sq. feet
|
1 baths 3 beds |
show details | |

|
#9
Wheaton Dr
Buffalo, NY 14225
|
832 sq. feet
|
1 baths 3 beds |
show details | |

|
#10
Dempster St
Buffalo, NY 14206
|
1,070 sq. feet
|
1 baths 3 beds |
show details |
| Photo | Address | Area | Beds / Baths | Price | Details |
|---|---|---|---|---|---|

|
#11
Colvin Blvd
Buffalo, NY 14223
|
3,258 sq. feet
|
4 baths 5 beds |
show details | |

|
#12
Dickens Rd
Buffalo, NY 14219
|
2,318 sq. feet
|
1 baths 4 beds |
show details | |

|
#13
Laird Ave
Buffalo, NY 14207
|
2,208 sq. feet
|
2 baths 6 beds |
show details | |

|
#14
Alma Ave
Buffalo, NY 14215
|
2,366 sq. feet
|
2 baths 4 beds |
show details | |

|
#15
Cantwell Dr
Buffalo, NY 14220
|
972 sq. feet
|
1 baths 2 beds |
show details | |

|
#16
Shamokin Dr
Buffalo, NY 14218
|
1,420 sq. feet
|
1 baths 3 beds |
show details | |

|
#17
Aurora Ave
Buffalo, NY 14224
|
1,040 sq. feet
|
1 baths 2 beds |
show details | |

|
#18
E Frontier Dr
Buffalo, NY 14219
|
1,136 sq. feet
|
1 baths 3 beds |
show details | |

|
#19
Northumberland Ave
Buffalo, NY 14215
|
1,080 sq. feet
|
1 baths 3 beds |
show details | |

|
#20
Lisbon Ave
Buffalo, NY 14215
|
1,924 sq. feet
|
2 baths 3 beds |
show details |
| Photo | Address | Area | Beds / Baths | Price | Details |
|---|---|---|---|---|---|

|
#21
Northland Ave
Buffalo, NY 14208
|
1,804 sq. feet
|
1 baths 4 beds |
show details | |

|
#22
Lake Ave
Buffalo, NY 14219
|
1,847 sq. feet
|
1 baths 3 beds |
show details | |

|
#23
N Maple Dr
Buffalo, NY 14221
|
1,565 sq. feet
|
2 baths 5 beds |
show details | |

|
#24
Sumner Pl # 1
Buffalo, NY 14211
|
2,296 sq. feet
|
2 baths 6 beds |
show details | |

|
#25
Kentucky St
Buffalo, NY 14204
|
1,449 sq. feet
|
1 baths 3 beds |
show details | |

|
#26
Laurel St
Buffalo, NY 14208
|
2,136 sq. feet
|
2 baths 7 beds |
show details | |

|
#27
William Price Pkwy
Buffalo, NY 14214
|
2,775 sq. feet
|
2 baths 4 beds |
show details | |

|
#28
Orange St
Buffalo, NY 14204
|
1,852 sq. feet
|
2 baths 5 beds |
show details | |

|
#29
Grote St
Buffalo, NY 14207
|
1,672 sq. feet
|
2 baths 4 beds |
show details | |

|
#30
Greenhill Ter
Buffalo, NY 14224
|
1,347 sq. feet
|
1 baths 3 beds |
show details |
| Photo | Address | Area | Beds / Baths | Price | Details |
|---|---|---|---|---|---|

|
#31
Bennett Village Ter # 1
Buffalo, NY 14214
|
2,328 sq. feet
|
2 baths 6 beds |
show details | |

|
#32
Clayton St
Buffalo, NY 14207
|
1,008 sq. feet
|
1 baths 3 beds |
show details | |

|
#33
Bain Pkwy
Buffalo, NY 14219
|
1,274 sq. feet
|
1 baths 3 beds |
show details | |

|
#34
Decker St
Buffalo, NY 14215
|
1,474 sq. feet
|
1 baths 3 beds |
show details | |

|
#35
Delaware Ave
Buffalo, NY 14209
|
1,086 sq. feet
|
1 baths 2 beds |
show details | |

|
#36
Kent St
Buffalo, NY 14219
|
1,482 sq. feet
|
1 baths 3 beds |
show details | |

|
#37
Hickory St
Buffalo, NY 14204
|
1,320 sq. feet
|
1 baths 3 beds |
show details | |

|
#38
Grider St
Buffalo, NY 14215
|
1,384 sq. feet
|
1 baths 4 beds |
show details | |

|
#39
Sheffield Ave
Buffalo, NY 14220
|
2,420 sq. feet
|
2 baths 6 beds |
show details | |

|
#40
Cherokee Dr
Buffalo, NY 14225
|
856 sq. feet
|
1 baths 3 beds |
show details |
| Photo | Address | Area | Beds / Baths | Price | Details |
|---|---|---|---|---|---|

|
#41
Walden Ave
Buffalo, NY 14211
|
1,560 sq. feet
|
2 baths 4 beds |
show details | |

|
#42
Ridge Park Ave
Buffalo, NY 14211
|
1,713 sq. feet
|
2 baths 4 beds |
show details | |

|
#43
Leocrest Ct
Buffalo, NY 14224
|
1,176 sq. feet
|
1 baths 3 beds |
show details | |

|
#44
Walden Ave
Buffalo, NY 14211
|
1,792 sq. feet
|
1 baths 5 beds |
show details | |

|
#45
Weimar St
Buffalo, NY 14206
|
1,718 sq. feet
|
2 baths 4 beds |
show details | |

|
#46
N Ogden St
Buffalo, NY 14212
|
2,296 sq. feet
|
2 baths 6 beds |
show details | |

|
#47
Cleveland Ave
Buffalo, NY 14222
|
2,112 sq. feet
|
2 baths 3 beds |
show details | |

|
#48
Parker Blvd
Buffalo, NY 14223
|
1,772 sq. feet
|
1 baths 3 beds |
show details | |

|
#49
Thorndale Ave
Buffalo, NY 14224
|
864 sq. feet
|
2 baths 2 beds |
show details | |

|
Check over 1 million property listings on Foreclosure.com!
|
browse all offers | |||

Latest news about housing in Buffalo, NY collected exclusively by city-data.com from local newspapers, TV, and radio stations


Median year apartment built: 1938
Household type by relationship:
Households: 276,491- Male householders: 52,944 (24,453 living alone), Female householders: 69,634 (26,599 living alone)
30,657 spouses (30,236 opposite-sex spouses), 10,822 unmarried partners, (9,733 opposite-sex unmarried partners), 75,955 children (73,662 natural, 1,151 adopted, 1,142 stepchildren), 6,168 grandchildren, 3,366 brothers or sisters, 3,116 parents, 49 foster children, 2,893 other relatives, 13,382 non-relatives
- In group quarters: 7,505
Size of family households: 27,516 2-persons, 12,514 3-persons, 8,999 4-persons, 6,188 5-persons, 2,311 6-persons, 1,387 7-or-more-persons.
Size of nonfamily households: 51,052 1-person, 9,792 2-persons, 772 3-persons, 1,307 4-persons, 526 5-persons, 154 6-persons, 60 7-or-more-persons.
27,028 married couples with children.
26,727 single-parent households (5,162 men, 21,565 women).
81.3% of residents of Buffalo speak English at home.
6.6% of residents speak Spanish at home (63% speak English very well, 17% speak English well, 13% speak English not well, 7% don't speak English at all).
6.0% of residents speak other Indo-European language at home (56% speak English very well, 27% speak English well, 13% speak English not well, 3% don't speak English at all).
3.2% of residents speak Asian or Pacific Island language at home (56% speak English very well, 15% speak English well, 27% speak English not well, 3% don't speak English at all).
2.9% of residents speak other language at home (58% speak English very well, 23% speak English well, 12% speak English not well, 7% don't speak English at all).
Foreign born population: 27,699 (10.0%)
(49.6% of them are naturalized citizens)
| Here: | 6.7 |
| State: | 6.3 |
| Here: | 4.8 |
| State: | 3.8 |
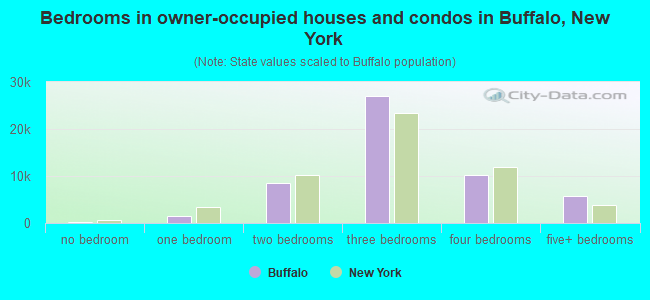
- Bedrooms in owner-occupied houses and condos in Buffalo, New York
- 232no bedroom
- 1,5711 bedroom
- 8,4972 bedrooms
- 26,9833 bedrooms
- 10,2744 bedrooms
- 5,8335+ bedrooms
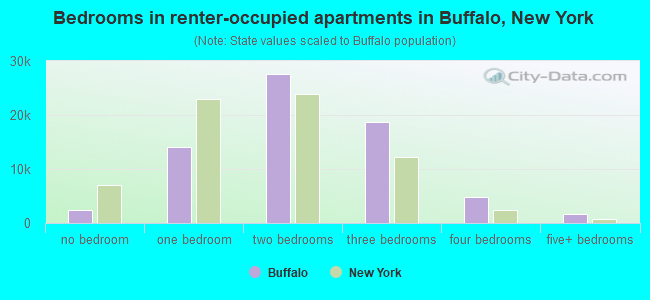
- Bedrooms in renter-occupied apartments in Buffalo, New York
- 2,341no bedroom
- 14,0501 bedroom
- 27,6172 bedrooms
- 18,7703 bedrooms
- 4,7974 bedrooms
- 1,6135+ bedrooms
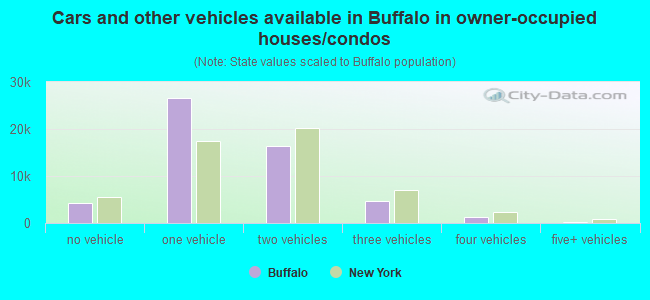
- Cars and other vehicles available in Buffalo in owner-occupied houses/condos
- 4,321no vehicle
- 26,7021 vehicle
- 16,3352 vehicles
- 4,6083 vehicles
- 1,1774 vehicles
- 2475+ vehicles
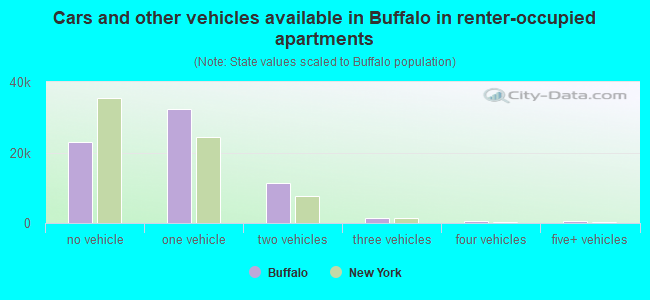
- Cars and other vehicles available in Buffalo in renter-occupied apartments
- 23,070no vehicle
- 32,2381 vehicle
- 11,2282 vehicles
- 1,4853 vehicles
- 5584 vehicles
- 6095+ vehicles
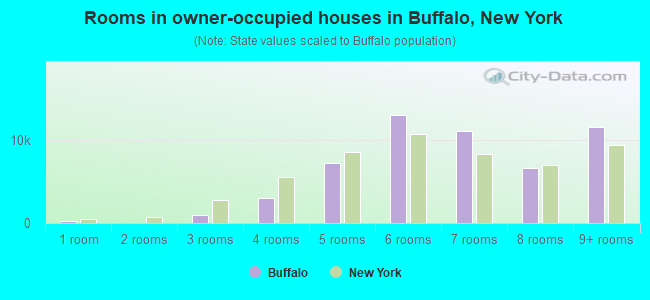
- Rooms in owner-occupied houses in Buffalo, New York
- 2321 room
- 02 rooms
- 9543 rooms
- 2,9644 rooms
- 7,1555 rooms
- 12,9466 rooms
- 11,0007 rooms
- 6,5778 rooms
- 11,5629+ rooms
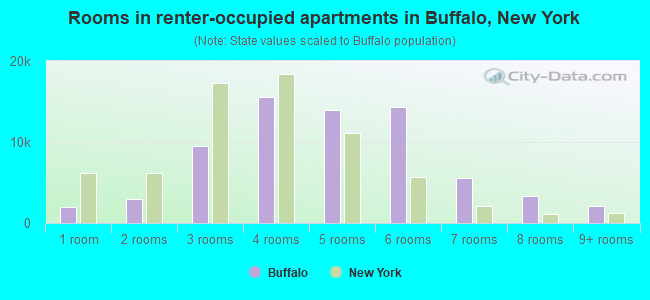
- Rooms in renter-occupied apartments in Buffalo, New York
- 1,9941 room
- 2,9562 rooms
- 9,5163 rooms
- 15,5384 rooms
- 13,9035 rooms
- 14,3276 rooms
- 5,5527 rooms
- 3,3478 rooms
- 2,0559+ rooms

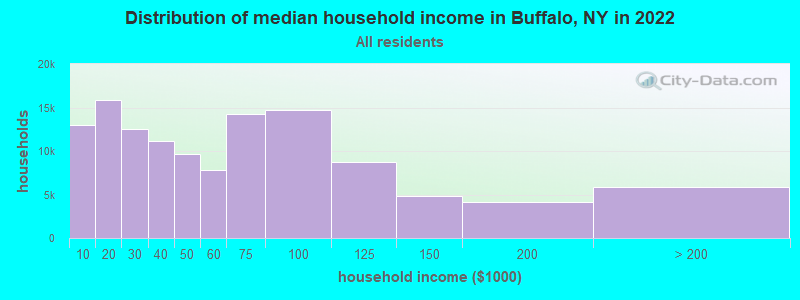
Buffalo, NY household income distribution

- 13,019Less than $10,000
- 15,851$10,000 to $19,999
- 12,483$20,000 to $29,999
- 11,129$30,000 to $39,999
- 9,693$40,000 to $49,999
- 7,868$50,000 to $59,999
- 14,289$60,000 to $74,999
- 14,721$75,000 to $99,999
- 8,716$100,000 to $124,999
- 4,778$125,000 to $149,999
- 4,195$150,000 to $199,999
- 5,836$200,000 or more
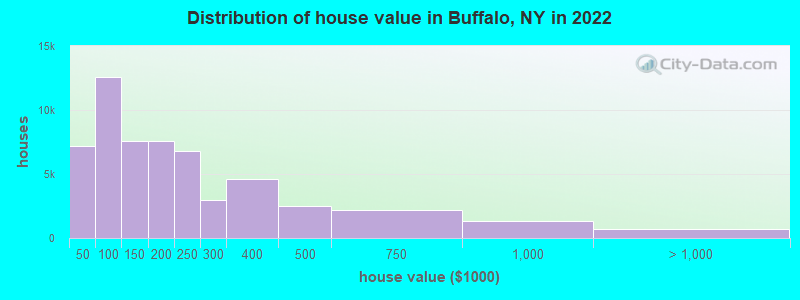
Home value of owner - occupied houses in 2022 in Buffalo, NY
-
- 953Less than $10,000
- 665$10,000 to $14,999
- 263$15,000 to $19,999
- 477$20,000 to $24,999
- 228$25,000 to $29,999
- 1,276$30,000 to $34,999
- 755$35,000 to $39,999
- 2,569$40,000 to $49,999
- 1,436$50,000 to $59,999
- 2,558$60,000 to $69,999
- 3,003$70,000 to $79,999
- 1,749$80,000 to $89,999
- 1,272$90,000 to $99,999
- 4,889$100,000 to $124,999
- 2,677$125,000 to $149,999
- 4,498$150,000 to $174,999
- 3,086$175,000 to $199,999
- 6,805$200,000 to $249,999
- 2,951$250,000 to $299,999
- 4,643$300,000 to $399,999
- 2,461$400,000 to $499,999
- 2,186$500,000 to $749,999
- 1,291$750,000 to $999,999
- 136$1,000,000 to $1,499,999
- 258$1,500,000 to $1,999,999
- 305$2,000,000 or more
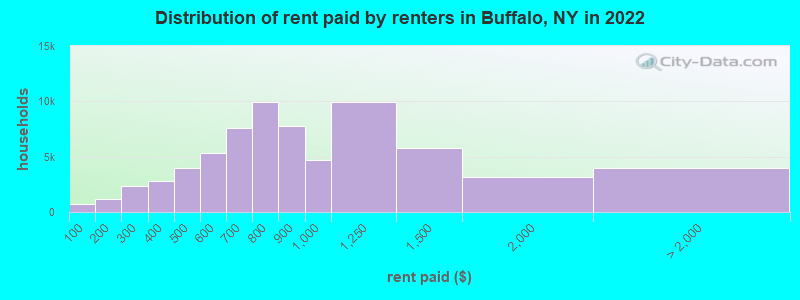
Rent paid by renters in 2022 in Buffalo, NY
-
- 742Less than $100
- 427$100 to $149
- 789$150 to $199
- 468$200 to $249
- 1,924$250 to $299
- 1,342$300 to $349
- 1,449$350 to $399
- 2,161$400 to $449
- 1,846$450 to $499
- 3,537$500 to $549
- 1,780$550 to $599
- 4,070$600 to $649
- 3,526$650 to $699
- 4,916$700 to $749
- 4,987$750 to $799
- 7,771$800 to $899
- 4,687$900 to $999
- 9,896$1,000 to $1,249
- 5,758$1,250 to $1,499
- 3,141$1,500 to $1,999
- 1,098$2,000 to $2,499
- 571$2,500 to $2,999
- 114$3,000 to $3,499
- 232$3,500 or more
- 1,956No cash rent
Percentage of workers working in this county: 95.9%
Number of people working at home: 16,938 (13.0% of all workers)
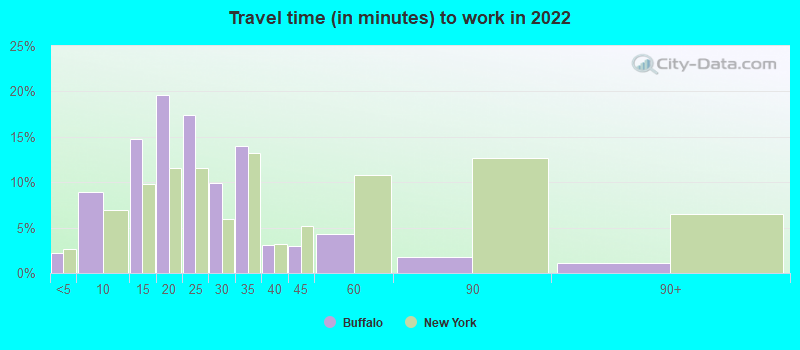
Travel time to work (commute)
- Less than 5 minutes: 3,403
- 5 to 9 minutes: 13,337
- 10 to 14 minutes: 20,491
- 15 to 19 minutes: 24,780
- 20 to 24 minutes: 16,109
- 25 to 29 minutes: 7,639
- 30 to 34 minutes: 13,188
- 35 to 39 minutes: 1,414
- 40 to 44 minutes: 2,186
- 45 to 59 minutes: 4,950
- 60 to 89 minutes: 4,084
- 90 or more minutes: 1,368
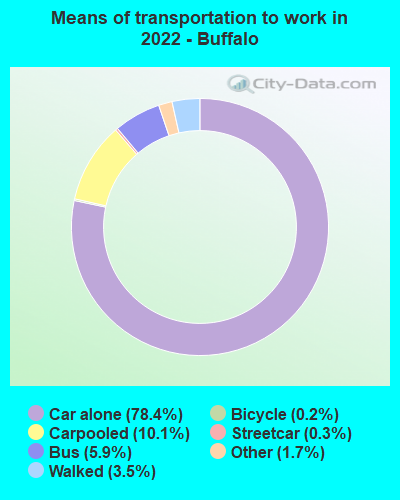
Means of transportation to work:
- Drove a car alone: 112,460 (70.1%)
- Carpooled: 14,435 (9.0%)
- Bus: 8,388 (5.2%)
- Subway or elevated rail: 362 (0.2%)
- Taxi: 2,443 (1.5%)
- Bicycle: 315 (0.2%)
- Walked: 4,973 (3.1%)
- Worked at home: 16,938 (10.6%)
- Unemployment by race in 2022
- Unemployment rate for White non-Hispanic residents
- 4.1%Males
- 1.4%Females
- Unemployment rate for Black residents
- 9.4%Males
- 4.5%Females
- Unemployment rate for American Indian and Alaska Native residents
- 8.6%Males
- Unemployment rate for Asian residents
- 3.2%Males
- 5.4%Females
- Unemployment rate for other race residents
- 11.5%Males
- 6.1%Females
- Unemployment rate for two or more race residents
- 6.1%Males
- 3.0%Females
- Unemployment rate for Hispanic or Latino residents
- 8.1%Males
- 7.3%Females
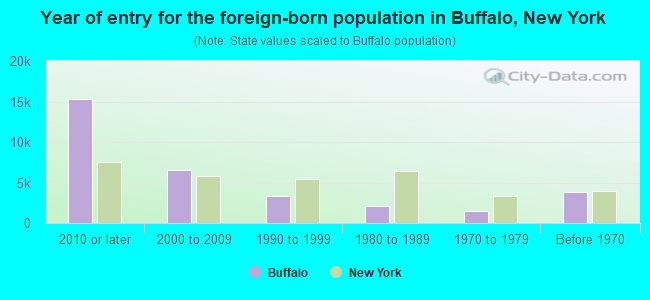
- Year of entry for the foreign-born population in Buffalo, New York
- 15,3352010 or later
- 6,5352000 to 2009
- 3,3601990 to 1999
- 2,0471980 to 1989
- 1,4571970 to 1979
- 3,787Before 1970
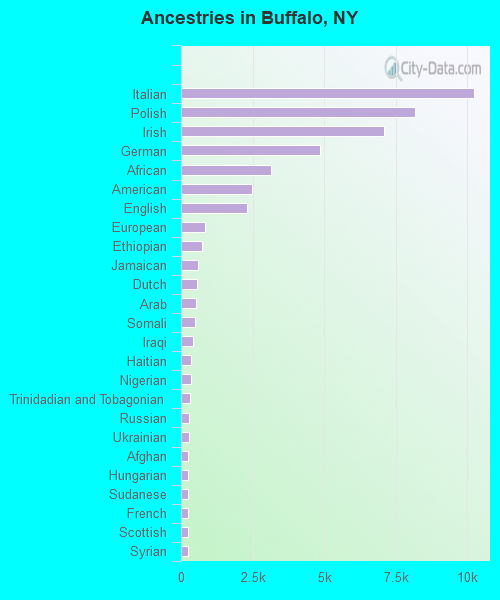
First ancestries reported:
- Italian: 10,253 (7.0%)
- Polish: 8,181 (5.6%)
- Irish: 7,106 (4.9%)
- German: 4,862 (3.3%)
- African: 3,152 (2.2%)
- American: 2,466 (1.7%)
- English: 2,307 (1.6%)
- European: 846 (0.6%)
- Ethiopian: 727 (0.5%)
- Jamaican: 587 (0.4%)
- Dutch: 564 (0.4%)
- Arab: 521 (0.4%)
- Somali: 477 (0.3%)
- Iraqi: 423 (0.3%)
- Haitian: 367 (0.3%)
- Nigerian: 342 (0.2%)
- Trinidadian and Tobagonian: 310 (0.2%)
- Russian: 289 (0.2%)
- Ukrainian: 277 (0.2%)
- Afghan: 251 (0.2%)
- Hungarian: 250 (0.2%)
- Sudanese: 246 (0.2%)
- French: 243 (0.2%)
- Scottish: 235 (0.2%)
- Syrian: 233 (0.2%)
- Eastern European: 222 (0.2%)
- Scotch-Irish: 194 (0.1%)
- Swedish: 188 (0.1%)
- Turkish: 178 (0.1%)
- Norwegian: 165 (0.1%)
- Portuguese: 164 (0.1%)
- British: 161 (0.1%)
- Liberian: 152 (0.1%)
- French Canadian: 152 (0.1%)
- Lebanese: 143 (0.10%)
- Scandinavian: 131 (0.09%)
- Belizean: 131 (0.09%)
- Israeli: 128 (0.09%)
- Swiss: 119 (0.08%)
- Ghanaian: 119 (0.08%)
- Greek: 111 (0.08%)
- Lithuanian: 109 (0.07%)
- Canadian: 100 (0.07%)
- Croatian: 100 (0.07%)
- Welsh: 94 (0.06%)
- West Indian: 87 (0.06%)
- Egyptian: 80 (0.05%)
- Palestinian: 80 (0.05%)
- Northern European: 78 (0.05%)
- Yugoslavian: 78 (0.05%)
- Guyanese: 75 (0.05%)
- Dutch West Indian: 68 (0.05%)
- Latvian: 60 (0.04%)
- British West Indian: 60 (0.04%)
- Romanian: 54 (0.04%)
- German Russian: 49 (0.03%)
- Danish: 44 (0.03%)
- Serbian: 40 (0.03%)
- Celtic: 40 (0.03%)
- Albanian: 39 (0.03%)
- Austrian: 33 (0.02%)
- Moroccan: 32 (0.02%)
- Slovak: 31 (0.02%)
- Czech: 24 (0.02%)
- Iranian: 20 (0.01%)
- Finnish: 20 (0.01%)
- Czechoslovakian: 19 (0.01%)
- Slovene: 18 (0.01%)
- Slavic: 18 (0.01%)
- Jordanian: 18 (0.01%)
- Brazilian: 15 (0.01%)
- Bahamian: 11 (0.01%)
- U.S. Virgin Islander: 11 (0.01%)
- Bulgarian: 9 (0.01%)
- Belgian: 9 (0.01%)
- Australian: 8 (0.01%)
- Barbadian: 8 (0.01%)
Most common places of birth for foreign-born residents (%):
| Buffalo: | 16.8% (4,947) |
| New York: | 2.6% (117,288) |
| Buffalo: | 8.3% (2,438) |
| New York: | 0.4% (16,179) |
| Buffalo: | 4.8% (1,421) |
| New York: | 3.5% (158,432) |
| Buffalo: | 4.4% (1,293) |
| New York: | 0.3% (14,037) |
| Buffalo: | 3.9% (1,138) |
| New York: | 0.1% (2,563) |
| Buffalo: | 3.1% (903) |
| New York: | 11.1% (501,040) |
| Buffalo: | 2.7% (799) |
| New York: | 1.3% (59,107) |
| Buffalo: | 2.5% (745) |
| New York: | 1.4% (62,442) |
| Buffalo: | 2.5% (741) |
| New York: | 5.0% (227,557) |
| Buffalo: | 2.5% (725) |
| New York: | 0.1% (5,468) |
| Buffalo: | 2.4% (720) |
| New York: | 0.0% (1,517) |
| Buffalo: | 2.3% (676) |
| New York: | 0.1% (3,340) |
| Buffalo: | 2.0% (600) |
| New York: | 9.1% (410,910) |
| Buffalo: | 1.9% (552) |
| New York: | 0.4% (17,363) |
| Buffalo: | 1.8% (522) |
| New York: | 4.8% (214,559) |
| Buffalo: | 1.7% (503) |
| New York: | 0.1% (3,762) |
| Buffalo: | 1.7% (490) |
| New York: | 0.3% (14,772) |
| Buffalo: | 1.6% (466) |
| New York: | 0.1% (3,701) |
Place of birth for U.S.-born residents:
- This state: 207,680
- Other state: 30,253
- Northeast: 5,940
- Midwest: 5,021
- South: 15,826
- West: 3,466
87.8% of Buffalo residents lived in the same house 1 years ago.
Out of people who lived in different houses, 39.0% lived in this county.
Out of people who lived in different counties, 61.9% lived in New York.
| Buffalo: | 87.8% |
| State average: | 89.6% |
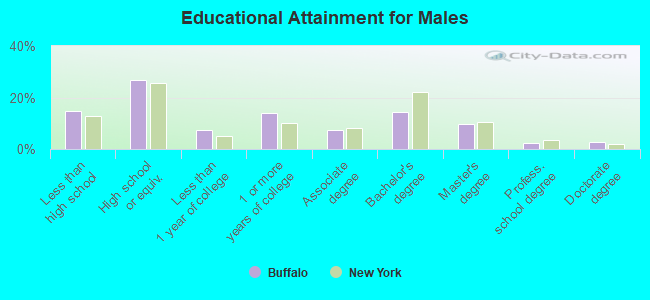
Education attainment for males 25 years and older:
- No schooling: 2,572
- Nursery to 4th grade: 622
- 5th and 6th grade: 356
- 7th and 8th grade: 966
- 9th grade: 803
- 10th grade: 1,229
- 11th grade: 2,476
- 12th grade, no diploma: 4,075
- High school graduate (or equivalency): 23,591
- Less than 1 year of college: 6,541
- Some college more than 1 year, no degree: 12,180
- Associate degree: 6,592
- Bachelor's degree: 12,715
- Master's degree: 8,653
- Professional school degree: 1,966
- Doctorate degree: 2,449
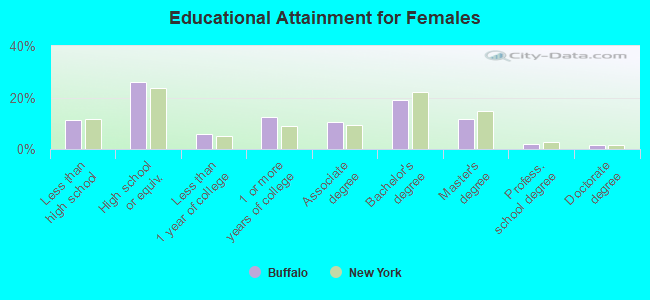
Education attainment for females 25 years and older:
- No schooling: 2,945
- Nursery to 4th grade: 282
- 5th and 6th grade: 295
- 7th and 8th grade: 1,840
- 9th grade: 306
- 10th grade: 1,838
- 11th grade: 1,879
- 12th grade, no diploma: 1,621
- High school graduate (or equivalency): 25,494
- Less than 1 year of college: 5,621
- Some college more than 1 year, no degree: 12,265
- Associate degree: 10,212
- Bachelor's degree: 18,739
- Master's degree: 11,565
- Professional school degree: 1,797
- Doctorate degree: 1,488
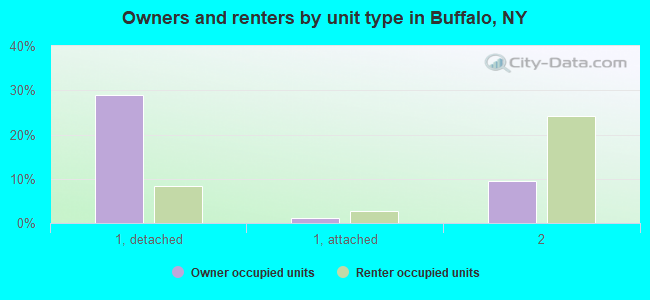
Housing units in structures:
- One, detached: 52,481
- One, attached: 5,241
- Two: 47,538
- 3 or 4: 9,749
- 5 to 9: 6,098
- 10 to 19: 3,000
- 20 to 49: 5,907
- 50 or more: 8,906
- Mobile homes: 169
- Boats, RVs, vans, etc.: 67
Housing units lacking complete kitchen facilities in 2022: 5.1%
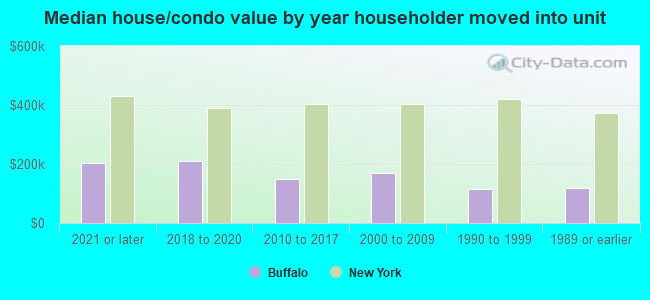
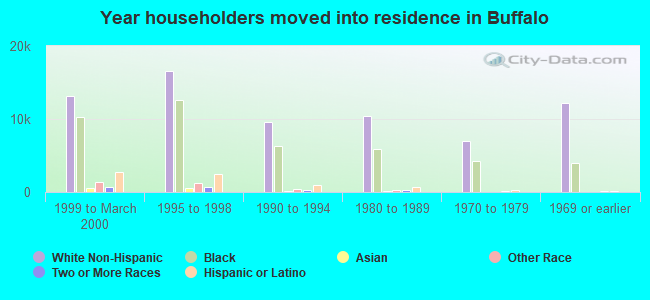
House/condo owner moved in on average 14 years ago
Renter moved in on average 3 years ago
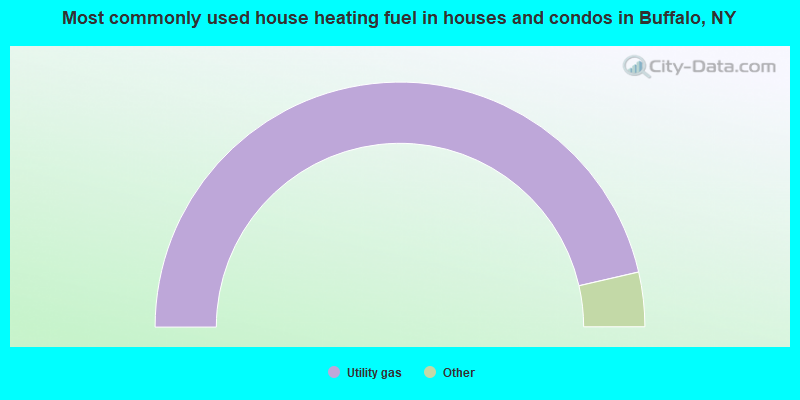
- 92.8%Utility gas
- 3.5%Electricity
- 2.1%Bottled, tank, or LP gas
- 1.0%Fuel oil, kerosene, etc.
- 0.3%Other fuel
- 0.2%Wood
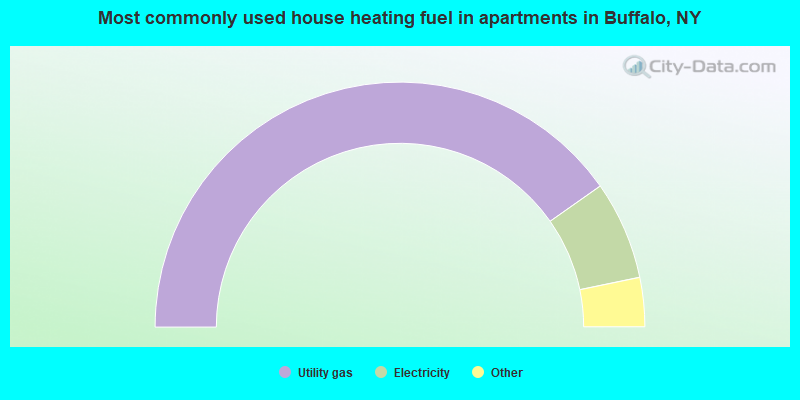
- 80.4%Utility gas
- 13.0%Electricity
- 2.8%Bottled, tank, or LP gas
- 2.6%Other fuel
- 0.8%No fuel used
- 0.2%Solar energy
- 0.2%Fuel oil, kerosene, etc.
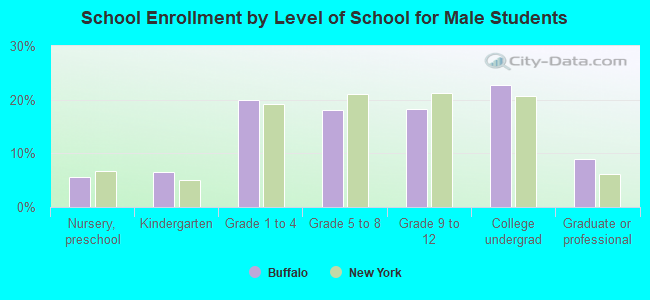
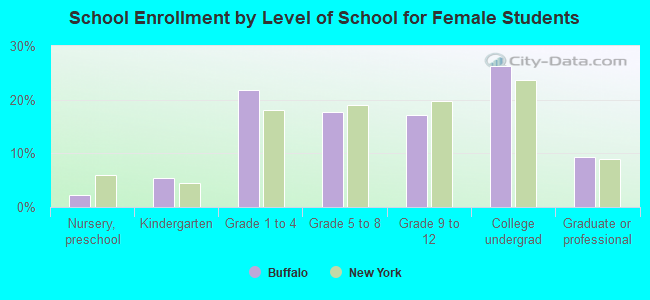
Private vs. public school enrollment:
| Here: | 12.3% |
| New York: | 15.6% |
| Here: | 10.5% |
| New York: | 15.0% |
| Here: | 32.4% |
| New York: | 39.2% |