Burning Springs, KY (Kentucky) Houses and Residents
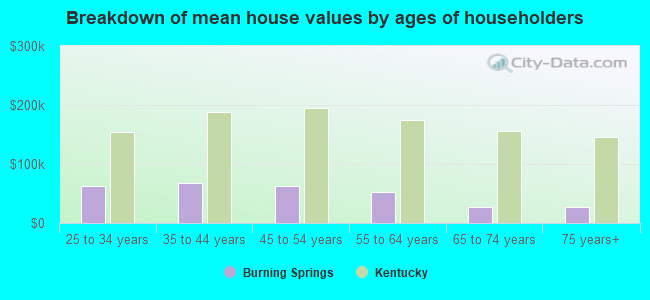
| Burning Springs: | $95,927 |
| Kentucky: | $196,300 |
Total population: 5,861 (Urban population: 22 (all inside urban clusters), Rural population: 6,042 (359 farm, 5,683 nonfarm))
Houses: 2,440 (2,222 occupied: 1,801 owner occupied, 421 renter occupied)
| % of renters here: | 19% |
| State: | 31% |
Housing density: 20 houses/condos per square mile
Median price asked for vacant for-sale houses and condos in 2022 in this county: $357,794.
Median contract rent in 2022: $519 (lower quartile is $411, upper quartile is $596)
Median rent asked for vacant for-rent units in 2022: $614
Median gross rent in Burning Springs, KY in 2022: $694
Housing units in Burning Springs with a mortgage: 501 (25 second mortgage, 25 home equity loan, 0 both second mortgage and home equity loan)
Houses without a mortgage: 395


Household type by relationship:
Households: 19,490- In family households: 17,013 (3,608 male householders, 1,938 female householders)
3,944 spouses, 5,656 children (5,202 natural, 142 adopted, 312 stepchildren), 713 grandchildren, 192 brothers or sisters, 139 parents, foster children, 227 other relatives, 450 non-relatives
- In nonfamily households: 2,477 (1,051 male householders (905 living alone)), 1,135 female householders (1,048 living alone)), 291 nonrelatives
- In group quarters: 2,240 (2,020 institutionalized population)
4,121 married couples with children.
1,259 single-parent households (283 men, 976 women).
99.5% of residents of Burning Springs speak English at home.
0.3% of residents speak Spanish at home (100% speak English very well).
0.2% of residents speak other Indo-European language at home (100% speak English very well).
| Here: | 6.4 |
| State: | 6.4 |
| Here: | 5.0 |
| State: | 4.4 |
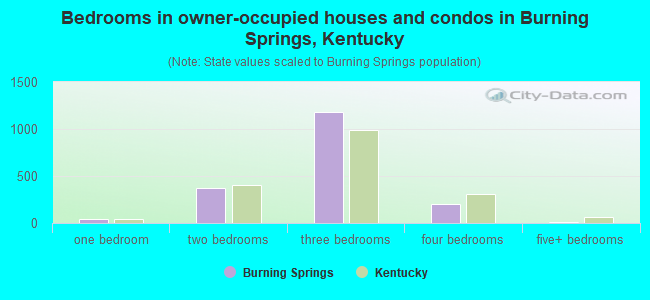
- Bedrooms in owner-occupied houses and condos in Burning Springs, Kentucky
- 0no bedroom
- 401 bedroom
- 3712 bedrooms
- 1,1793 bedrooms
- 2034 bedrooms
- 85+ bedrooms
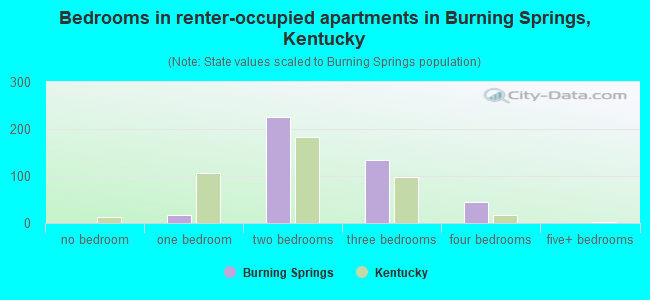
- Bedrooms in renter-occupied apartments in Burning Springs, Kentucky
- 0no bedroom
- 181 bedroom
- 2252 bedrooms
- 1343 bedrooms
- 444 bedrooms
- 05+ bedrooms
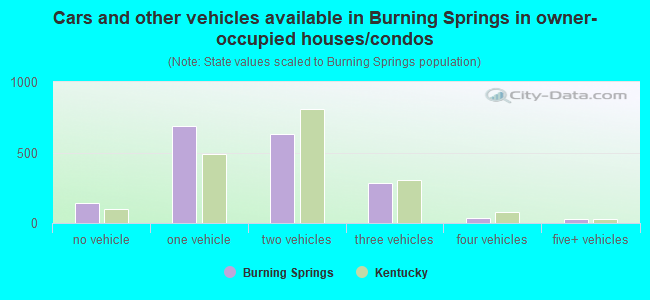
- Cars and other vehicles available in Burning Springs in owner-occupied houses/condos
- 139no vehicle
- 6911 vehicle
- 6282 vehicles
- 2853 vehicles
- 334 vehicles
- 255+ vehicles
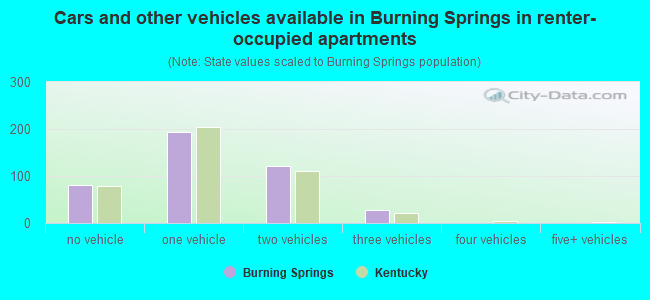
- Cars and other vehicles available in Burning Springs in renter-occupied apartments
- 80no vehicle
- 1931 vehicle
- 1212 vehicles
- 273 vehicles
- 04 vehicles
- 05+ vehicles
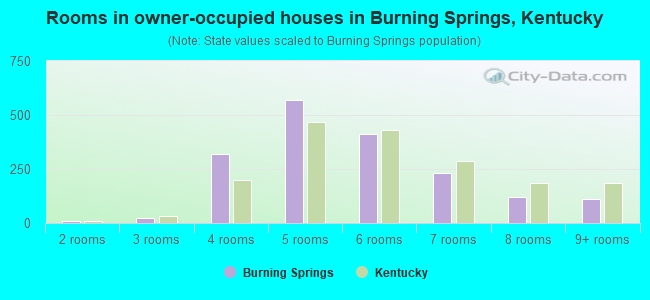
- Rooms in owner-occupied houses in Burning Springs, Kentucky
- 01 room
- 82 rooms
- 253 rooms
- 3204 rooms
- 5715 rooms
- 4126 rooms
- 2337 rooms
- 1228 rooms
- 1109+ rooms
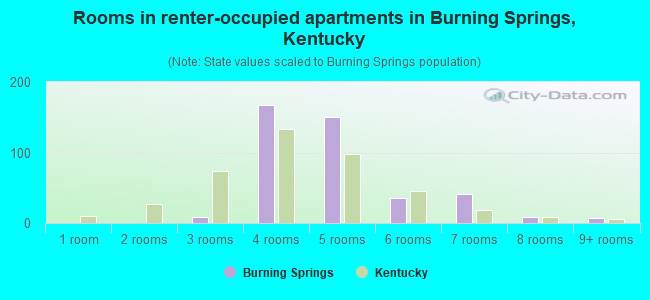
- Rooms in renter-occupied apartments in Burning Springs, Kentucky
- 01 room
- 02 rooms
- 93 rooms
- 1684 rooms
- 1515 rooms
- 366 rooms
- 417 rooms
- 98 rooms
- 79+ rooms
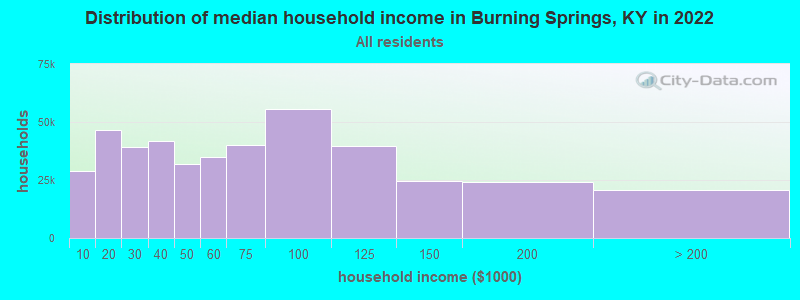
Burning Springs, KY household income distribution

- 28,829Less than $10,000
- 46,714$10,000 to $19,999
- 39,397$20,000 to $29,999
- 41,711$30,000 to $39,999
- 31,941$40,000 to $49,999
- 35,025$50,000 to $59,999
- 40,243$60,000 to $74,999
- 55,708$75,000 to $99,999
- 39,809$100,000 to $124,999
- 24,451$125,000 to $149,999
- 24,251$150,000 to $199,999
- 20,889$200,000 or more
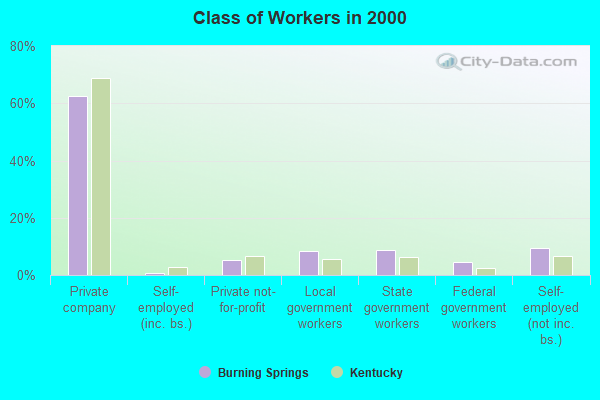
Percentage of workers working in this county: 52.5%
Number of people working at home: 183 (8.6% of all workers)
Travel time to work (commute)
- Less than 5 minutes: 51
- 5 to 9 minutes: 119
- 10 to 14 minutes: 240
- 15 to 19 minutes: 427
- 20 to 24 minutes: 264
- 25 to 29 minutes: 144
- 30 to 34 minutes: 366
- 35 to 39 minutes: 33
- 40 to 44 minutes: 56
- 45 to 59 minutes: 122
- 60 to 89 minutes: 114
- 90 or more minutes: 98
Means of transportation to work:
- Drove a car alone: 1,533 (74.9%)
- Carpooled: 442 (21.6%)
- Bus or trolley bus: 8 (0.4%)
- Walked: 42 (2.1%)
- Other means: 9 (0.4%)
- Worked at home: 14 (0.7%)
Place of birth for U.S.-born residents:
- This state: 5,405
- Other state: 659
- Northeast: 18
- Midwest: 485
- South: 125
- West: 31
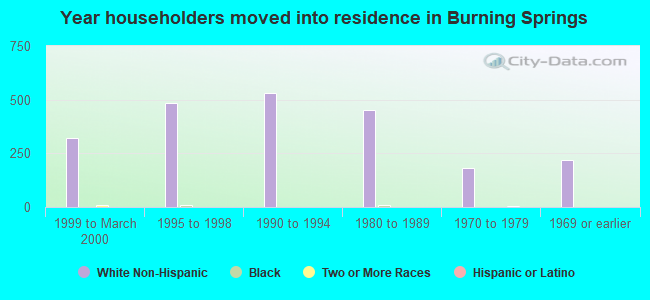
65% of Burning Springs residents lived in the same house 5 years ago.
Out of people who lived in different houses, 70% lived in this county.
Out of people who lived in different counties, 85% lived in Kentucky.
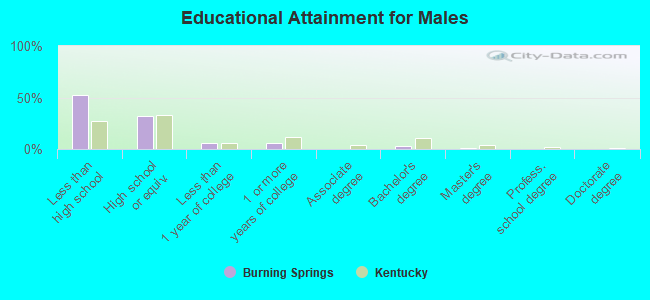
Education attainment for males 25 years and older:
- No schooling: 50
- Nursery to 4th grade: 123
- 5th and 6th grade: 122
- 7th and 8th grade: 400
- 9th grade: 68
- 10th grade: 105
- 11th grade: 82
- 12th grade, no diploma: 48
- High school graduate (or equivalency): 605
- Less than 1 year of college: 102
- Some college more than 1 year, no degree: 106
- Associate degree: 0
- Bachelor's degree: 63
- Master's degree: 16
- Professional school degree: 8
- Doctorate degree: 0
Education attainment for females 25 years and older:
- No schooling: 79
- Nursery to 4th grade: 54
- 5th and 6th grade: 138
- 7th and 8th grade: 393
- 9th grade: 106
- 10th grade: 105
- 11th grade: 42
- 12th grade, no diploma: 44
- High school graduate (or equivalency): 640
- Less than 1 year of college: 64
- Some college more than 1 year, no degree: 159
- Associate degree: 27
- Bachelor's degree: 50
- Master's degree: 105
- Professional school degree: 22
- Doctorate degree: 0

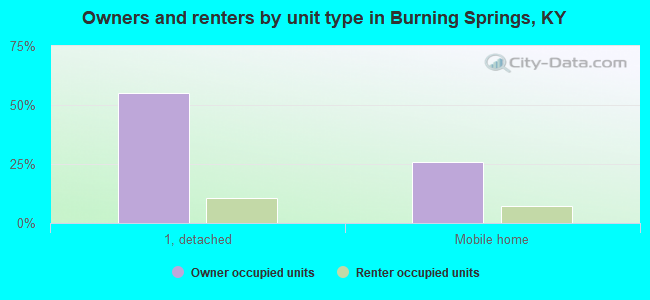
Housing units in structures:
- One, detached: 1,578
- One, attached: 8
- Two: 12
- 3 or 4: 22
- Mobile homes: 814
- Boats, RVs, vans, etc.: 6
Median worth of mobile homes: $43,889
Housing units lacking complete kitchen facilities: 2.1%
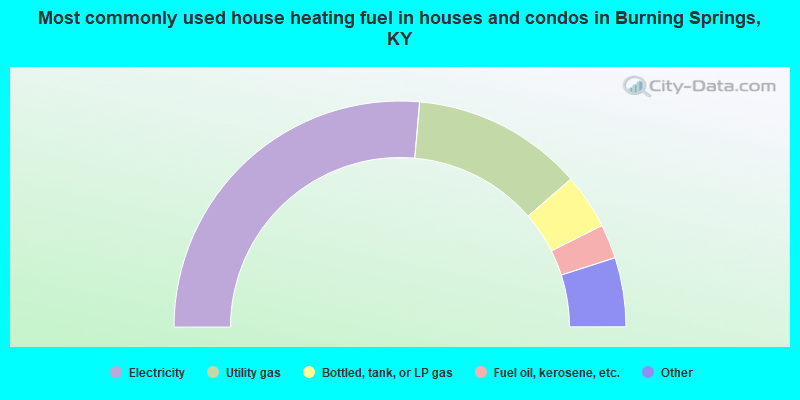
- 52.8%Electricity
- 24.5%Utility gas
- 7.9%Bottled, tank, or LP gas
- 4.9%Fuel oil, kerosene, etc.
- 3.7%Coal or coke
- 3.5%Other fuel
- 2.7%Wood
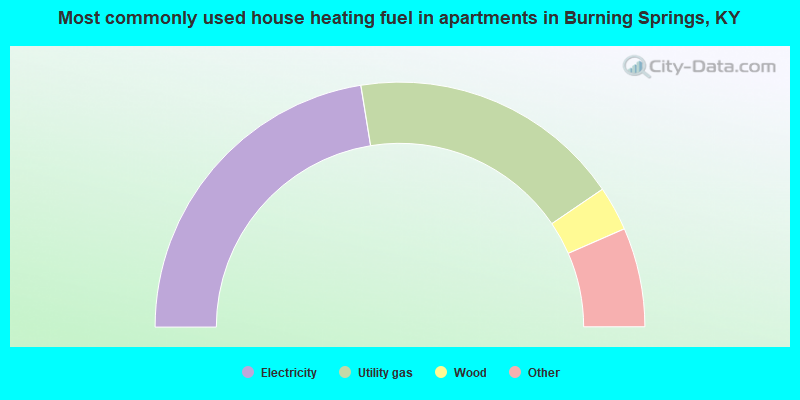
- 44.9%Electricity
- 36.1%Utility gas
- 5.9%Wood
- 3.8%Bottled, tank, or LP gas
- 3.8%Fuel oil, kerosene, etc.
- 3.6%Coal or coke
- 1.9%Other fuel
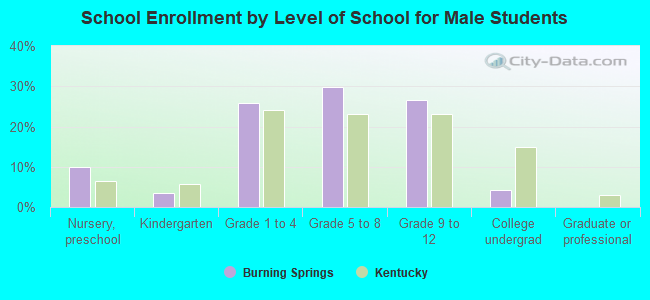
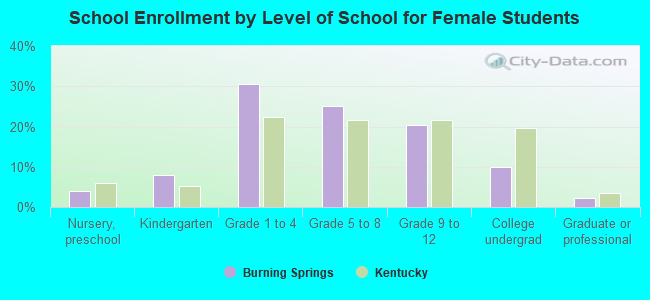
Private vs. public school enrollment:
| Here: | 0.8% |
| Kentucky: | 11.9% |
| Here: | 0.0% |
| Kentucky: | 10.6% |
| Here: | 18.9% |
| Kentucky: | 18.1% |