Cavanaugh, WA (Washington) Houses and Residents
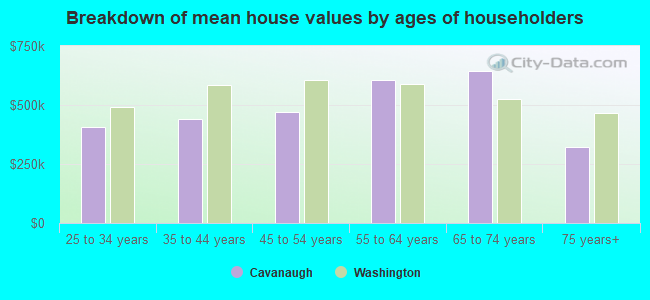
| Cavanaugh: | $769,597 |
| Washington: | $569,500 |
Total population: 2,303 (Urban population: 692, Rural population: 1,449 (94 farm, 1,355 nonfarm))
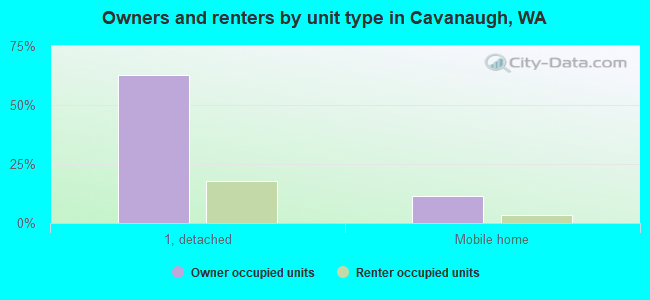
Houses: 1,299 (801 occupied: 621 owner occupied, 180 renter occupied)
| % of renters here: | 22% |
| State: | 36% |
Housing density: 4 houses/condos per square mile
Median price asked for vacant for-sale houses and condos in 2022 in this county: $430,980.
Median contract rent in 2022: $1,398 (lower quartile is $1,127, upper quartile is over $2,000)
Median rent asked for vacant for-rent units in 2022: $1,365
Median gross rent in Cavanaugh, WA in 2022: $1,885
Housing units in Cavanaugh with a mortgage: 279 (25 second mortgage, 39 home equity loan, 0 both second mortgage and home equity loan)
Houses without a mortgage: 115


Household type by relationship:
Households: 115,277- In family households: 96,098 (22,309 male householders, 8,347 female householders)
23,747 spouses, 31,478 children (28,838 natural, 950 adopted, 1,690 stepchildren), 2,114 grandchildren, 1,110 brothers or sisters, 871 parents, foster children, 1,654 other relatives, 3,690 non-relatives
- In nonfamily households: 19,179 (7,200 male householders (5,248 living alone)), 7,701 female householders (6,396 living alone)), 4,278 nonrelatives
- In group quarters: 1,624 (650 institutionalized population)
18,368 married couples with children.
5,970 single-parent households (1,535 men, 4,435 women).
95.8% of residents of Cavanaugh speak English at home.
2.9% of residents speak Spanish at home (34% speak English very well, 33% speak English well, 33% speak English not well).
1.3% of residents speak other Indo-European language at home (73% speak English very well, 27% speak English well).
Foreign born population: 132 (4.8%)
(42.4% of them are naturalized citizens)
| Here: | 6.2 |
| State: | 6.5 |
| Here: | 4.0 |
| State: | 3.9 |
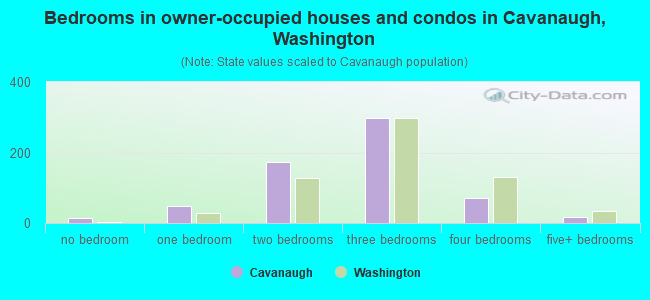
- Bedrooms in owner-occupied houses and condos in Cavanaugh, Washington
- 14no bedroom
- 481 bedroom
- 1732 bedrooms
- 2983 bedrooms
- 704 bedrooms
- 185+ bedrooms
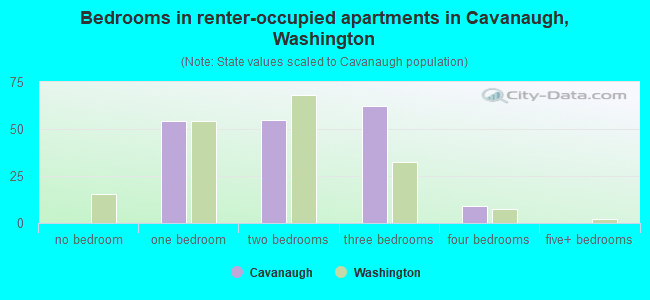
- Bedrooms in renter-occupied apartments in Cavanaugh, Washington
- 0no bedroom
- 541 bedroom
- 552 bedrooms
- 623 bedrooms
- 94 bedrooms
- 05+ bedrooms
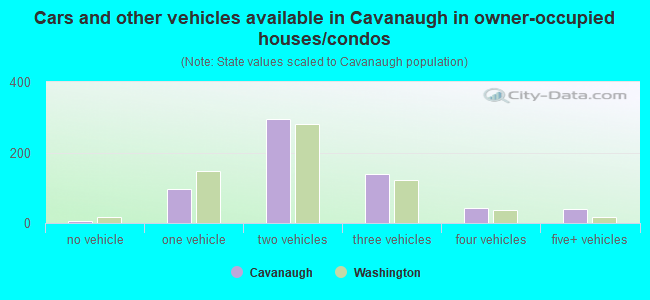
- Cars and other vehicles available in Cavanaugh in owner-occupied houses/condos
- 7no vehicle
- 961 vehicle
- 2952 vehicles
- 1393 vehicles
- 434 vehicles
- 415+ vehicles
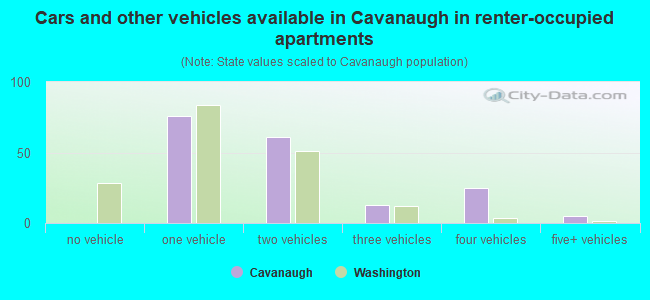
- Cars and other vehicles available in Cavanaugh in renter-occupied apartments
- 0no vehicle
- 761 vehicle
- 612 vehicles
- 133 vehicles
- 254 vehicles
- 55+ vehicles
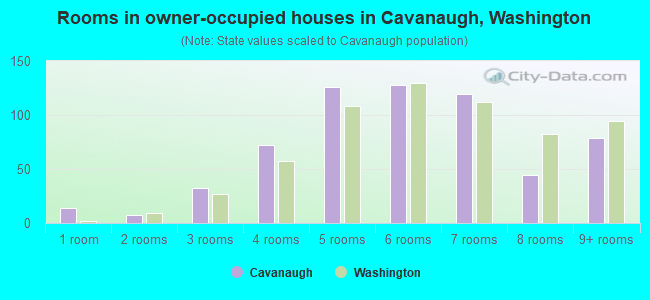
- Rooms in owner-occupied houses in Cavanaugh, Washington
- 141 room
- 72 rooms
- 323 rooms
- 724 rooms
- 1265 rooms
- 1286 rooms
- 1197 rooms
- 448 rooms
- 799+ rooms
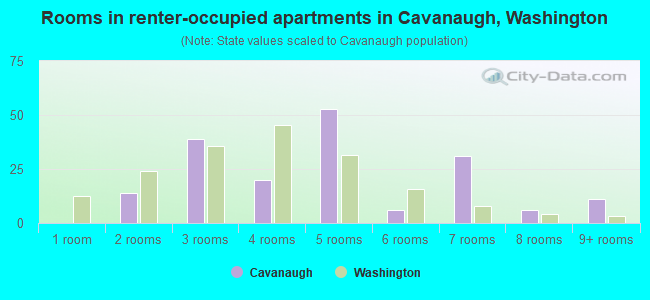
- Rooms in renter-occupied apartments in Cavanaugh, Washington
- 01 room
- 142 rooms
- 393 rooms
- 204 rooms
- 535 rooms
- 66 rooms
- 317 rooms
- 68 rooms
- 119+ rooms
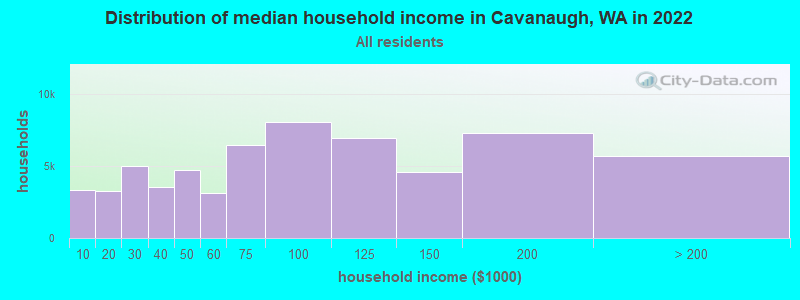
Cavanaugh, WA household income distribution

- 3,361Less than $10,000
- 3,228$10,000 to $19,999
- 4,959$20,000 to $29,999
- 3,506$30,000 to $39,999
- 4,695$40,000 to $49,999
- 3,092$50,000 to $59,999
- 6,480$60,000 to $74,999
- 8,042$75,000 to $99,999
- 6,936$100,000 to $124,999
- 4,560$125,000 to $149,999
- 7,293$150,000 to $199,999
- 5,709$200,000 or more
Percentage of workers working in this county: 80.6%
Number of people working at home: 234 (17.4% of all workers)
Travel time to work (commute)
- Less than 5 minutes: 49
- 5 to 9 minutes: 45
- 10 to 14 minutes: 200
- 15 to 19 minutes: 190
- 20 to 24 minutes: 141
- 25 to 29 minutes: 48
- 30 to 34 minutes: 82
- 35 to 39 minutes: 34
- 40 to 44 minutes: 30
- 45 to 59 minutes: 69
- 60 to 89 minutes: 79
- 90 or more minutes: 29
Means of transportation to work:
- Drove a car alone: 895 (84.2%)
- Carpooled: 83 (7.8%)
- Walked: 18 (1.7%)
- Worked at home: 67 (6.3%)
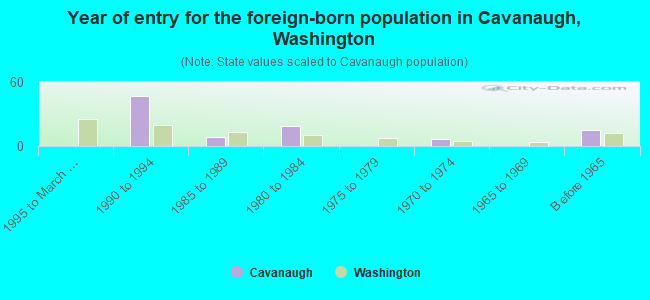
- Year of entry for the foreign-born population in Cavanaugh, Washington
- 01995 to March 2000
- 471990 to 1994
- 81985 to 1989
- 191980 to 1984
- 01975 to 1979
- 71970 to 1974
- 01965 to 1969
- 15Before 1965
Most common places of birth for foreign-born residents (%):
| Cavanaugh: | 71.9% (69) |
| Washington: | 24.1% (148,115) |
| Cavanaugh: | 8.3% (8) |
| Washington: | 3.4% (21,167) |
| Cavanaugh: | 7.3% (7) |
| Washington: | 3.3% (20,321) |
| Cavanaugh: | 7.3% (7) |
| Washington: | 0.1% (455) |
| Cavanaugh: | 5.2% (5) |
| Washington: | 0.2% (1,136) |
Place of birth for U.S.-born residents:
- This state: 1,234
- Other state: 800
- Northeast: 99
- Midwest: 217
- South: 125
- West: 359
55% of Cavanaugh residents lived in the same house 5 years ago.
Out of people who lived in different houses, 33% lived in this county.
Out of people who lived in different counties, 61% lived in Washington.
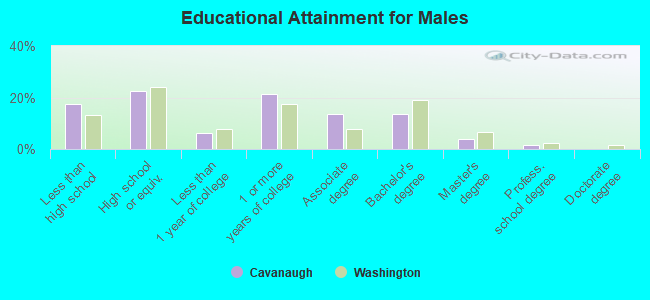
Education attainment for males 25 years and older:
- No schooling: 19
- Nursery to 4th grade: 0
- 5th and 6th grade: 5
- 7th and 8th grade: 56
- 9th grade: 6
- 10th grade: 5
- 11th grade: 11
- 12th grade, no diploma: 28
- High school graduate (or equivalency): 167
- Less than 1 year of college: 47
- Some college more than 1 year, no degree: 159
- Associate degree: 100
- Bachelor's degree: 101
- Master's degree: 28
- Professional school degree: 11
- Doctorate degree: 0
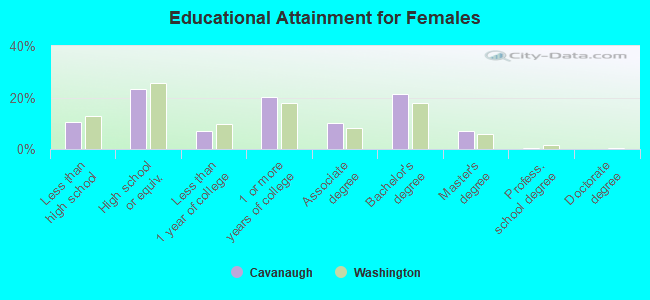
Education attainment for females 25 years and older:
- No schooling: 12
- Nursery to 4th grade: 0
- 5th and 6th grade: 0
- 7th and 8th grade: 0
- 9th grade: 0
- 10th grade: 34
- 11th grade: 24
- 12th grade, no diploma: 9
- High school graduate (or equivalency): 179
- Less than 1 year of college: 52
- Some college more than 1 year, no degree: 155
- Associate degree: 78
- Bachelor's degree: 162
- Master's degree: 54
- Professional school degree: 4
- Doctorate degree: 0


Housing units in structures:
- One, detached: 1,100
- One, attached: 31
- 10 to 19: 5
- Mobile homes: 149
- Boats, RVs, vans, etc.: 14
Median worth of mobile homes: $381,605
Housing units lacking complete kitchen facilities: 7.9%
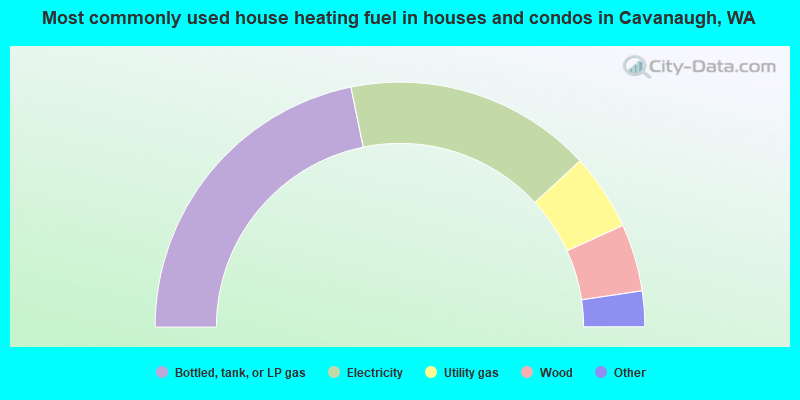
- 43.6%Bottled, tank, or LP gas
- 32.7%Electricity
- 10.1%Utility gas
- 8.9%Wood
- 3.5%Fuel oil, kerosene, etc.
- 1.1%Other fuel
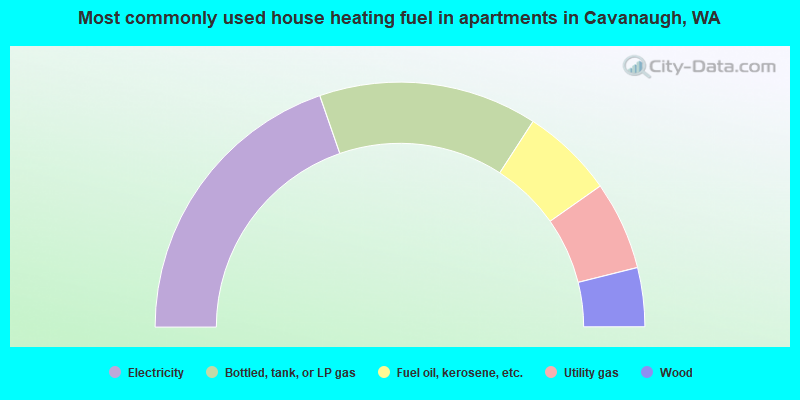
- 39.4%Electricity
- 28.9%Bottled, tank, or LP gas
- 12.2%Fuel oil, kerosene, etc.
- 11.7%Utility gas
- 7.8%Wood
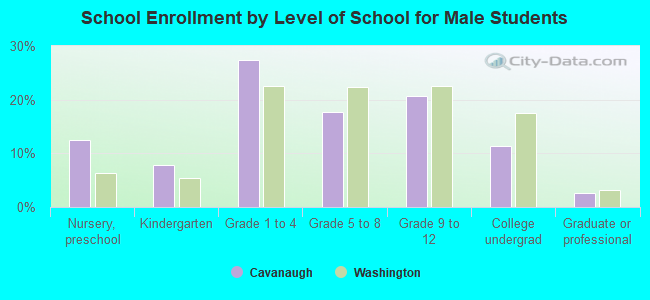
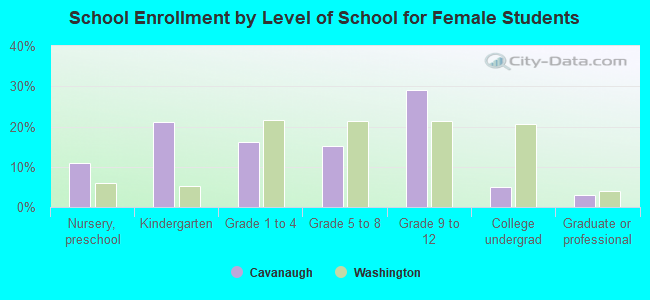
Private vs. public school enrollment:
| Here: | 15.3% |
| Washington: | 9.2% |
| Here: | 18.8% |
| Washington: | 7.0% |
| Here: | 0.0% |
| Washington: | 15.7% |