Central Colusa, CA (California) Houses and Residents
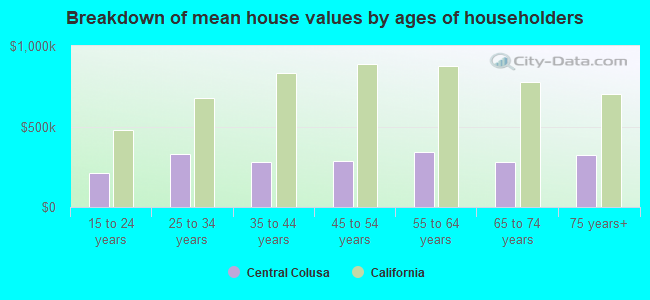
| Central Colusa: | $369,526 |
| California: | $715,900 |
Total population: 10,807 (Urban population: 3,446 (all inside urban clusters), Rural population: 6,219 (677 farm, 5,542 nonfarm))
Houses: 3,164 (2,843 occupied: 1,827 owner occupied, 1,016 renter occupied)
| % of renters here: | 36% |
| State: | 44% |
Housing density: 10 houses/condos per square mile
Median price asked for vacant for-sale houses and condos in 2022 in this county: $270,007.
Median contract rent in 2022: $842 (lower quartile is $694, upper quartile is $1,047)
Median rent asked for vacant for-rent units in 2022: $826
Median gross rent in Central Colusa, CA in 2022: $1,064
Housing units in Central Colusa with a mortgage: 975 (144 second mortgage, 89 home equity loan, 0 both second mortgage and home equity loan)
Houses without a mortgage: 355


Household type by relationship:
Households: 21,194- In family households: 19,053 (3,793 male householders, 1,493 female householders)
4,033 spouses, 7,360 children (6,940 natural, 124 adopted, 296 stepchildren), 484 grandchildren, 333 brothers or sisters, 296 parents, foster children, 476 other relatives, 566 non-relatives
- In nonfamily households: 2,141 (906 male householders (726 living alone)), 864 female householders (749 living alone)), 371 nonrelatives
- In group quarters: 225 (190 institutionalized population)
4,240 married couples with children.
991 single-parent households (315 men, 676 women).
48.0% of residents of Central Colusa speak English at home.
50.2% of residents speak Spanish at home (38% speak English very well, 19% speak English well, 23% speak English not well, 20% don't speak English at all).
1.4% of residents speak other Indo-European language at home (43% speak English very well, 35% speak English well, 14% speak English not well, 7% don't speak English at all).
0.5% of residents speak Asian or Pacific Island language at home (36% speak English very well, 38% speak English well, 26% speak English not well).
Foreign born population: 4,514 (39.4%)
(27.4% of them are naturalized citizens)
| Here: | 6.0 |
| State: | 6.0 |
| Here: | 3.6 |
| State: | 3.9 |
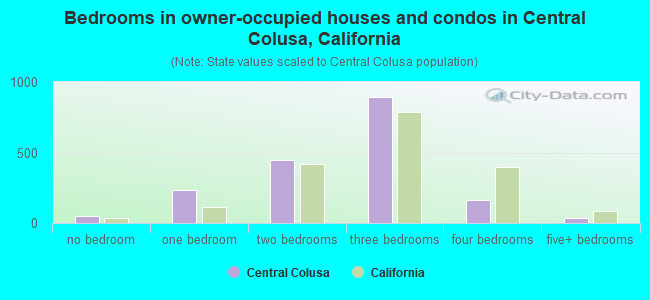
- Bedrooms in owner-occupied houses and condos in Central Colusa, California
- 52no bedroom
- 2371 bedroom
- 4472 bedrooms
- 8943 bedrooms
- 1624 bedrooms
- 355+ bedrooms
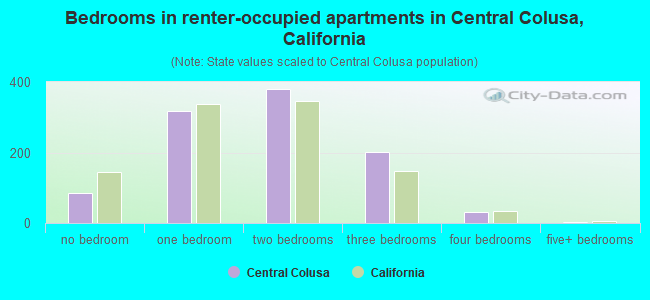
- Bedrooms in renter-occupied apartments in Central Colusa, California
- 85no bedroom
- 3171 bedroom
- 3792 bedrooms
- 2023 bedrooms
- 304 bedrooms
- 35+ bedrooms
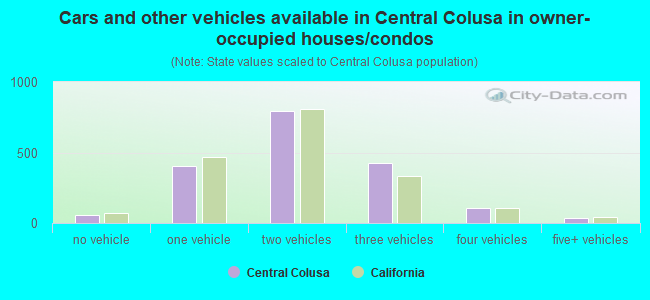
- Cars and other vehicles available in Central Colusa in owner-occupied houses/condos
- 57no vehicle
- 4071 vehicle
- 7922 vehicles
- 4253 vehicles
- 1084 vehicles
- 385+ vehicles
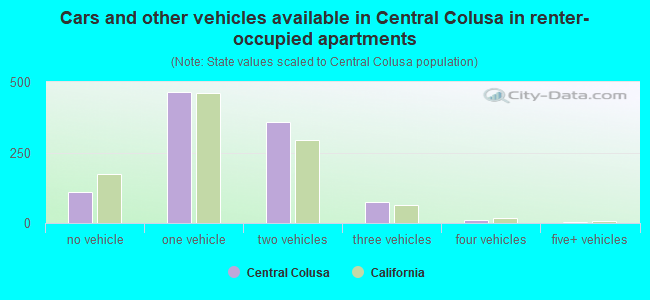
- Cars and other vehicles available in Central Colusa in renter-occupied apartments
- 109no vehicle
- 4631 vehicle
- 3582 vehicles
- 753 vehicles
- 94 vehicles
- 25+ vehicles
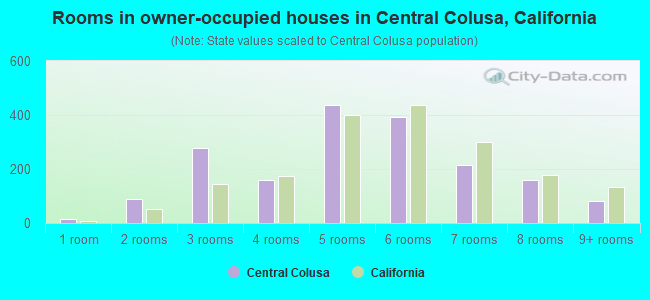
- Rooms in owner-occupied houses in Central Colusa, California
- 151 room
- 892 rooms
- 2793 rooms
- 1604 rooms
- 4385 rooms
- 3916 rooms
- 2157 rooms
- 1598 rooms
- 819+ rooms
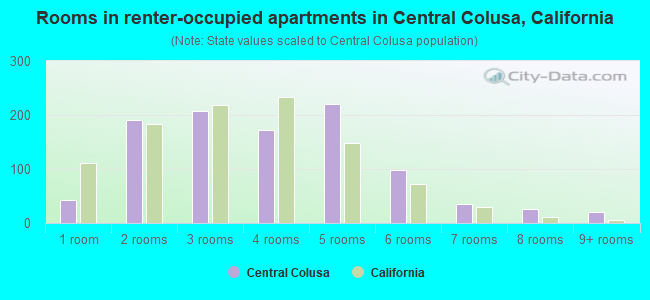
- Rooms in renter-occupied apartments in Central Colusa, California
- 431 room
- 1912 rooms
- 2073 rooms
- 1734 rooms
- 2205 rooms
- 996 rooms
- 367 rooms
- 268 rooms
- 219+ rooms
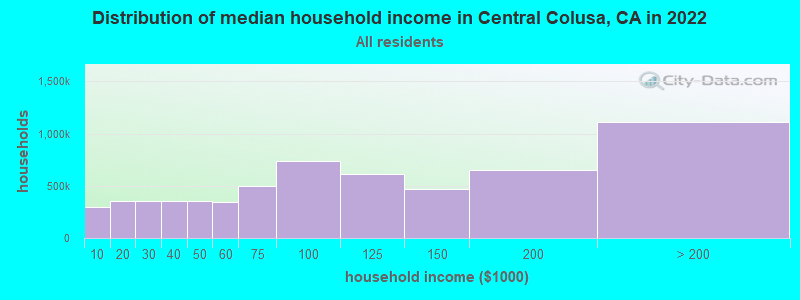
Central Colusa, CA household income distribution

- 161,430Less than $10,000
- 195,459$10,000 to $19,999
- 193,457$20,000 to $29,999
- 193,962$30,000 to $39,999
- 193,836$40,000 to $49,999
- 187,055$50,000 to $59,999
- 272,564$60,000 to $74,999
- 398,099$75,000 to $99,999
- 333,850$100,000 to $124,999
- 252,016$125,000 to $149,999
- 352,808$150,000 to $199,999
- 594,572$200,000 or more
Percentage of workers working in this county: 80.2%
Number of people working at home: 710 (16.5% of all workers)
Travel time to work (commute)
- Less than 5 minutes: 298
- 5 to 9 minutes: 545
- 10 to 14 minutes: 495
- 15 to 19 minutes: 517
- 20 to 24 minutes: 424
- 25 to 29 minutes: 106
- 30 to 34 minutes: 449
- 35 to 39 minutes: 67
- 40 to 44 minutes: 60
- 45 to 59 minutes: 163
- 60 to 89 minutes: 151
- 90 or more minutes: 92
Means of transportation to work:
- Drove a car alone: 2,261 (64.3%)
- Carpooled: 823 (23.4%)
- Bicycle: 13 (0.4%)
- Walked: 184 (5.2%)
- Other means: 86 (2.4%)
- Worked at home: 151 (4.3%)
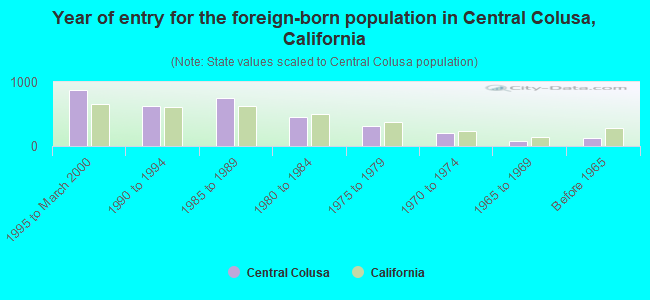
- Year of entry for the foreign-born population in Central Colusa, California
- 8691995 to March 2000
- 6311990 to 1994
- 7531985 to 1989
- 4521980 to 1984
- 3121975 to 1979
- 2071970 to 1974
- 781965 to 1969
- 120Before 1965
Most common places of birth for foreign-born residents (%):
| Central Colusa: | 92.8% (3,175) |
| California: | 44.3% (3,928,701) |
Place of birth for U.S.-born residents:
- This state: 5,059
- Other state: 1,100
- Northeast: 48
- Midwest: 322
- South: 407
- West: 323
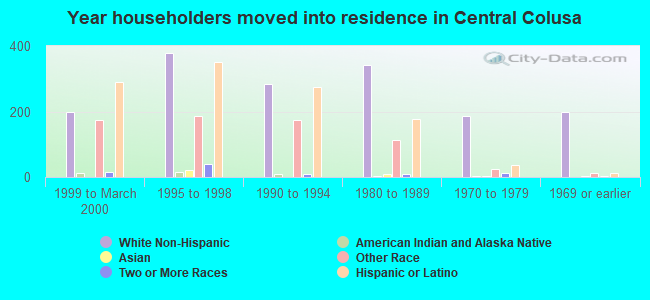
63% of Central Colusa residents lived in the same house 5 years ago.
Out of people who lived in different houses, 64% lived in this county.
Out of people who lived in different counties, 88% lived in California.
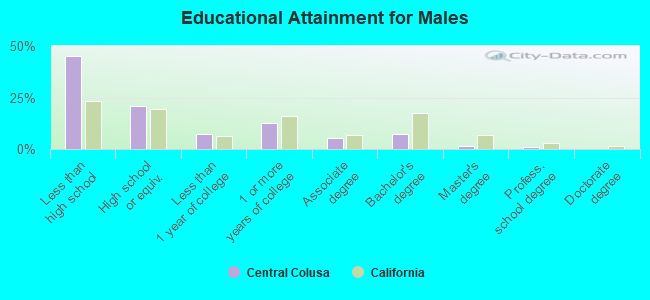
Education attainment for males 25 years and older:
- No schooling: 346
- Nursery to 4th grade: 77
- 5th and 6th grade: 341
- 7th and 8th grade: 136
- 9th grade: 67
- 10th grade: 73
- 11th grade: 95
- 12th grade, no diploma: 100
- High school graduate (or equivalency): 571
- Less than 1 year of college: 193
- Some college more than 1 year, no degree: 344
- Associate degree: 142
- Bachelor's degree: 194
- Master's degree: 34
- Professional school degree: 26
- Doctorate degree: 0
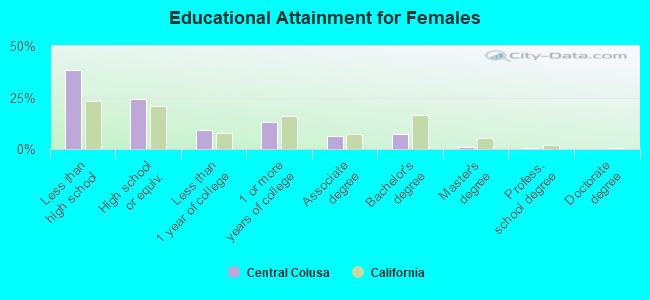
Education attainment for females 25 years and older:
- No schooling: 267
- Nursery to 4th grade: 123
- 5th and 6th grade: 225
- 7th and 8th grade: 117
- 9th grade: 104
- 10th grade: 57
- 11th grade: 67
- 12th grade, no diploma: 82
- High school graduate (or equivalency): 660
- Less than 1 year of college: 248
- Some college more than 1 year, no degree: 353
- Associate degree: 175
- Bachelor's degree: 197
- Master's degree: 27
- Professional school degree: 8
- Doctorate degree: 0
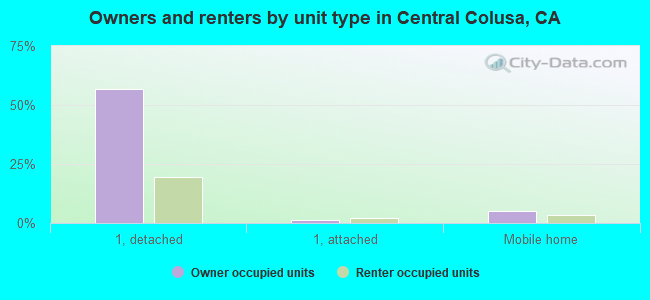
Housing units in structures:
- One, detached: 2,415
- One, attached: 106
- Two: 36
- 3 or 4: 138
- 5 to 9: 72
- 10 to 19: 27
- 20 to 49: 35
- 50 or more: 43
- Mobile homes: 283
- Boats, RVs, vans, etc.: 9
Median worth of mobile homes: $247,413
Housing units lacking complete kitchen facilities: 1.2%
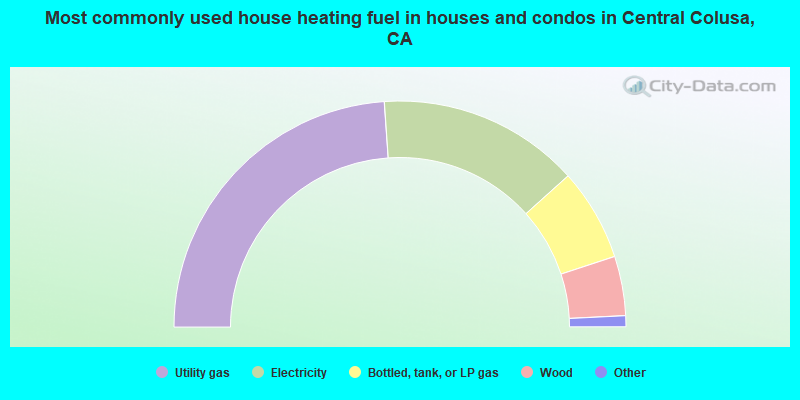
- 47.8%Utility gas
- 28.9%Electricity
- 13.2%Bottled, tank, or LP gas
- 8.5%Wood
- 1.0%Other fuel
- 0.5%Fuel oil, kerosene, etc.
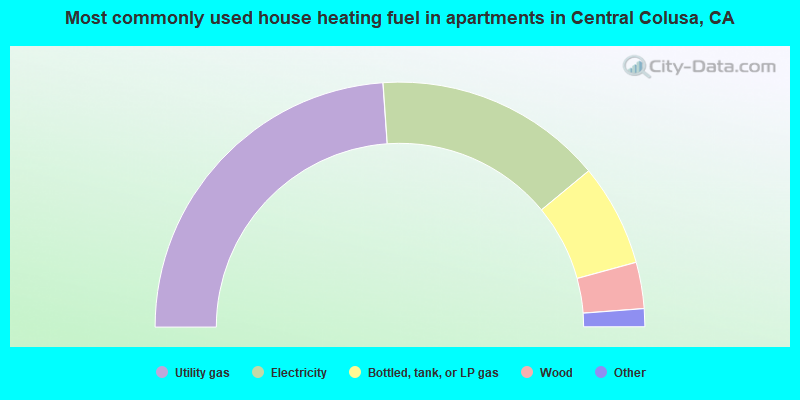
- 47.8%Utility gas
- 30.2%Electricity
- 13.5%Bottled, tank, or LP gas
- 6.1%Wood
- 2.1%Fuel oil, kerosene, etc.
- 0.3%No fuel used
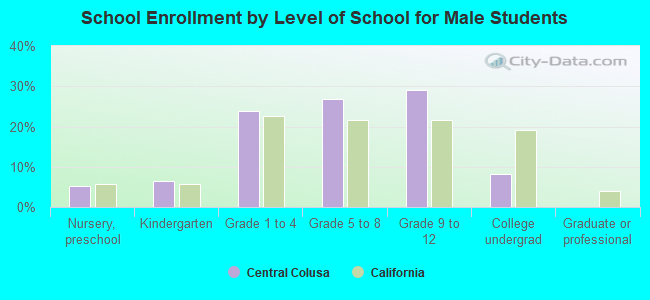
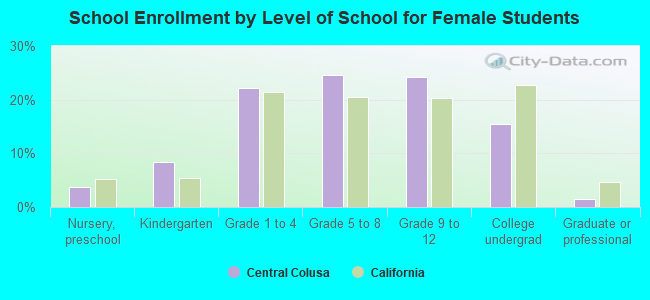
Private vs. public school enrollment:
| Here: | 3.9% |
| California: | 9.9% |
| Here: | 4.4% |
| California: | 7.8% |
| Here: | 9.1% |
| California: | 15.4% |