Chapel Hill, TN (Tennessee) Houses and Residents
| Chapel Hill: | $294,985 |
| Tennessee: | $284,800 |
Total population: 1,461 (Urban population: 0, Rural population: 933 (7 farm, 926 nonfarm))
Houses: 807 (713 occupied: 611 owner occupied, 114 renter occupied)
| % of renters here: | 16% |
| State: | 33% |
Housing density: 589 houses/condos per square mile
Median price asked for vacant for-sale houses and condos in 2022: $36,613.
Median contract rent in 2022: $903 (lower quartile is $474, upper quartile is $1,067)
Median rent asked for vacant for-rent units in 2022: $1,270
Median gross rent in Chapel Hill, TN in 2022: $1,109
Housing units in Chapel Hill with a mortgage: 391 (45 second mortgage, 0 home equity loan, 31 both second mortgage and home equity loan)
Houses without a mortgage: 0
Median household income for houses/condos with a mortgage: $89,453
Median household income for apartments without a mortgage: $55,642
Median monthly housing costs: $1,140
Compare current foreclosures near Chapel Hill, TN:
| Photo | Address | Area | Beds / Baths | Price | Details |
|---|---|---|---|---|---|

|
#1
High St
Chapel Hill, TN 37034
|
- sq. feet
|
2 baths 3 beds |
show details | |

|
#2
Lindsey Ln
Chapel Hill, TN 37034
|
2,012 sq. feet
|
3 baths 3 beds |
show details | |

|
#3
Vinnie Dell Dr
Chapel Hill, TN 37034
|
1,872 sq. feet
|
2 baths - beds |
show details | |

|
#4
Addison Avenue
Chapel Hill, TN 37034
|
2,208 sq. feet
|
2 baths - beds |
show details | |

|
#5
Hunters Chase Dr
Chapel Hill, TN 37034
|
1,316 sq. feet
|
2 baths - beds |
show details | |

|
#6
Hunters Chase Dr
Chapel Hill, TN 37034
|
1,288 sq. feet
|
2 baths - beds |
show details | |

|
#7
Lindsey Ln
Chapel Hill, TN 37034
|
1,704 sq. feet
|
3 baths - beds |
show details | |

|
#8
Forrest Fields Dr
Chapel Hill, TN 37034
|
1,344 sq. feet
|
2 baths - beds |
show details | |

|
#9
Creekside Ln
Chapel Hill, TN 37034
|
1,626 sq. feet
|
2 baths - beds |
show details | |

|
#10
Hearthstone Dr
Chapel Hill, TN 37034
|
1,200 sq. feet
|
2 baths - beds |
show details |
| Photo | Address | Area | Beds / Baths | Price | Details |
|---|---|---|---|---|---|

|
#11
Crestview St
Chapel Hill, TN 37034
|
- sq. feet
|
- baths - beds |
show details | |

|
#12
Lawrence Ave
Chapel Hill, TN 37034
|
- sq. feet
|
- baths - beds |
show details | |

|
#13
High St
Chapel Hill, TN 37034
|
- sq. feet
|
- baths - beds |
show details | |

|
#14
Addison Ave
Chapel Hill, TN 37034
|
- sq. feet
|
- baths - beds |
show details | |

|
#15
Addison Ave
Chapel Hill, TN 37034
|
- sq. feet
|
- baths - beds |
show details | |

|
#16
Depot St
Chapel Hill, TN 37034
|
- sq. feet
|
- baths - beds |
show details | |

|
#17
River Rd
Chapel Hill, TN 37034
|
- sq. feet
|
- baths - beds |
show details | |

|
#18
Mount Vernon Rd
Chapel Hill, TN 37034
|
- sq. feet
|
- baths - beds |
show details | |

|
#19
Stern Ln
Shelbyville, TN 37160
|
1,232 sq. feet
|
2 baths 3 beds |
show details | |

|
#20
Lequire Lane
Spring Hill, TN 37174
|
3,045 sq. feet
|
4 baths 6 beds |
show details |
| Photo | Address | Area | Beds / Baths | Price | Details |
|---|---|---|---|---|---|

|
#21
Trey Dr
Lewisburg, TN 37091
|
1,190 sq. feet
|
2 baths 3 beds |
show details | |

|
#22
Forest Run Dr
Lewisburg, TN 37091
|
1,400 sq. feet
|
2 baths - beds |
show details | |

|
#23
S Meribeth Ln
Christiana, TN 37037
|
1,133 sq. feet
|
1 baths - beds |
show details | |

|
#24
Shadow Dr
Shelbyville, TN 37160
|
1,404 sq. feet
|
1 baths - beds |
show details | |

|
#25
Buchanan St
Lewisburg, TN 37091
|
893 sq. feet
|
1 baths - beds |
show details | |

|
#26
Neal Crest Cir
Spring Hill, TN 37174
|
3,044 sq. feet
|
4 baths - beds |
show details | |

|
#27
Woods Ave N
Lewisburg, TN 37091
|
1,246 sq. feet
|
1 baths - beds |
show details | |

|
#28
Hardison Ave
Lewisburg, TN 37091
|
1,000 sq. feet
|
2 baths - beds |
show details | |

|
#29
Bedford View Rd
Shelbyville, TN 37160
|
1,050 sq. feet
|
2 baths - beds |
show details | |

|
#30
Gale Ct
Spring Hill, TN 37174
|
1,852 sq. feet
|
3 baths - beds |
show details |
| Photo | Address | Area | Beds / Baths | Price | Details |
|---|---|---|---|---|---|

|
#31
White Dr
Lewisburg, TN 37091
|
1,690 sq. feet
|
1 baths - beds |
show details | |

|
#32
Hill Station Rd
Columbia, TN 38401
|
1,344 sq. feet
|
2 baths - beds |
show details | |

|
#33
Pinehurst Dr
Columbia, TN 38401
|
1,360 sq. feet
|
2 baths - beds |
show details | |

|
#34
Rabbit Branch Rd # A
Shelbyville, TN 37160
|
2,621 sq. feet
|
2 baths - beds |
show details | |

|
#35
Dorchester Dr
Christiana, TN 37037
|
1,528 sq. feet
|
2 baths - beds |
show details | |

|
#36
Eidolon Ct
Christiana, TN 37037
|
1,960 sq. feet
|
3 baths - beds |
show details | |

|
#37
Fremantle Cir
Spring Hill, TN 37174
|
3,142 sq. feet
|
4 baths - beds |
show details | |

|
#38
Joyce Ave
Lewisburg, TN 37091
|
2,048 sq. feet
|
3 baths - beds |
show details | |

|
#39
Wedgewood Dr
Lewisburg, TN 37091
|
2,348 sq. feet
|
2 baths - beds |
show details | |

|
#40
Warner Bridge Rd
Shelbyville, TN 37160
|
960 sq. feet
|
1 baths - beds |
show details |
| Photo | Address | Area | Beds / Baths | Price | Details |
|---|---|---|---|---|---|

|
#41
Silver St
Lewisburg, TN 37091
|
630 sq. feet
|
1 baths - beds |
show details | |

|
#42
Chance Ave
Lewisburg, TN 37091
|
1,092 sq. feet
|
2 baths - beds |
show details | |

|
#43
Carpenters Pass
Spring Hill, TN 37174
|
2,371 sq. feet
|
2 baths - beds |
show details | |

|
#44
White Oak Trl
Spring Hill, TN 37174
|
2,498 sq. feet
|
2 baths - beds |
show details | |

|
#45
Frank Martin Rd
Shelbyville, TN 37160
|
875 sq. feet
|
1 baths - beds |
show details | |

|
#46
Sumerset Cir
Lewisburg, TN 37091
|
1,231 sq. feet
|
2 baths - beds |
show details | |

|
#47
Dellrose Dr
Bell Buckle, TN 37020
|
1,347 sq. feet
|
2 baths - beds |
show details | |

|
#48
Limestone Ave
Lewisburg, TN 37091
|
2,542 sq. feet
|
1 baths - beds |
show details | |

|
#49
Dellrose Dr
Bell Buckle, TN 37020
|
1,380 sq. feet
|
2 baths - beds |
show details | |

|
Check over 1 million property listings on Foreclosure.com!
|
browse all offers | |||


 | Looking for houses for rent in Chapel Hill TN (2 replies) |
| Five Questions about Living in Franklin, TN (25 replies) |
| Columbia area towns? (20 replies) |
| Possible relocation to Chapel Hill, TN or surrounding areas (5 replies) |
| Realtor recommendations for rural areas? (1 reply) |
| HomeSchooling in Tennessee (11 replies) |

Median year apartment built: 1992
Household type by relationship:
Households: 1,655- Male householders: 325 (90 living alone), Female householders: 378 (119 living alone)
358 spouses (358 opposite-sex spouses), 18 unmarried partners, (18 opposite-sex unmarried partners), 358 children (313 natural, 16 adopted, 28 stepchildren), 64 grandchildren, 8 brothers or sisters, 53 parents, 0 foster children, 52 other relatives, 36 non-relatives
Size of family households: 268 2-persons, 80 3-persons, 85 4-persons, 46 5-persons, 8 6-persons.
Size of nonfamily households: 213 1-person, 21 2-persons.
156 married couples with children.
38 single-parent households (22 men, 16 women).
95.7% of residents of Chapel Hill speak English at home.
1.5% of residents speak Spanish at home (100% speak English very well).
2.3% of residents speak other Indo-European language at home (100% speak English very well).
Foreign born population: 5 (0.3%)
(100.0% of them are naturalized citizens)
| Here: | 6.1 |
| State: | 6.5 |
| Here: | 4.8 |
| State: | 4.4 |
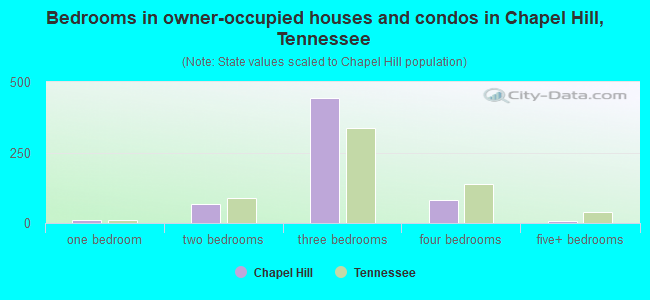
- Bedrooms in owner-occupied houses and condos in Chapel Hill, Tennessee
- 0no bedroom
- 121 bedroom
- 692 bedrooms
- 4443 bedrooms
- 804 bedrooms
- 75+ bedrooms
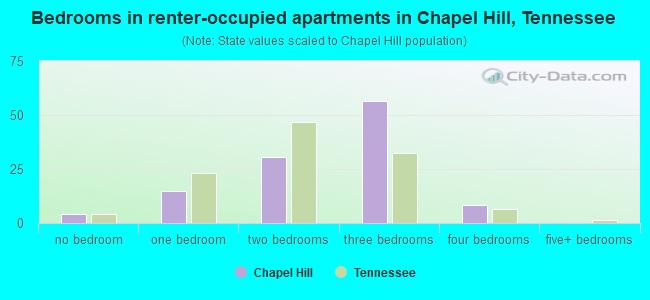
- Bedrooms in renter-occupied apartments in Chapel Hill, Tennessee
- 4no bedroom
- 151 bedroom
- 302 bedrooms
- 573 bedrooms
- 84 bedrooms
- 05+ bedrooms
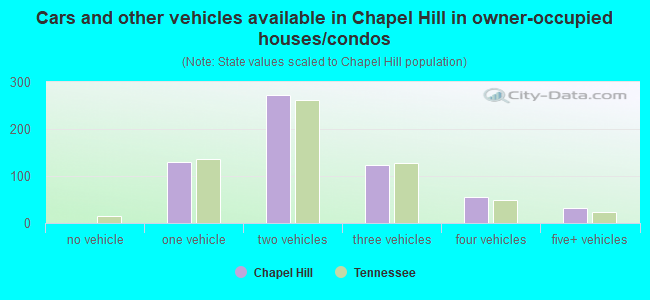
- Cars and other vehicles available in Chapel Hill in owner-occupied houses/condos
- 0no vehicle
- 1291 vehicle
- 2732 vehicles
- 1243 vehicles
- 554 vehicles
- 315+ vehicles
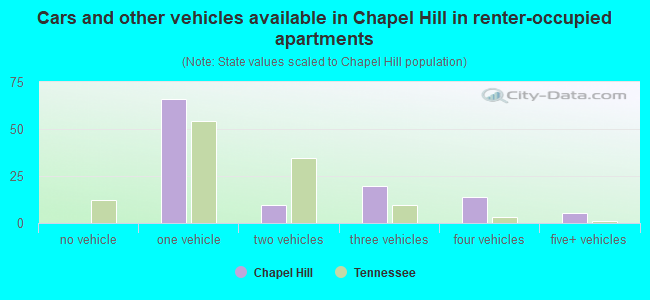
- Cars and other vehicles available in Chapel Hill in renter-occupied apartments
- 0no vehicle
- 661 vehicle
- 92 vehicles
- 203 vehicles
- 144 vehicles
- 55+ vehicles
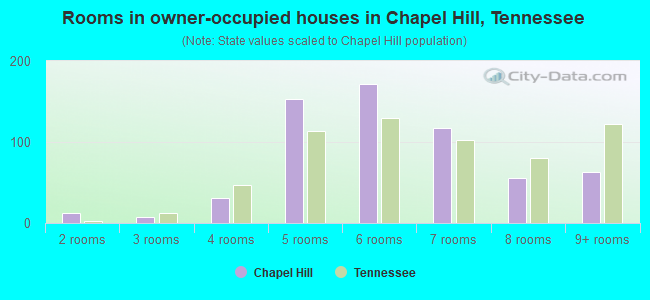
- Rooms in owner-occupied houses in Chapel Hill, Tennessee
- 01 room
- 122 rooms
- 73 rooms
- 314 rooms
- 1535 rooms
- 1726 rooms
- 1177 rooms
- 568 rooms
- 639+ rooms
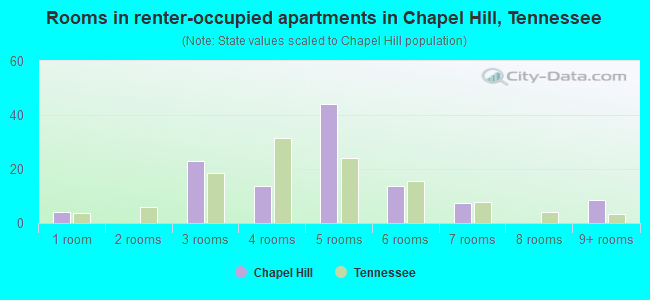
- Rooms in renter-occupied apartments in Chapel Hill, Tennessee
- 41 room
- 02 rooms
- 233 rooms
- 144 rooms
- 445 rooms
- 146 rooms
- 77 rooms
- 08 rooms
- 89+ rooms
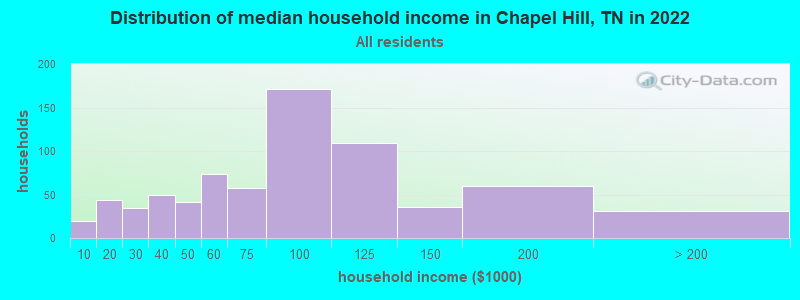
Chapel Hill, TN household income distribution

- 20Less than $10,000
- 44$10,000 to $19,999
- 35$20,000 to $29,999
- 49$30,000 to $39,999
- 41$40,000 to $49,999
- 74$50,000 to $59,999
- 58$60,000 to $74,999
- 171$75,000 to $99,999
- 109$100,000 to $124,999
- 36$125,000 to $149,999
- 60$150,000 to $199,999
- 31$200,000 or more
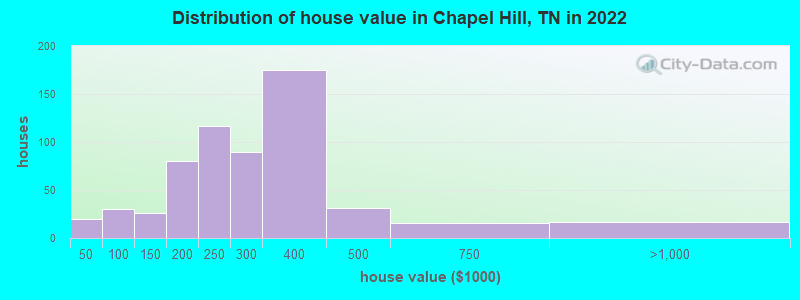
Home value of owner - occupied houses in 2022 in Chapel Hill, TN
-
- 15$20,000 to $24,999
- 4$35,000 to $39,999
- 3$50,000 to $59,999
- 3$60,000 to $69,999
- 14$70,000 to $79,999
- 7$80,000 to $89,999
- 10$100,000 to $124,999
- 15$125,000 to $149,999
- 47$150,000 to $174,999
- 32$175,000 to $199,999
- 117$200,000 to $249,999
- 90$250,000 to $299,999
- 175$300,000 to $399,999
- 30$400,000 to $499,999
- 15$500,000 to $749,999
- 17$750,000 to $999,999
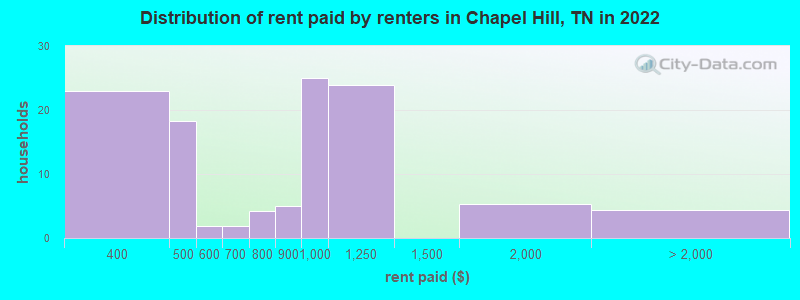
Rent paid by renters in 2022 in Chapel Hill, TN
-
- 17$300 to $349
- 5$350 to $399
- 7$400 to $449
- 11$450 to $499
- 1$550 to $599
- 1$650 to $699
- 4$700 to $749
- 5$800 to $899
- 24$900 to $999
- 23$1,000 to $1,249
- 5$1,500 to $1,999
- 4No cash rent
Percentage of workers working in this county: 25.8%
Number of people working at home: 41 (4.6% of all workers)
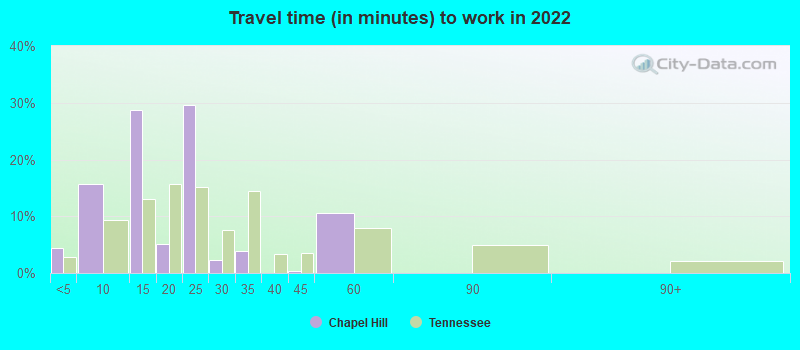
Travel time to work (commute)
- Less than 5 minutes: 18
- 5 to 9 minutes: 49
- 10 to 14 minutes: 52
- 15 to 19 minutes: 45
- 20 to 24 minutes: 32
- 25 to 29 minutes: 42
- 30 to 34 minutes: 139
- 35 to 39 minutes: 60
- 40 to 44 minutes: 115
- 45 to 59 minutes: 175
- 60 to 89 minutes: 63
- 90 or more minutes: 20
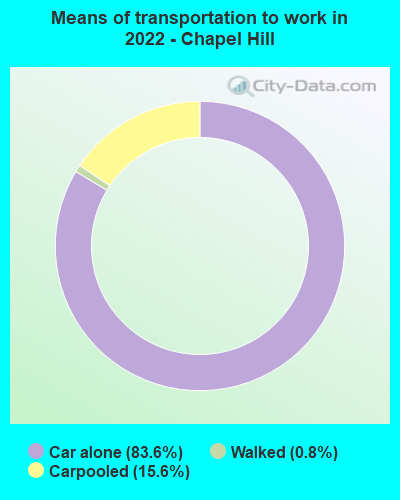
Means of transportation to work:
- Drove a car alone: 646 (76.8%)
- Carpooled: 127 (15.1%)
- Walked: 6 (0.7%)
- Worked at home: 41 (4.9%)
- Unemployment by race in 2022
- Unemployment rate for White non-Hispanic residents
- 1.8%Males
- 4.3%Females
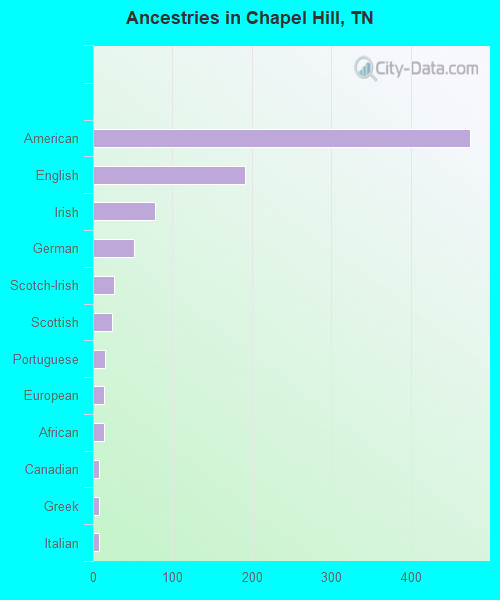
First ancestries reported:
- American: 475 (47.7%)
- English: 191 (19.2%)
- Irish: 78 (7.8%)
- German: 52 (5.2%)
- Scotch-Irish: 26 (2.6%)
- Scottish: 24 (2.4%)
- Portuguese: 15 (1.5%)
- European: 14 (1.4%)
- African: 14 (1.4%)
- Canadian: 8 (0.8%)
- Greek: 8 (0.8%)
- Italian: 8 (0.8%)
- Belgian: 4 (0.4%)
- French: 3 (0.3%)
- Polish: 1 (0.1%)
Most common places of birth for foreign-born residents (%):
| Chapel Hill: | 100.0% (5) |
| Tennessee: | 2.7% (10,295) |
Place of birth for U.S.-born residents:
- This state: 1,085
- Other state: 532
- Northeast: 94
- Midwest: 238
- South: 114
- West: 85
93.3% of Chapel Hill residents lived in the same house 1 years ago.
Out of people who lived in different houses, 13.0% lived in this county.
Out of people who lived in different counties, 73.5% lived in Tennessee.
| Chapel Hill: | 93.3% |
| State average: | 87.0% |
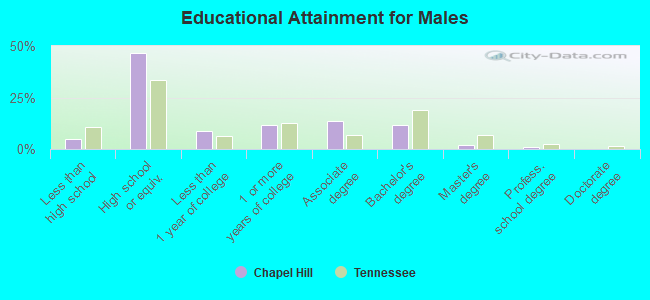
Education attainment for males 25 years and older:
- No schooling: 9
- Nursery to 4th grade: 0
- 5th and 6th grade: 0
- 7th and 8th grade: 5
- 9th grade: 0
- 10th grade: 8
- 11th grade: 5
- 12th grade, no diploma: 5
- High school graduate (or equivalency): 292
- Less than 1 year of college: 54
- Some college more than 1 year, no degree: 74
- Associate degree: 85
- Bachelor's degree: 74
- Master's degree: 11
- Professional school degree: 7
- Doctorate degree: 0
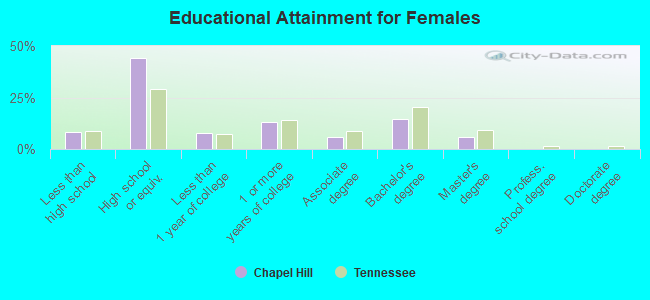
Education attainment for females 25 years and older:
- No schooling: 8
- Nursery to 4th grade: 0
- 5th and 6th grade: 0
- 7th and 8th grade: 15
- 9th grade: 0
- 10th grade: 13
- 11th grade: 14
- 12th grade, no diploma: 2
- High school graduate (or equivalency): 272
- Less than 1 year of college: 49
- Some college more than 1 year, no degree: 79
- Associate degree: 37
- Bachelor's degree: 89
- Master's degree: 36
- Professional school degree: 0
- Doctorate degree: 0


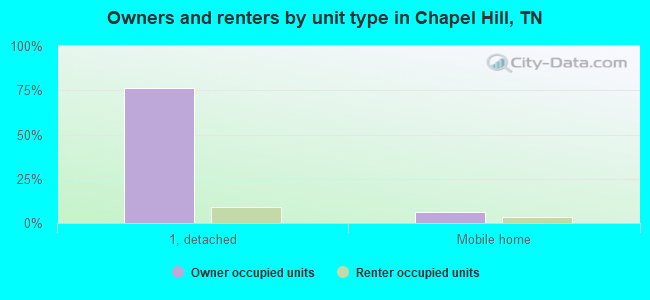
Housing units in structures:
- One, detached: 705
- One, attached: 3
- 3 or 4: 7
- 5 to 9: 17
- 20 to 49: 3
- Mobile homes: 71
Housing units lacking complete kitchen facilities in 2022: 4.7%
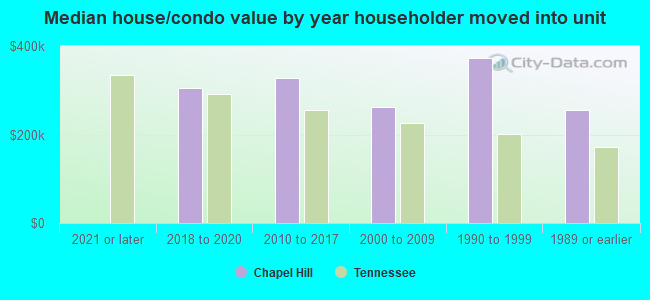
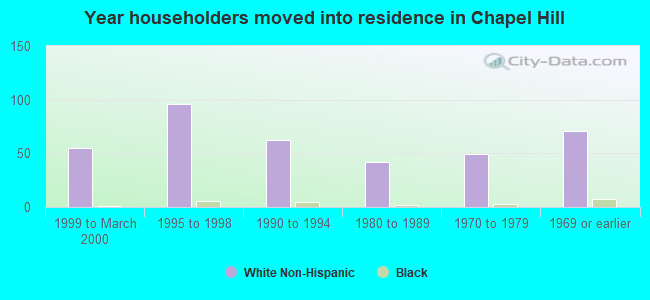
House/condo owner moved in on average 9 years ago
Renter moved in on average 7 years ago
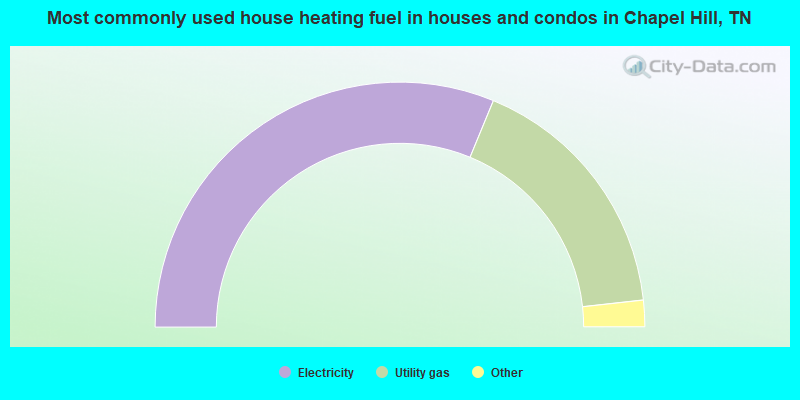
- 62.6%Electricity
- 34.1%Utility gas
- 2.1%Fuel oil, kerosene, etc.
- 0.7%Wood
- 0.5%Bottled, tank, or LP gas
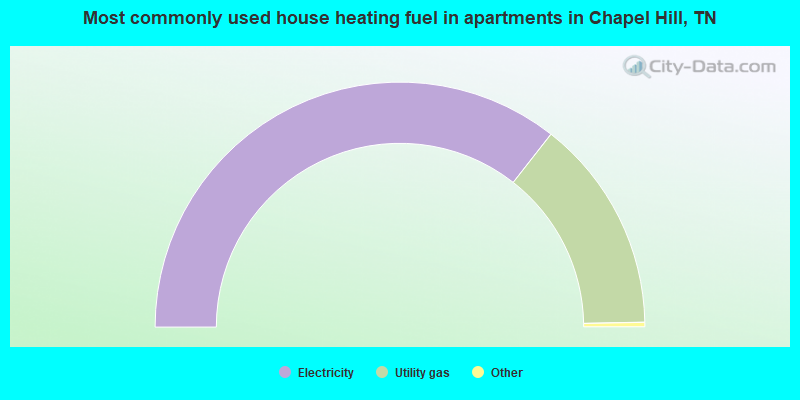
- 71.6%Electricity
- 28.4%Utility gas
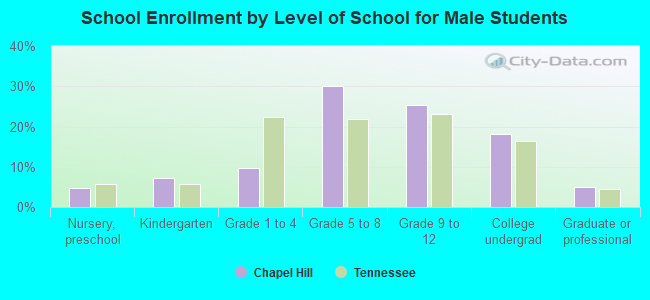
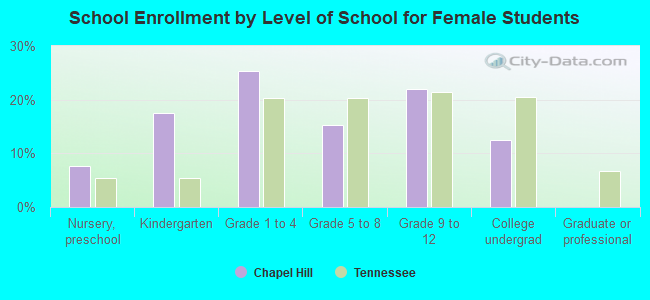
Private vs. public school enrollment:
| Here: | 6.7% |
| Tennessee: | 15.0% |
| Here: | 5.9% |
| Tennessee: | 16.2% |
| Here: | 0.0% |
| Tennessee: | 23.5% |