Chattanooga, TN (Tennessee) Houses and Residents
Estimated median house or condo value in 2022: $284,000 (it was $83,300 in 2000 )
Chattanooga:
$284,000Tennessee:
$284,800
Lower value quartile - upper value quartile: $177,400 - $405,900Mean price in 2022: Detached houses: $327,749 Here:
$327,749State:
$374,382
Townhouses or other attached units: $348,726 Here:
$348,726State:
$354,101
In 2-unit structures: $340,609 Here:
$340,609State:
$247,693
In 3-to-4-unit structures: $346,775 Here:
$346,775State:
$239,060
In 5-or-more-unit structures: $401,909 Here:
$401,909State:
$317,434
Mobile homes: $91,716 Here:
$91,716State:
$101,421
Occupied boats, RVs, vans, etc.: $333,743 Here:
$333,743State:
$142,822
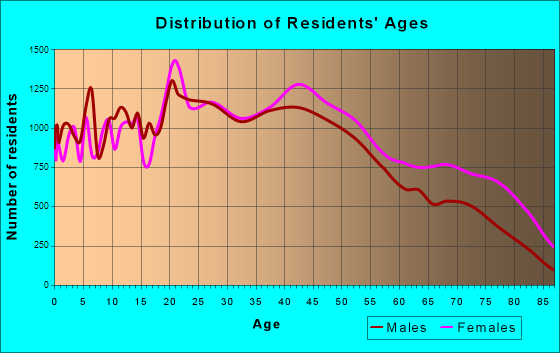
Total population: 173,778 (Urban population: 154,170, Rural population: 1,339 (all nonfarm) )
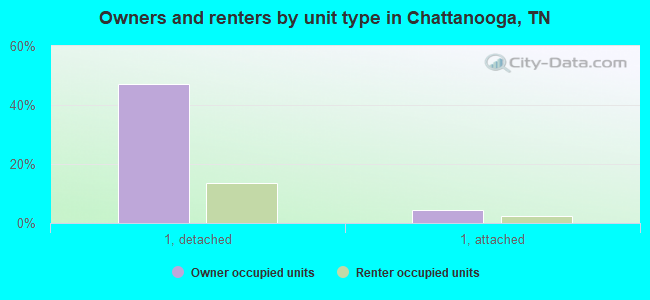
Houses: 86,737 (76,930 occupied: 44,380 owner occupied, 32,550 renter occupied )
% of renters here:
42%State:
33%
Housing density: 642 houses/condos per square mile
Median price asked for vacant for-sale houses and condos in 2022: $392,152.
Median contract rent in 2022: $1,009 (lower quartile is $746, upper quartile is $1,310)
Median rent asked for vacant for-rent units in 2022: $1,620
Median gross rent in Chattanooga, TN in 2022: $1,176
Housing units in Chattanooga with a mortgage: 25,503 (2,294 second mortgage, 0 home equity loan, 1,633 both second mortgage and home equity loan )Houses without a mortgage: 629
Median household income for houses/condos with a mortgage: $102,177
Median household income for apartments without a mortgage: $66,875
Median monthly housing costs: $1,085
Data:
Median house or condo value ($)
Median house or condo value ($ change since 2000)
Median house or condo value ($) - White
Median house or condo value ($) - Black or African American
Median house or condo value ($) - Asian
Median house or condo value ($) - Hispanic or Latino
Median house or condo value ($) - American Indian and Alaska Native
Median house or condo value ($) - Multirace
Median house or condo value ($) - Other Race
Median price asked for mobile homes ($)
Household density (households per square mile)
Mean house or condo value by units in structure - 1, detached ($)
Mean house or condo value by units in structure - 1, attached ($)
Mean house or condo value by units in structure - 2 ($)
Mean house or condo value by units in structure by units in structure - 3 or 4 ($)
Mean house or condo value by units in structure - 5 or more ($)
Mean house or condo value by units in structure - Boat, RV, van, etc. ($)
Mean house or condo value by units in structure - Mobile home ($)
Median contract rent ($)
Median contract rent - Lower quartile ($)
Median contract rent - Upper quartile ($)
Median gross rent ($)
Urban houses (%)
Rural houses (%)
Houses occupied (%)
Houses occupied (% change since 2000)
Houses owner occupied (%)
Houses owner occupied (% change since 2000)
Houses renter occupied (%)
Houses renter occupied (% change since 2000)
Vacant housing units - For rent (%)
Vacant housing units - For rent (% change since 2000)
Vacant housing units - For sale only (%)
Vacant housing units - For sale only (% change since 2000)
Vacant housing units - Rented or sold, not occupied (%)
Vacant housing units - Rented or sold, not occupied (% change since 2000)
Vacant housing units - For seasonal, recreational, or occasional use (%)
Vacant housing units - For seasonal, recreational, or occasional use (% change since 2000)
Vacant housing units - For migrant workers (%)
Vacant housing units - For migrant workers (% change since 2000)
Vacant housing units - Other vacant (%)
Vacant housing units - Other vacant (% change since 2000)
Median monthly housing costs ($)
Median household income for houses/condos with a mortgage ($)
Median household income for houses/condos without a mortgage ($)
Median household income ($)
Median household income ($) - White
Median household income ($) - Black or African American
Median household income ($) - Asian
Median household income ($) - Hispanic or Latino
Median household income ($) - American Indian and Alaska Native
Median household income ($) - Multirace
Median household income ($) - Other Race
Mortgage status - with mortgage (%)
Mortgage status - with second mortgage (%)
Mortgage status - with home equity loan (%)
Mortgage status - with both second mortgage and home equity loan (%)
Mortgage status - without a mortgage (%)
Median year house/condo built
Median year apartment built
Household type by relationship - Male householder living alone (%)
Household type by relationship - Male householder not living alone (%)
Household type by relationship - Female householder living alone (%)
Household type by relationship - Female householder not living alone (%)
Household type by relationship - Opposite-Sex spouse (%)
Household type by relationship - Same-Sex spouse (%)
Household type by relationship - Opposite-Sex unmarried partner (%)
Household type by relationship - Same-Sex unmarried partner (%)
Household type by relationship - In group quarters (%)
Size of family households - 2-person household (%)
Size of family households - 3-person household (%)
Size of family households - 4-person household (%)
Size of family households - 5-person household (%)
Size of family households - 6-person household (%)
Size of family households - 7-or-more-person household (%)
Size of nonfamily households - 1-person household (%)
Size of nonfamily households - 2-person household (%)
Size of nonfamily households - 3-person household (%)
Size of nonfamily households - 4-person household (%)
Size of nonfamily households - 5-person household (%)
Size of nonfamily households - 6-person household (%)
Size of nonfamily households - 7-or-moreperson household (%)
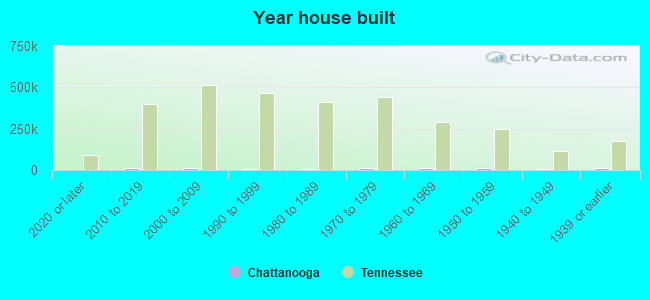
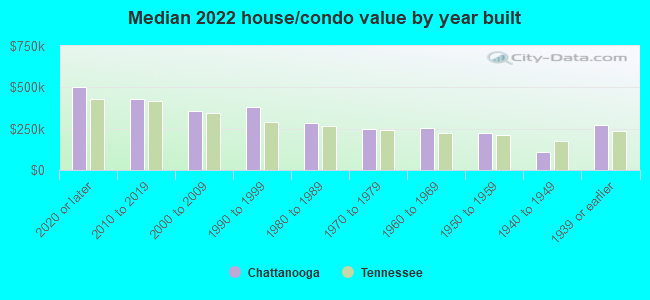
Year house built - Built 2010 or later (%)
Year house built - Built 2000 to 2009 (%)
Year house built - Built 1990 to 1999 (%)
Year house built - Built 1980 to 1989 (%)
Year house built - Built 1970 to 1979 (%)
Year house built - Built 1960 to 1969 (%)
Year house built - Built 1950 to 1959 (%)
Year house built - Built 1940 to 1949 (%)
Year house built - Built 1939 or earlier (%)
Median number of rooms in houses and condos
Median number of rooms in apartments
Median number of bedrooms in owner occupied houses
Mean number of bedrooms in owner occupied houses
Median number of bedrooms in renter occupied houses
Mean number of bedrooms in renter occupied houses
Median number of vehichles in owner occupied houses
Mean number of vehichles in owner occupied houses
Median number of vehichles in renter occupied houses
Mean number of vehichles in renter occupied houses
Rooms in owner-occupied houses - 1 room (%)
Rooms in owner-occupied houses - 2 rooms (%)
Rooms in owner-occupied houses - 3 rooms (%)
Rooms in owner-occupied houses - 4 rooms (%)
Rooms in owner-occupied houses - 5 rooms (%)
Rooms in owner-occupied houses - 6 rooms (%)
Rooms in owner-occupied houses - 7 rooms (%)
Rooms in owner-occupied houses - 8 rooms (%)
Rooms in owner-occupied houses - 9+ rooms (%)
Rooms in renter-occupied houses - 1 room (%)
Rooms in renter-occupied houses - 2 rooms (%)
Rooms in renter-occupied houses - 3 rooms (%)
Rooms in renter-occupied houses - 4 rooms (%)
Rooms in renter-occupied houses - 5 rooms (%)
Rooms in renter-occupied houses - 6 rooms (%)
Rooms in renter-occupied houses - 7 rooms (%)
Rooms in renter-occupied houses - 8 rooms (%)
Rooms in renter-occupied houses - 9+ rooms (%)
Bedrooms in owner-occupied houses - no bedrooms (%)
Bedrooms in owner-occupied houses - 1 bedroom (%)
Bedrooms in owner-occupied houses - 2 bedrooms (%)
Bedrooms in owner-occupied houses - 3 bedrooms (%)
Bedrooms in owner-occupied houses - 4 bedrooms (%)
Bedrooms in owner-occupied houses - 5+ bedrooms (%)
Bedrooms in renter-occupied houses - no bedrooms (%)
Bedrooms in renter-occupied houses - 1 bedroom (%)
Bedrooms in renter-occupied houses - 2 bedrooms (%)
Bedrooms in renter-occupied houses - 3 bedrooms (%)
Bedrooms in renter-occupied houses - 4 bedrooms (%)
Bedrooms in renter-occupied houses - 5+ bedrooms (%)
Vehicles available in owner-occupied houses - no vehicle available (%)
Vehicles available in owner-occupied houses - 1 vehicle available(%)
Vehicles available in owner-occupied houses - 2 Vehicles available (%)
Vehicles available in owner-occupied houses - 3 Vehicles available (%)
Vehicles available in owner-occupied houses - 4 Vehicles available (%)
Vehicles available in owner-occupied houses - 5+ Vehicles available (%)
Vehicles available in renter-occupied houses - no vehicle available (%)
Vehicles available in renter-occupied houses - 1 vehicle available (%)
Vehicles available in renter-occupied houses - 2 Vehicles available (%)
Vehicles available in renter-occupied houses - 3 Vehicles available (%)
Vehicles available in renter-occupied houses - 4 Vehicles available (%)
Vehicles available in renter-occupied houses - 5+ Vehicles available (%)
Housing units in structures - 1, detached (%)
Housing units in structures - 1, attached (%)
Housing units in structures - 2 (%)
Housing units in structures - 3 or 4 (%)
Housing units in structures - 5 to 9 (%)
Housing units in structures - 10 to 19 (%)
Housing units in structures - 20 to 49 (%)
Housing units in structures - 50 or more (%)
Housing units in structures - Mobile home (%)
Housing units in structures - Boat, RV, van, etc. (%)
Housing units in structures - Owners - 1, detached (%)
Housing units in structures - Owners - 1, attached (%)
Housing units in structures - Owners - 2 (%)
Housing units in structures - Owners - 3 or 4 (%)
Housing units in structures - Owners - 5 to 9 (%)
Housing units in structures - Owners - 10 to 19 (%)
Housing units in structures - Owners - 20 to 49 (%)
Housing units in structures - Owners - 50 or more (%)
Housing units in structures - Owners - Mobile home (%)
Housing units in structures - Owners - Boat, RV, van, etc. (%)
Housing units in structures - Renters - 1, detached (%)
Housing units in structures - Renters - 1, attached (%)
Housing units in structures - Renters - 2 (%)
Housing units in structures - Renters - 3 or 4 (%)
Housing units in structures - Renters - 5 to 9 (%)
Housing units in structures - Renters - 10 to 19 (%)
Housing units in structures - Renters - 20 to 49 (%)
Housing units in structures - Renters - 50 or more (%)
Housing units in structures - Renters - Mobile home (%)
Housing units in structures - Renters - Boat, RV, van, etc. (%)
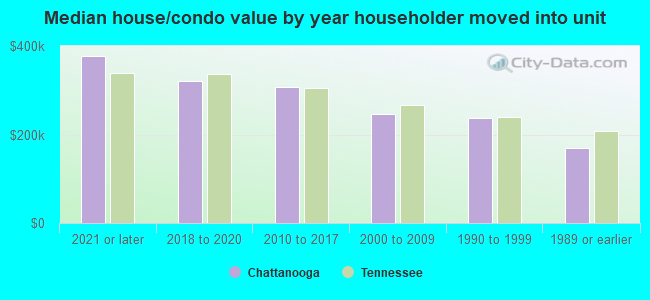
House/condo owner moved in on average (years ago)
Renter moved in on average (years ago)
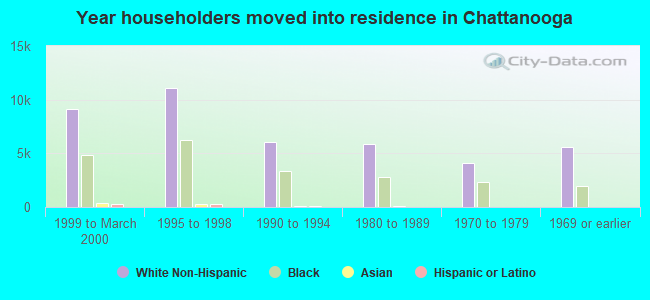
Year householder moved into unit - Moved in 1999 to March 2000 (%)
Year householder moved into unit - Moved in 1999 to March 2000 (%) - White
Year householder moved into unit - Moved in 1999 to March 2000 (%) - Black or African American
Year householder moved into unit - Moved in 1999 to March 2000 (%) - Asian
Year householder moved into unit - Moved in 1999 to March 2000 (%) - Hispanic or Latino
Year householder moved into unit - Moved in 1999 to March 2000 (%) - American Indian and Alaska Native
Year householder moved into unit - Moved in 1999 to March 2000 (%) - Multirace
Year householder moved into unit - Moved in 1999 to March 2000 (%) - Other Race
Year householder moved into unit - Moved in 1995 to 1998 (%)
Year householder moved into unit - Moved in 1995 to 1998 (%) - White
Year householder moved into unit - Moved in 1995 to 1998 (%) - Black or African American
Year householder moved into unit - Moved in 1995 to 1998 (%) - Asian
Year householder moved into unit - Moved in 1995 to 1998 (%) - Hispanic or Latino
Year householder moved into unit - Moved in 1995 to 1998 (%) - American Indian and Alaska Native
Year householder moved into unit - Moved in 1995 to 1998 (%) - Multirace
Year householder moved into unit - Moved in 1995 to 1998 (%) - Other Race
Year householder moved into unit - Moved in 1990 to 1994 (%)
Year householder moved into unit - Moved in 1990 to 1994 (%) - White
Year householder moved into unit - Moved in 1990 to 1994 (%) - Black or African American
Year householder moved into unit - Moved in 1990 to 1994 (%) - Asian
Year householder moved into unit - Moved in 1990 to 1994 (%) - Hispanic or Latino
Year householder moved into unit - Moved in 1990 to 1994 (%) - American Indian and Alaska Native
Year householder moved into unit - Moved in 1990 to 1994 (%) - Multirace
Year householder moved into unit - Moved in 1990 to 1994 (%) - Other Race
Year householder moved into unit - Moved in 1980 to 1989 (%)
Year householder moved into unit - Moved in 1980 to 1989 (%) - White
Year householder moved into unit - Moved in 1980 to 1989 (%) - Black or African American
Year householder moved into unit - Moved in 1980 to 1989 (%) - Asian
Year householder moved into unit - Moved in 1980 to 1989 (%) - Hispanic or Latino
Year householder moved into unit - Moved in 1980 to 1989 (%) - American Indian and Alaska Native
Year householder moved into unit - Moved in 1980 to 1989 (%) - Multirace
Year householder moved into unit - Moved in 1980 to 1989 (%) - Other Race
Year householder moved into unit - Moved in 1970 to 1979 (%)
Year householder moved into unit - Moved in 1970 to 1979 (%) - White
Year householder moved into unit - Moved in 1970 to 1979 (%) - Black or African American
Year householder moved into unit - Moved in 1970 to 1979 (%) - Asian
Year householder moved into unit - Moved in 1970 to 1979 (%) - Hispanic or Latino
Year householder moved into unit - Moved in 1970 to 1979 (%) - American Indian and Alaska Native
Year householder moved into unit - Moved in 1970 to 1979 (%) - Multirace
Year householder moved into unit - Moved in 1970 to 1979 (%) - Other Race
Year householder moved into unit - Moved in 1969 or earlier (%)
Year householder moved into unit - Moved in 1969 or earlier (%) - White
Year householder moved into unit - Moved in 1969 or earlier (%) - Black or African American
Year householder moved into unit - Moved in 1969 or earlier (%) - Asian
Year householder moved into unit - Moved in 1969 or earlier (%) - Hispanic or Latino
Year householder moved into unit - Moved in 1969 or earlier (%) - American Indian and Alaska Native
Year householder moved into unit - Moved in 1969 or earlier (%) - Multirace
Year householder moved into unit - Moved in 1969 or earlier (%) - Other Race
Housing units lacking complete plumbing facilities (%)
Housing units lacking complete kitchen facilities (%)
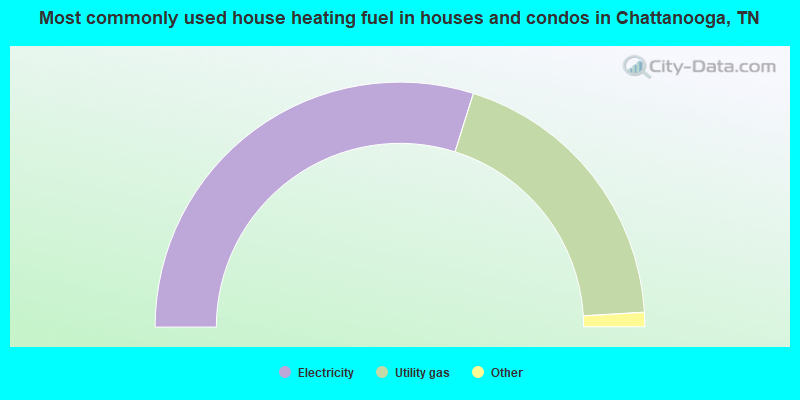
House heating fuel used in houses and condos - Utility gas (%)
House heating fuel used in houses and condos - Bottled, tank, or LP gas (%)
House heating fuel used in houses and condos - Electricity (%)
House heating fuel used in houses and condos - Fuel oil, kerosene, etc. (%)
House heating fuel used in houses and condos - Coal or coke (%)
House heating fuel used in houses and condos - Wood (%)
House heating fuel used in houses and condos - Solar energy (%)
House heating fuel used in houses and condos - Other fuel (%)
House heating fuel used in houses and condos - No fuel used (%)
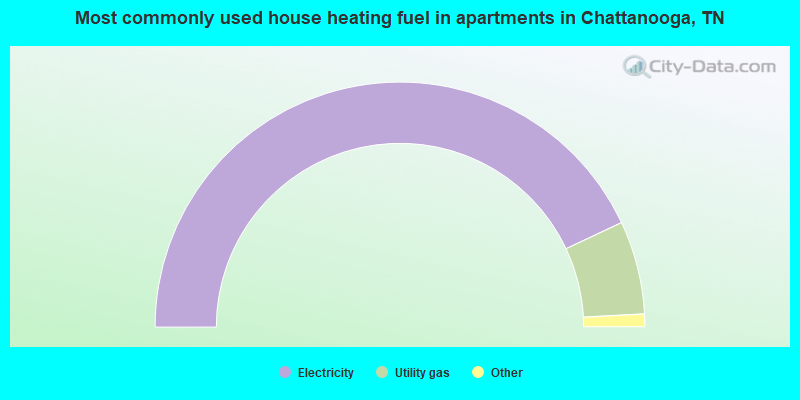
House heating fuel used in apartments - Utility gas (%)
House heating fuel used in apartments - Bottled, tank, or LP gas (%)
House heating fuel used in apartments - Electricity (%)
House heating fuel used in apartments - Fuel oil, kerosene, etc. (%)
House heating fuel used in apartments - Coal or coke (%)
House heating fuel used in apartments - Wood (%)
House heating fuel used in apartments - Solar energy (%)
House heating fuel used in apartments - Other fuel (%)
House heating fuel used in apartments - No fuel used (%)
Latest news about housing in Chattanooga, TN collected exclusively by city-data.com from local newspapers, TV, and radio stations
Median year house/condo built: 1971Median year apartment built: 1983Household type by relationship:
Households: 184,071
Male householders: 36,558 (12,189 living alone ), Female householders: 40,372 (13,989 living alone )28,896 spouses (28,387 opposite-sex spouses ), 6,670 unmarried partners , (6,510 opposite-sex unmarried partners ), 45,541 children (42,896 natural , 624 adopted , 2,021 stepchildren ), 4,337 grandchildren , 1,810 brothers or sisters , 2,543 parents , 0 foster children , 3,939 other relatives , 7,924 non-relatives In group quarters: 5,481
Size of family households: 19,490 2-persons , 9,330 3-persons , 7,971 4-persons , 3,171 5-persons , 1,087 6-persons , 734 7-or-more-persons .
Size of nonfamily households: 26,178 1-person , 8,343 2-persons , 565 3-persons , 61 4-persons .
21,306 married couples with children. single-parent households (1,737 men , 10,346 women ).
89.3% of residents of Chattanooga speak English at home. of residents speak Spanish at home (43% speak English very well , 23% speak English well , 23% speak English not well , 11% don't speak English at all ).of residents speak other Indo-European language at home (64% speak English very well , 21% speak English well , 12% speak English not well , 4% don't speak English at all ).of residents speak Asian or Pacific Island language at home (58% speak English very well , 19% speak English well , 19% speak English not well , 5% don't speak English at all ).of residents speak other language at home (63% speak English very well , 25% speak English well , 12% speak English not well ).
Foreign born population: 12,787 (6.9%)of them are naturalized citizens )
Median number of rooms in houses and condos:
Median number of rooms in apartments
Owner-occupied Renter-occupied
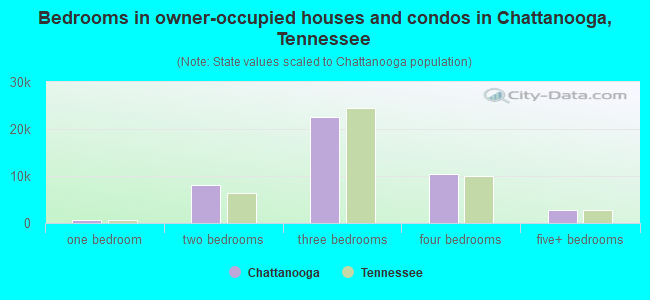
Bedrooms in owner-occupied houses and condos in Chattanooga, Tennessee
92 no bedroom 546 1 bedroom 8,031 2 bedrooms 22,500 3 bedrooms 10,504 4 bedrooms 2,707 5+ bedrooms
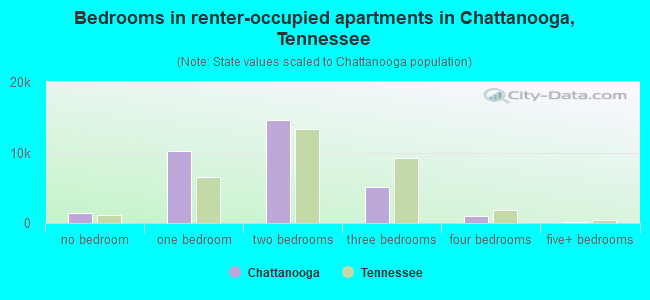
Bedrooms in renter-occupied apartments in Chattanooga, Tennessee
1,426 no bedroom 10,270 1 bedroom 14,623 2 bedrooms 5,090 3 bedrooms 1,004 4 bedrooms 137 5+ bedrooms
Owner-occupied Renter-occupied
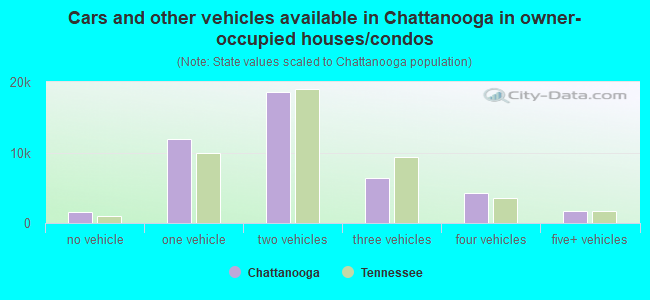
Cars and other vehicles available in Chattanooga in owner-occupied houses/condos
1,503 no vehicle 11,887 1 vehicle 18,623 2 vehicles 6,430 3 vehicles 4,294 4 vehicles 1,643 5+ vehicles
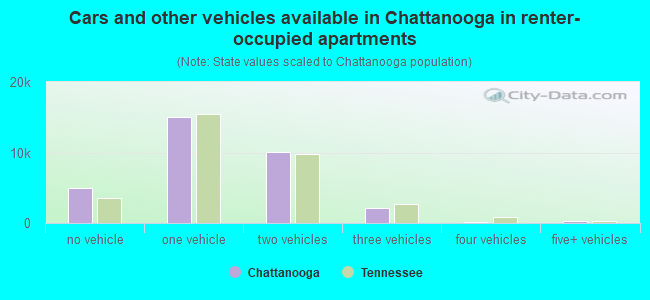
Cars and other vehicles available in Chattanooga in renter-occupied apartments
4,901 no vehicle 15,045 1 vehicle 10,075 2 vehicles 2,165 3 vehicles 124 4 vehicles 240 5+ vehicles
Owner-occupied Renter-occupied
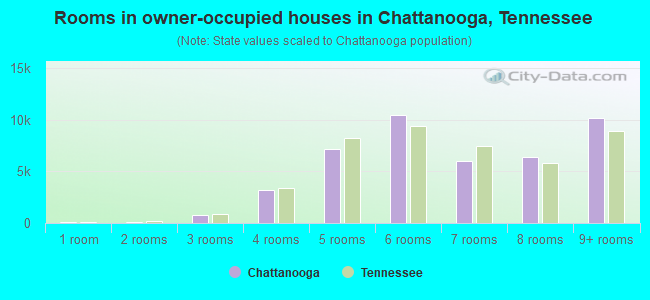
Rooms in owner-occupied houses in Chattanooga, Tennessee
92 1 room 67 2 rooms 757 3 rooms 3,240 4 rooms 7,167 5 rooms 10,462 6 rooms 6,028 7 rooms 6,348 8 rooms 10,219 9+ rooms
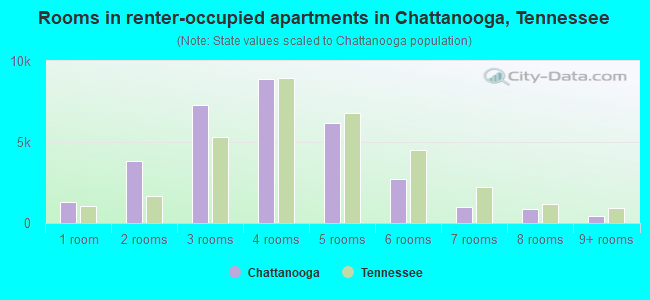
Rooms in renter-occupied apartments in Chattanooga, Tennessee
1,302 1 room 3,856 2 rooms 7,276 3 rooms 8,909 4 rooms 6,179 5 rooms 2,746 6 rooms 975 7 rooms 864 8 rooms 443 9+ rooms
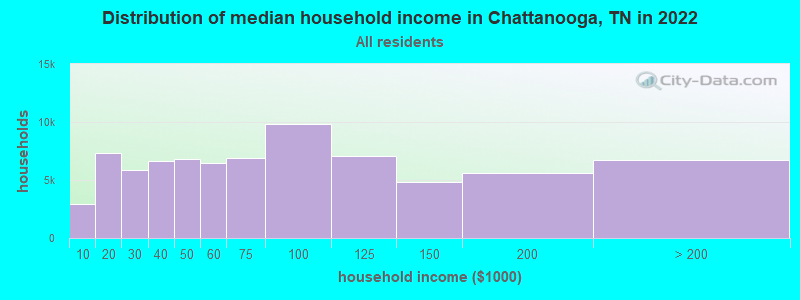
Chattanooga, TN household income distribution 2,954 Less than $10,0007,344 $10,000 to $19,9995,849 $20,000 to $29,9996,670 $30,000 to $39,9996,772 $40,000 to $49,9996,426 $50,000 to $59,9996,855 $60,000 to $74,9999,829 $75,000 to $99,9997,092 $100,000 to $124,9994,832 $125,000 to $149,9995,604 $150,000 to $199,9996,703 $200,000 or more
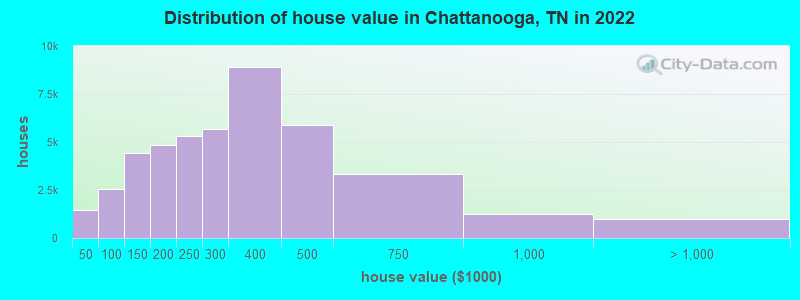
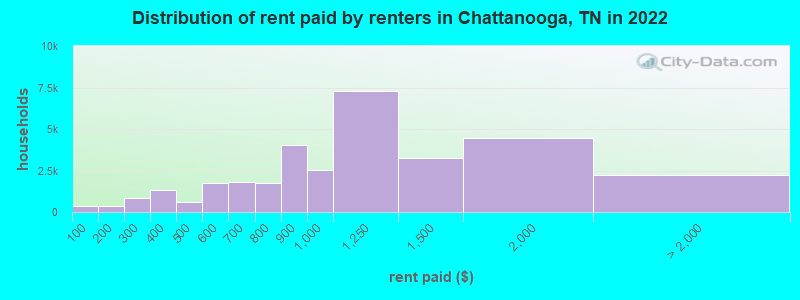
Home value of owner - occupied houses in 2022 in Chattanooga, TN 392 Less than $10,000101 $10,000 to $14,999200 $15,000 to $19,999128 $20,000 to $24,99930 $25,000 to $29,999228 $30,000 to $34,999105 $35,000 to $39,999283 $40,000 to $49,999158 $50,000 to $59,999139 $60,000 to $69,999672 $70,000 to $79,999804 $80,000 to $89,999491 $90,000 to $99,9991,573 $100,000 to $124,9992,865 $125,000 to $149,9992,720 $150,000 to $174,9992,133 $175,000 to $199,9995,319 $200,000 to $249,9995,665 $250,000 to $299,9998,931 $300,000 to $399,9995,875 $400,000 to $499,9993,309 $500,000 to $749,9991,262 $750,000 to $999,999642 $1,000,000 to $1,499,99943 $1,500,000 to $1,999,999312 $2,000,000 or moreRent paid by renters in 2022 in Chattanooga, TN 347 Less than $10033 $100 to $149346 $150 to $199180 $200 to $249655 $250 to $299856 $300 to $349444 $350 to $399127 $400 to $449494 $450 to $499561 $500 to $5491,167 $550 to $599845 $600 to $649943 $650 to $699879 $700 to $749881 $750 to $7994,049 $800 to $8992,527 $900 to $9997,297 $1,000 to $1,2493,241 $1,250 to $1,4994,432 $1,500 to $1,999867 $2,000 to $2,49944 $3,000 to $3,4991,335 No cash rent
Percentage of workers working in this county: 90.6%Number of people working at home: 13,692 (14.6% of all workers )
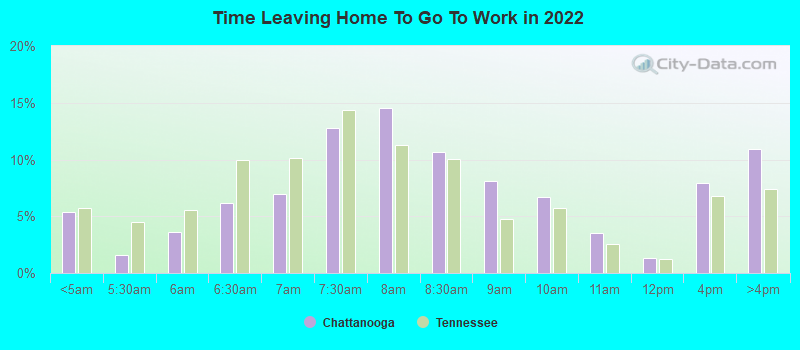
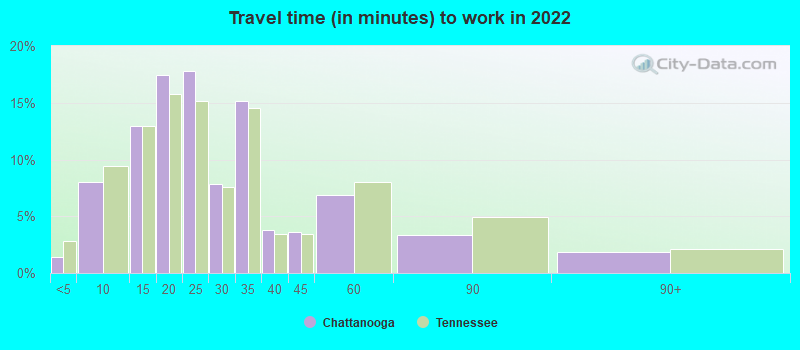
Travel time to work (commute)
Less than 5 minutes: 1,4995 to 9 minutes: 8,98910 to 14 minutes: 16,12715 to 19 minutes: 16,59920 to 24 minutes: 13,69725 to 29 minutes: 6,04630 to 34 minutes: 8,00835 to 39 minutes: 1,63040 to 44 minutes: 81545 to 59 minutes: 3,14060 to 89 minutes: 90290 or more minutes: 1,014
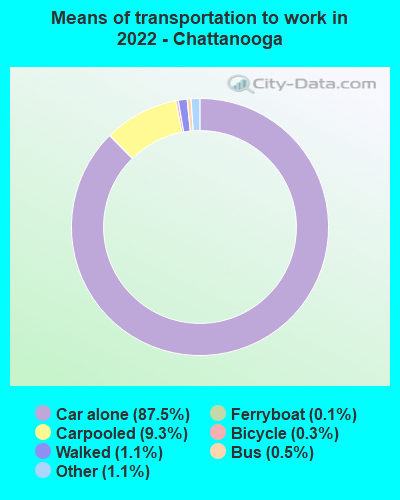
Means of transportation to work:
Drove a car alone: 146,909 (80.4%)Carpooled: 15,686 (8.6%)Bus : 792 (0.4%)Ferryboat: 200 (0.1%)Taxi: 1,811 (1.0%)Bicycle: 502 (0.3%)Walked: 1,902 (1.0%)Worked at home: 14,987 (8.2%)
Unemployment by race in 2022
Unemployment rate for White non-Hispanic residents 1.6% Males1.9% FemalesUnemployment rate for Black residents 8.1% Males3.7% FemalesUnemployment rate for Asian residents 6.3% Males2.5% FemalesUnemployment rate for other race residents 3.1% Males11.3% FemalesUnemployment rate for two or more race residents 1.7% Males2.9% FemalesUnemployment rate for Hispanic or Latino residents 3.1% Males4.3% Females
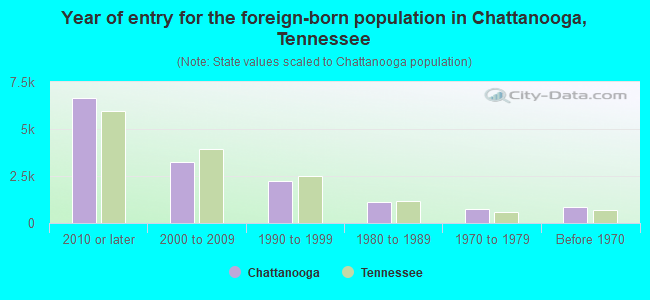
Year of entry for the foreign-born population in Chattanooga, Tennessee
6,624 2010 or later 3,256 2000 to 2009 2,231 1990 to 1999 1,138 1980 to 1989 722 1970 to 1979 861 Before 1970
First ancestries reported:
American: 12,135 (12.0%)
English: 10,477 (10.3%)
Irish: 5,273 (5.2%)
German: 4,724 (4.7%)
Scottish: 2,156 (2.1%)
European: 1,935 (1.9%)
Scotch-Irish: 1,366 (1.3%)
Italian: 1,174 (1.2%)
Haitian: 948 (0.9%)
African: 899 (0.9%)
Ethiopian: 622 (0.6%)
Dutch: 584 (0.6%)
Polish: 533 (0.5%)
British: 450 (0.4%)
French: 388 (0.4%)
Norwegian: 366 (0.4%)
Sudanese: 362 (0.4%)
Brazilian: 316 (0.3%)
Swedish: 290 (0.3%)
Welsh: 253 (0.2%)
Ukrainian: 229 (0.2%)
Jamaican: 194 (0.2%)
Northern European: 188 (0.2%)
Syrian: 165 (0.2%)
Arab: 156 (0.2%)
French Canadian: 148 (0.1%)
Eastern European: 125 (0.1%)
Canadian: 120 (0.1%)
Swiss: 115 (0.1%)
Greek: 111 (0.1%)
Lebanese: 106 (0.1%)
Iranian: 106 (0.1%)
Scandinavian: 92 (0.09%)
Egyptian: 83 (0.08%)
Lithuanian: 83 (0.08%)
Hungarian: 73 (0.07%)
Czech: 71 (0.07%)
Maltese: 61 (0.06%)
Russian: 60 (0.06%)
Romanian: 59 (0.06%)
Israeli: 53 (0.05%)
Portuguese: 51 (0.05%)
Yugoslavian: 47 (0.05%)
Australian: 43 (0.04%)
Guyanese: 41 (0.04%)
Armenian: 39 (0.04%)
Kenyan: 33 (0.03%)
Danish: 32 (0.03%)
Serbian: 30 (0.03%)
South African: 28 (0.03%)
Slovak: 25 (0.02%)
Bulgarian: 22 (0.02%)
Turkish: 18 (0.02%)
Palestinian: 15 (0.01%)
Liberian: 15 (0.01%)
Nigerian: 14 (0.01%)
West Indian: 14 (0.01%)
Pennsylvania German: 12 (0.01%)
Bahamian: 12 (0.01%)
Celtic: 12 (0.01%)
Belgian: 11 (0.01%)
Austrian: 10 (0.01%)
Slovene: 8 (0.01%)
Cajun: 7 (0.01%)
Croatian: 6 (0.01%)
Most common places of birth for foreign-born residents (%): Guatemala Chattanooga:
24.3% (3,378)Tennessee:
5.7% (21,286)
Mexico Chattanooga:
14.5% (2,012)Tennessee:
23.0% (86,435)
Haiti Chattanooga:
7.7% (1,072)Tennessee:
0.4% (1,598)
India Chattanooga:
6.0% (826)Tennessee:
6.1% (23,079)
Brazil Chattanooga:
4.1% (571)Tennessee:
0.8% (3,098)
Venezuela Chattanooga:
3.5% (482)Tennessee:
1.6% (5,936)
Vietnam Chattanooga:
3.2% (440)Tennessee:
2.4% (8,894)
Pakistan Chattanooga:
2.9% (397)Tennessee:
0.5% (2,053)
Honduras Chattanooga:
2.8% (388)Tennessee:
4.6% (17,433)
Korea Chattanooga:
2.3% (326)Tennessee:
2.3% (8,490)
Germany Chattanooga:
2.3% (322)Tennessee:
2.2% (8,261)
Philippines Chattanooga:
2.2% (310)Tennessee:
3.1% (11,640)
Canada Chattanooga:
2.2% (304)Tennessee:
2.7% (10,295)
Jamaica Chattanooga:
2.0% (276)Tennessee:
0.6% (2,405)
China, excluding Hong Kong and Taiwan Chattanooga:
1.6% (223)Tennessee:
3.3% (12,582)
Place of birth for U.S.-born residents:
This state: 100,210Other state: 69,544Northeast: 9,086Midwest: 16,705South: 37,978West: 5,775 79.8% of Chattanooga residents lived in the same house 1 years ago.
Out of people who lived in different houses, 37.8% lived in this county.
Out of people who lived in different counties, 22.4% lived in Tennessee.
Chattanooga:
79.8%State average:
87.0%
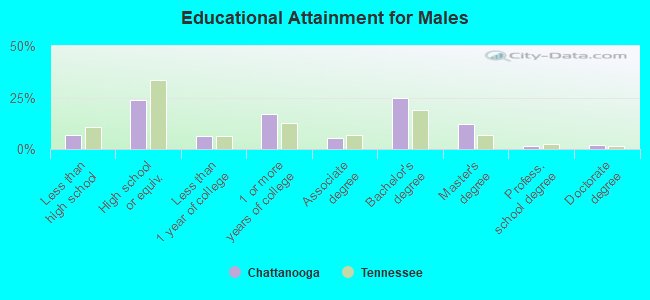
Education attainment for males 25 years and older:
No schooling: 653Nursery to 4th grade: 4205th and 6th grade: 4687th and 8th grade: 5859th grade: 11510th grade: 53111th grade: 76912th grade, no diploma: 695High school graduate (or equivalency): 14,505Less than 1 year of college: 3,854Some college more than 1 year, no degree: 10,351Associate degree: 3,113Bachelor's degree: 14,898Master's degree: 7,314Professional school degree: 899Doctorate degree: 1,218
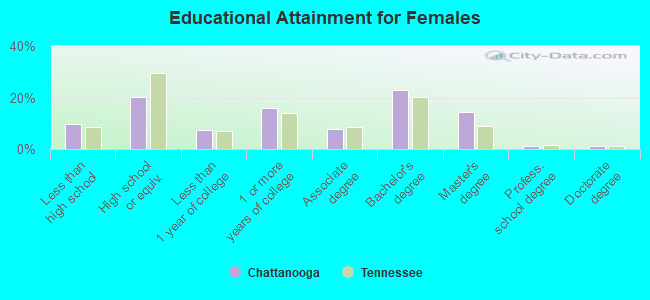
Education attainment for females 25 years and older:
No schooling: 828Nursery to 4th grade: 5585th and 6th grade: 5707th and 8th grade: 1,0369th grade: 43510th grade: 80111th grade: 1,44612th grade, no diploma: 686High school graduate (or equivalency): 13,398Less than 1 year of college: 4,906Some college more than 1 year, no degree: 10,513Associate degree: 5,162Bachelor's degree: 15,191Master's degree: 9,435Professional school degree: 788Doctorate degree: 788
Housing units in structures:
One, detached: 52,352One, attached: 4,078Two: 3,3023 or 4: 2,8795 to 9: 3,34710 to 19: 6,18820 to 49: 6,79250 or more: 6,901Mobile homes: 898Median worth of mobile homes: $9,999
Housing units lacking complete plumbing facilities in 2022: 1.4%Housing units lacking complete kitchen facilities in 2022: 2.5%House/condo owner moved in on average 10 years ago
Renter moved in on average 1 years ago
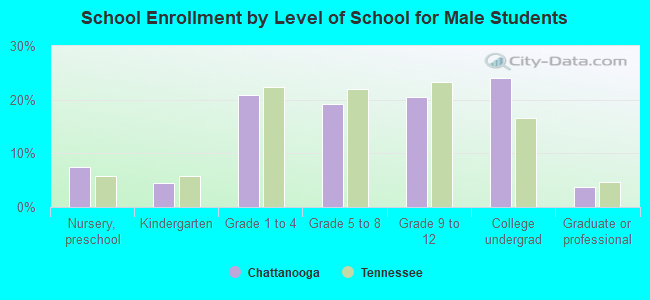
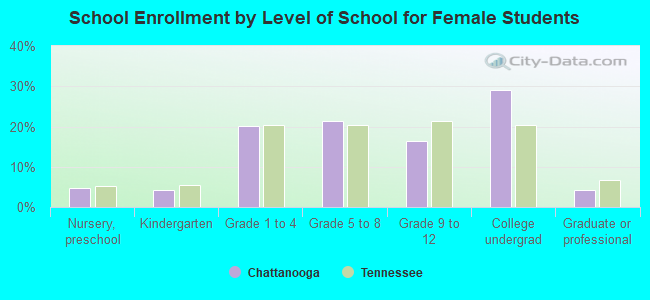
Private vs. public school enrollment:
Students in private schools in grades 1 to 8 (elementary and middle school): 2,076 Here:
12.4%Tennessee:
15.0%
Students in private schools in grades 9 to 12 (high school): 1,893 Here:
25.1%Tennessee:
16.2%
Students in private undergraduate colleges: 1,561 Here:
14.3%Tennessee:
23.5%