Housing density: 514 houses/condos per square mile
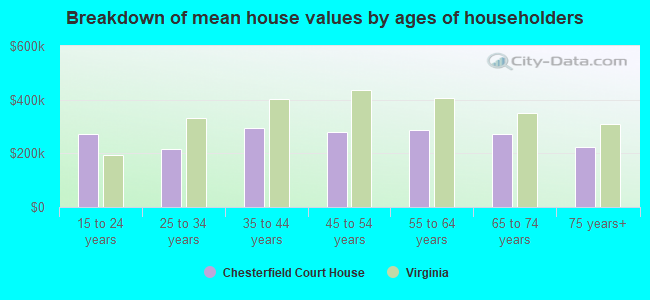
Median price asked for vacant for-sale houses and condos in 2022 in this county: $242,824.
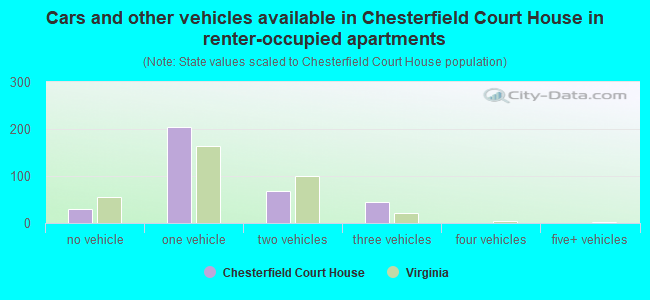
Median contract rent in 2022: $1,455 (lower quartile is $1,208, upper quartile is $1,524)
Median gross rent in Chesterfield Court House, VA in 2022: $1,624
Housing units in Chesterfield Court House with a mortgage: 682 (105 second mortgage, 77 home equity loan, 7 both second mortgage and home equity loan) Houses without a mortgage: 71
Compare current foreclosures near Chesterfield Court House, VA:
In family households: 274,982 (60,977 male householders, 25,260 female householders)
65,861 spouses, 98,764 children (91,862 natural, 2,109 adopted, 4,793 stepchildren), 6,161 grandchildren, 2,572 brothers or sisters, 2,841 parents, foster children, 3,889 other relatives, 6,711 non-relatives
In nonfamily households: 36,603 (12,580 male householders (9,490 living alone)), 16,863 female householders (14,401 living alone)), 7,160 nonrelatives
In group quarters: 4,651 (1,658 institutionalized population)
54,023 married couples with children.
13,595 single-parent households (2,821 men, 10,774 women).
90.6% of residents of Chesterfield Court House speak English at home.
5.6% of residents speak Spanish at home (57% speak English very well, 18% speak English well, 25% speak English not well).
2.0% of residents speak other Indo-European language at home (30% speak English very well, 17% speak English well, 53% speak English not well).
0.8% of residents speak Asian or Pacific Island language at home (69% speak English well, 31% speak English not well).
1.1% of residents speak other language at home (35% speak English very well, 38% speak English well, 27% speak English not well).
Foreign born population: 473 (9.1%)
(30.2% of them are naturalized citizens)
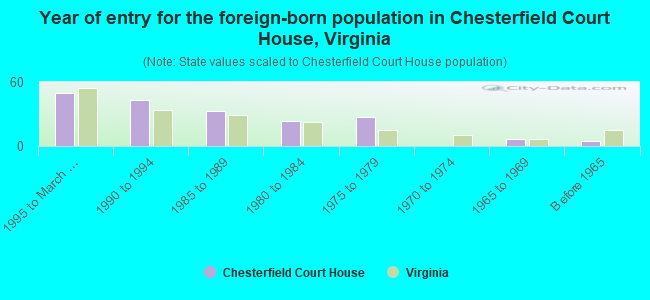
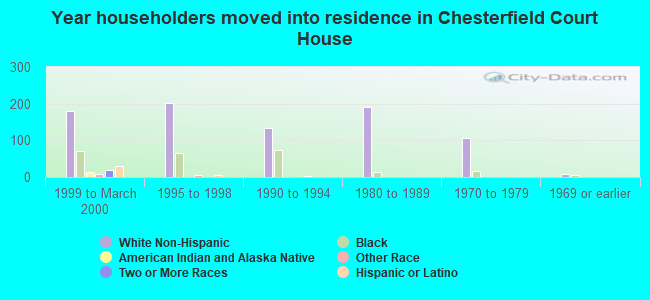
Year of entry for the foreign-born population in Chesterfield Court House, Virginia
501995 to March 2000
431990 to 1994
331985 to 1989
231980 to 1984
271975 to 1979
01970 to 1974
71965 to 1969
5Before 1965
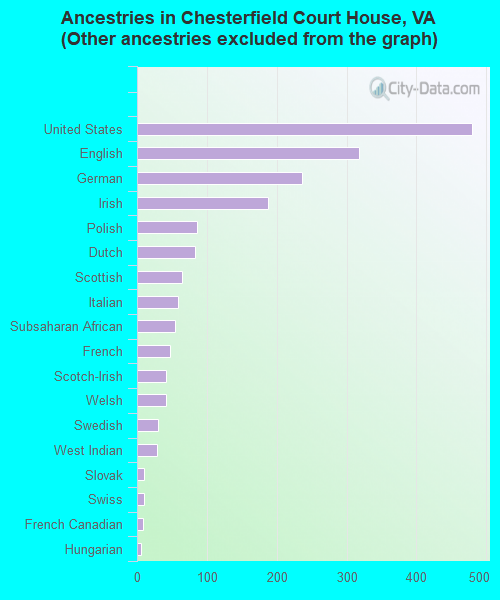
First ancestries reported:
Other: 1,269 (41.4%)
United States: 480 (15.7%)
English: 318 (10.4%)
German: 236 (7.7%)
Irish: 188 (6.1%)
Polish: 86 (2.8%)
Dutch: 83 (2.7%)
Scottish: 64 (2.1%)
Italian: 59 (1.9%)
Subsaharan African: 54 (1.8%)
French: 47 (1.5%)
Scotch-Irish: 42 (1.4%)
Welsh: 42 (1.4%)
Swedish: 30 (1.0%)
West Indian: 29 (0.9%)
Slovak: 10 (0.3%)
Swiss: 10 (0.3%)
French Canadian: 9 (0.3%)
Hungarian: 6 (0.2%)
Most common places of birth for foreign-born residents (%):
El Salvador
Chesterfield Court House:
22.3% (42)
Virginia:
9.6% (54,704)
Ghana
Chesterfield Court House:
12.8% (24)
Virginia:
1.0% (5,956)
Korea
Chesterfield Court House:
10.1% (19)
Virginia:
6.5% (37,036)
Trinidad and Tobago
Chesterfield Court House:
10.1% (19)
Virginia:
0.5% (3,135)
Guatemala
Chesterfield Court House:
10.1% (19)
Virginia:
2.1% (11,799)
Cuba
Chesterfield Court House:
7.4% (14)
Virginia:
0.7% (3,854)
Micronesia
Chesterfield Court House:
5.3% (10)
Virginia:
0.0% (181)
Mexico
Chesterfield Court House:
5.3% (10)
Virginia:
5.7% (32,598)
United Kingdom
Chesterfield Court House:
3.7% (7)
Virginia:
3.5% (19,911)
India
Chesterfield Court House:
3.7% (7)
Virginia:
5.4% (30,611)
Canada
Chesterfield Court House:
3.7% (7)
Virginia:
2.2% (12,732)
Other Caribbean
Chesterfield Court House:
2.7% (5)
Virginia:
0.5% (2,860)
Other Central America
Chesterfield Court House:
2.7% (5)
Virginia:
0.1% (372)
Place of birth for U.S.-born residents:
This state: 2,052
Other state: 1,261
Northeast: 410
Midwest: 197
South: 631
West: 23
50% of Chesterfield Court House residents lived in the same house 5 years ago. Out of people who lived in different houses, 41% lived in this county. Out of people who lived in different counties, 63% lived in Virginia.
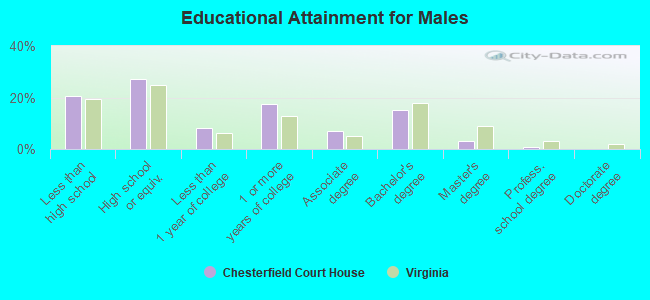
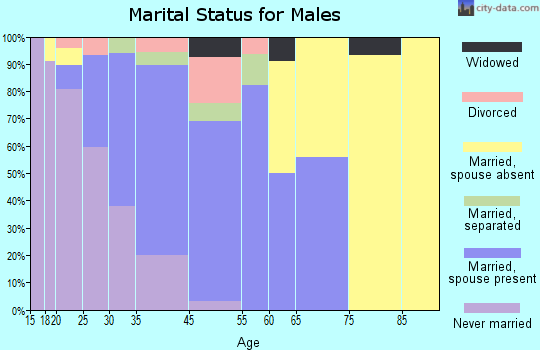
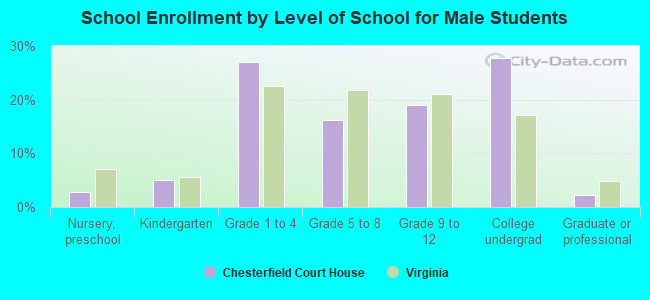
Education attainment for males 25 years and older:
No schooling: 0
Nursery to 4th grade: 0
5th and 6th grade: 16
7th and 8th grade: 110
9th grade: 20
10th grade: 22
11th grade: 6
12th grade, no diploma: 48
High school graduate (or equivalency): 293
Less than 1 year of college: 87
Some college more than 1 year, no degree: 188
Associate degree: 77
Bachelor's degree: 162
Master's degree: 35
Professional school degree: 9
Doctorate degree: 0
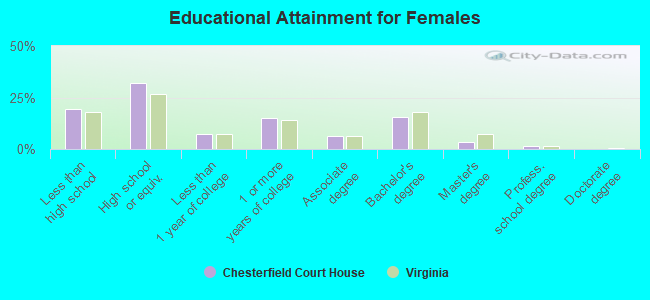
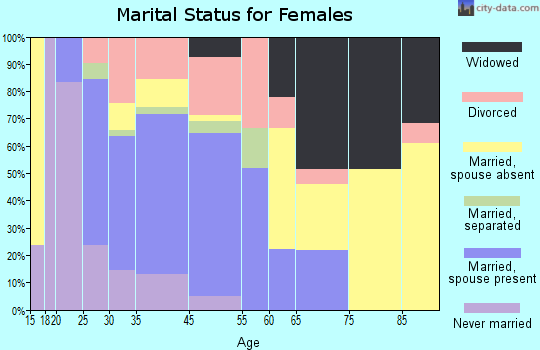
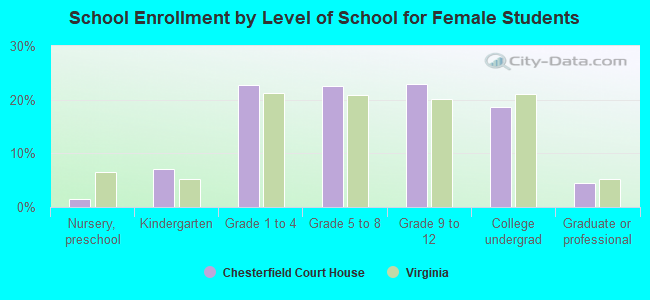
Education attainment for females 25 years and older: