Clarksville, PA (Pennsylvania) Houses and Residents
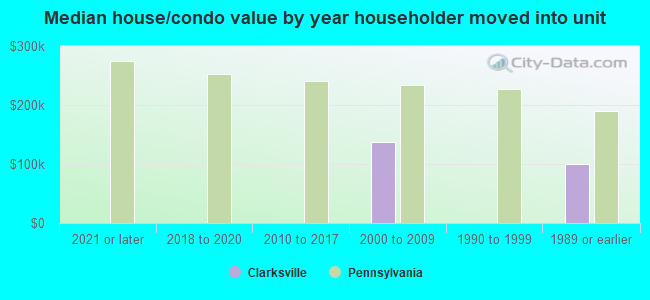
| Clarksville: | $109,726 |
| Pennsylvania: | $245,500 |
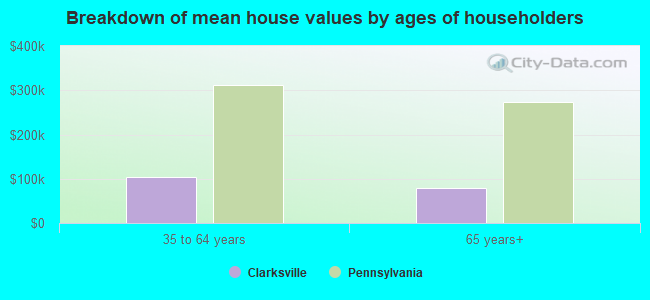
Mean price in 2022:
Detached houses: $137,764
Here: $137,764 State: $317,202
Total population: 230 (Urban population: 0, Rural population: 215 (all nonfarm))
Houses: 71 (63 occupied: 62 owner occupied, 2 renter occupied)
| % of renters here: | 3% |
| State: | 31% |
Housing density: 724 houses/condos per square mile
Median price asked for vacant for-sale houses and condos in 2022 in this county: $92,466.
Median gross rent in Clarksville, PA in 2022: $-670,270,269
Housing units in Clarksville with a mortgage: 35 (0 second mortgage, 0 home equity loan, 0 both second mortgage and home equity loan)
Houses without a mortgage: 9
Median household income for houses/condos with a mortgage: $82,394
Median household income for apartments without a mortgage: $85,316
Median monthly housing costs: $-654,342,722
Compare current foreclosures near Clarksville, PA:
| Photo | Address | Area | Beds / Baths | Price | Details |
|---|---|---|---|---|---|

|
#1
N Eighty Eight Rd
Clarksville, PA 15322
|
1,691 sq. feet
|
1 baths 4 beds |
show details | |

|
#2
Casey Drive
New Salem, PA 15468
|
- sq. feet
|
1 baths 1 beds |
$244,900
|
show details |

|
#3
Blind Ln
Belle Vernon, PA 15012
|
1,548 sq. feet
|
2 baths 3 beds |
$67,500
|
show details |

|
#4
Coal St
Dunlevy, PA 15432
|
1,740 sq. feet
|
1 baths 3 beds |
$125,500
|
show details |

|
#5
Greene St
Clarksville, PA 15322
|
- sq. feet
|
- baths - beds |
show details | |

|
#6
Stevenson St
Ronco, PA 15476
|
- sq. feet
|
2 baths 4 beds |
$16,500
|
show details |

|
#7
Brothers Rd
Charleroi, PA 15022
|
- sq. feet
|
- baths - beds |
$29,900
|
show details |

|
#8
Kennedy Street
Republic, PA 15475
|
2,072 sq. feet
|
1 baths 2 beds |
show details | |

|
#9
State St
Charleroi, PA 15022
|
1,976 sq. feet
|
2 baths 3 beds |
show details | |

|
#10
4th St
Monongahela, PA 15063
|
1,120 sq. feet
|
1 baths 3 beds |
show details |
| Photo | Address | Area | Beds / Baths | Price | Details |
|---|---|---|---|---|---|

|
#11
Walnut Hill Rd
Uniontown, PA 15401
|
1,014 sq. feet
|
1 baths 2 beds |
show details | |

|
#12
State Rd
Monessen, PA 15062
|
1,240 sq. feet
|
1 baths 3 beds |
show details | |

|
#13
Grant Ave
Monessen, PA 15062
|
1,159 sq. feet
|
1 baths 2 beds |
show details | |

|
#14
New Geneva Rd
Point Marion, PA 15474
|
1,566 sq. feet
|
1 baths 3 beds |
show details | |

|
#15
Single St
Carmichaels, PA 15320
|
1,178 sq. feet
|
1 baths 3 beds |
show details | |

|
#16
Sheppard Ave
Charleroi, PA 15022
|
1,110 sq. feet
|
1 baths 2 beds |
show details | |

|
#17
Newton Ave
Fredericktown, PA 15333
|
1,739 sq. feet
|
2 baths 3 beds |
show details | |

|
#18
Iola Ave
Washington, PA 15301
|
820 sq. feet
|
1 baths 3 beds |
show details | |

|
#19
High St
Brownsville, PA 15417
|
1,500 sq. feet
|
1 baths 3 beds |
show details | |

|
#20
Fayette City Rd
Fayette City, PA 15438
|
1,164 sq. feet
|
1 baths 3 beds |
show details |
| Photo | Address | Area | Beds / Baths | Price | Details |
|---|---|---|---|---|---|

|
#21
Bethlehem Street
Fredericktown, PA 15333
|
- sq. feet
|
2 baths 3 beds |
show details | |

|
#22
Wall St
Republic, PA 15475
|
868 sq. feet
|
1 baths 2 beds |
show details | |

|
#23
Columbus Dr
Monessen, PA 15062
|
925 sq. feet
|
1 baths 3 beds |
show details | |

|
#24
1st St
Uniontown, PA 15401
|
1,850 sq. feet
|
2 baths 4 beds |
show details | |

|
#25
Corwin St
Roscoe, PA 15477
|
- sq. feet
|
- baths - beds |
$34,900
|
show details |

|
#26
Barneys Run Rd
Fredericktown, PA 15333
|
- sq. feet
|
1 baths 3 beds |
show details | |

|
#27
Old Mcclellandtown Rd
Mc Clellandtown, PA 15458
|
- sq. feet
|
1 baths 3 beds |
show details | |

|
#28
Grant St
New Salem, PA 15468
|
1,488 sq. feet
|
1 baths 3 beds |
show details | |

|
#29
Grant Ave
New Salem, PA 15468
|
1,178 sq. feet
|
1 baths 2 beds |
show details | |

|
#30
E Main St
New Salem, PA 15468
|
1,628 sq. feet
|
1 baths 2 beds |
show details |
| Photo | Address | Area | Beds / Baths | Price | Details |
|---|---|---|---|---|---|

|
#31
Hillcrest Dr
California, PA 15419
|
1,677 sq. feet
|
1 baths 3 beds |
show details | |

|
#32
Ridgewood Dr
Fredericktown, PA 15333
|
2,077 sq. feet
|
2 baths 3 beds |
show details | |

|
#33
Circle St
Brownsville, PA 15417
|
1,450 sq. feet
|
2 baths 3 beds |
show details | |

|
#34
3rd Street
Isabella, PA 15447
|
854 sq. feet
|
1 baths 2 beds |
show details | |

|
#35
Watkins Ave
Donora, PA 15033
|
1,680 sq. feet
|
1 baths 3 beds |
show details | |

|
#36
Jefferson Ave
Masontown, PA 15461
|
1,188 sq. feet
|
1 baths 3 beds |
show details | |

|
#37
Hill St
New Salem, PA 15468
|
2,100 sq. feet
|
2 baths 4 beds |
show details | |

|
#38
Old Mcclellandtown Rd
Mc Clellandtown, PA 15458
|
3,480 sq. feet
|
1 baths 3 beds |
show details | |

|
#39
Colvin Rd
Charleroi, PA 15022
|
1,120 sq. feet
|
1 baths 2 beds |
show details | |

|
#40
Scott St
Charleroi, PA 15022
|
924 sq. feet
|
1 baths 2 beds |
show details |
| Photo | Address | Area | Beds / Baths | Price | Details |
|---|---|---|---|---|---|

|
#41
Gilmore Ave
Masontown, PA 15461
|
1,294 sq. feet
|
2 baths 3 beds |
show details | |

|
#42
Scott St
Charleroi, PA 15022
|
924 sq. feet
|
1 baths 2 beds |
show details | |

|
#43
River Ave
Masontown, PA 15461
|
900 sq. feet
|
1 baths 2 beds |
show details | |

|
#44
Grandview Way
Charleroi, PA 15022
|
1,560 sq. feet
|
1 baths 3 beds |
show details | |

|
#45
Somerset Dr
Eighty Four, PA 15330
|
1,428 sq. feet
|
1 baths 3 beds |
show details | |

|
#46
Reservoir Ave
Charleroi, PA 15022
|
2,046 sq. feet
|
2 baths 4 beds |
show details | |

|
#47
Chess St
Monongahela, PA 15063
|
1,840 sq. feet
|
2 baths 4 beds |
show details | |

|
#48
Messmore Rd
Mc Clellandtown, PA 15458
|
1,179 sq. feet
|
1 baths 2 beds |
show details | |

|
#49
S Ross St
Masontown, PA 15461
|
1,524 sq. feet
|
2 baths 5 beds |
show details | |

|
Check over 1 million property listings on Foreclosure.com!
|
browse all offers | |||

Latest news about housing in Clarksville, PA collected exclusively by city-data.com from local newspapers, TV, and radio stations


Household type by relationship:
Households: 207- Male householders: 20 (0 living alone), Female householders: 41 (5 living alone)
14 spouses (14 opposite-sex spouses), 0 unmarried partners, (0 opposite-sex unmarried partners), 81 children (27 natural, 53 adopted, 0 stepchildren), 1 grandchildren, 6 brothers or sisters, 0 parents, 0 foster children, 3 other relatives, 0 non-relatives
- In group quarters: 33
Size of family households: 24 2-persons, 11 3-persons, 20 4-persons.
Size of nonfamily households: 6 1-person.
0 married couples with children.
55 single-parent households (0 men, 55 women).
92.7% of residents of Clarksville speak English at home.
5.8% of residents speak other Indo-European language at home (100% speak English very well).
| Here: | 6.3 |
| State: | 6.8 |
| Here: | -666666666.0 |
| State: | 4.3 |
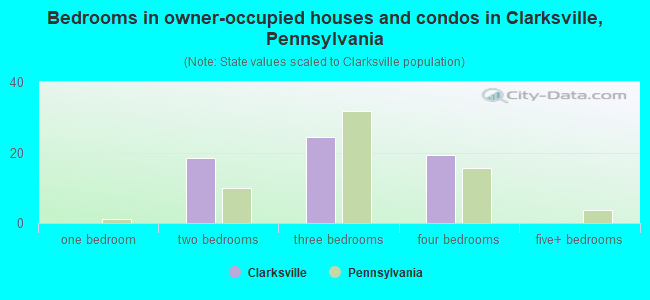
- Bedrooms in owner-occupied houses and condos in Clarksville, Pennsylvania
- 0no bedroom
- 01 bedroom
- 182 bedrooms
- 243 bedrooms
- 194 bedrooms
- 05+ bedrooms
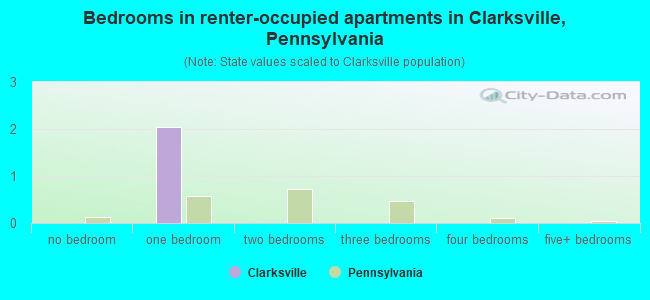
- Bedrooms in renter-occupied apartments in Clarksville, Pennsylvania
- 0no bedroom
- 21 bedroom
- 02 bedrooms
- 03 bedrooms
- 04 bedrooms
- 05+ bedrooms
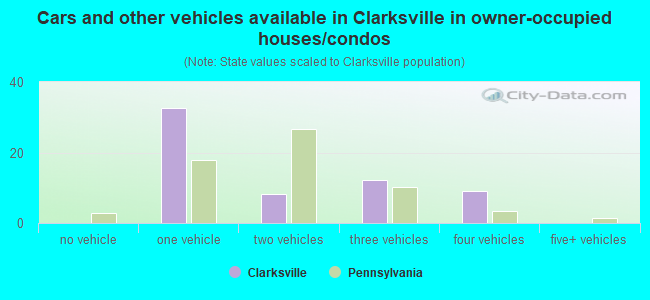
- Cars and other vehicles available in Clarksville in owner-occupied houses/condos
- 0no vehicle
- 331 vehicle
- 82 vehicles
- 123 vehicles
- 94 vehicles
- 05+ vehicles
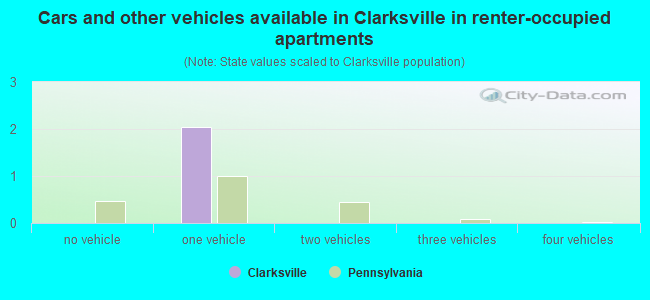
- Cars and other vehicles available in Clarksville in renter-occupied apartments
- 0no vehicle
- 21 vehicle
- 02 vehicles
- 03 vehicles
- 04 vehicles
- 05+ vehicles
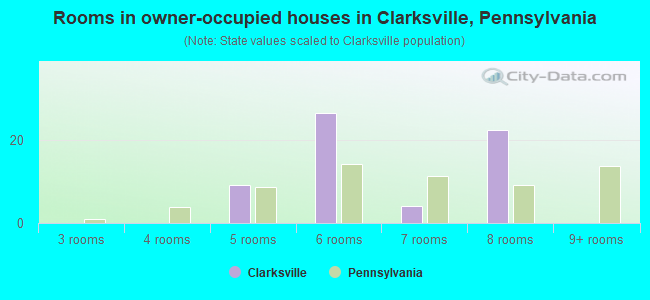
- Rooms in owner-occupied houses in Clarksville, Pennsylvania
- 01 room
- 02 rooms
- 03 rooms
- 04 rooms
- 95 rooms
- 276 rooms
- 47 rooms
- 228 rooms
- 09+ rooms
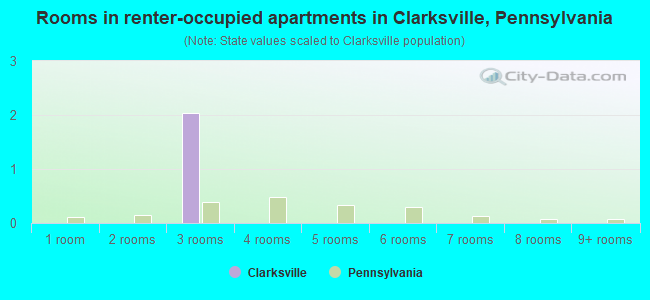
- Rooms in renter-occupied apartments in Clarksville, Pennsylvania
- 01 room
- 02 rooms
- 23 rooms
- 04 rooms
- 05 rooms
- 06 rooms
- 07 rooms
- 08 rooms
- 09+ rooms
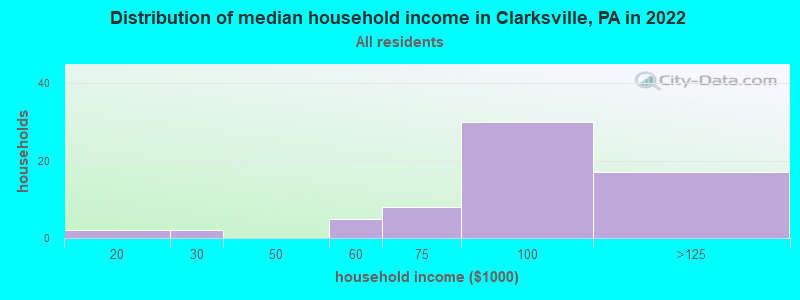
Clarksville, PA household income distribution

- 2$10,000 to $19,999
- 2$20,000 to $29,999
- 5$50,000 to $59,999
- 8$60,000 to $74,999
- 30$75,000 to $99,999
- 17$100,000 to $124,999
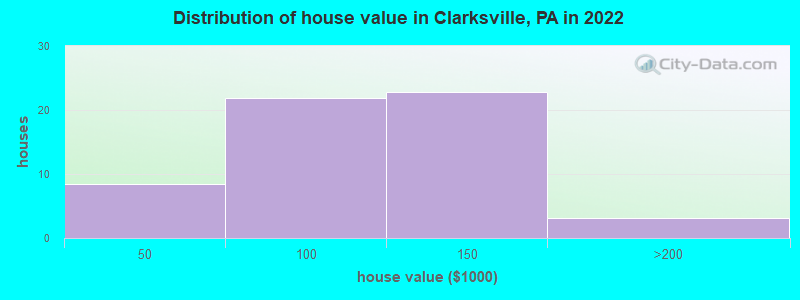
Home value of owner - occupied houses in 2022 in Clarksville, PA
-
- 6$30,000 to $34,999
- 1$40,000 to $49,999
- 4$50,000 to $59,999
- 12$60,000 to $69,999
- 4$90,000 to $99,999
- 9$100,000 to $124,999
- 12$125,000 to $149,999
- 3$150,000 to $174,999
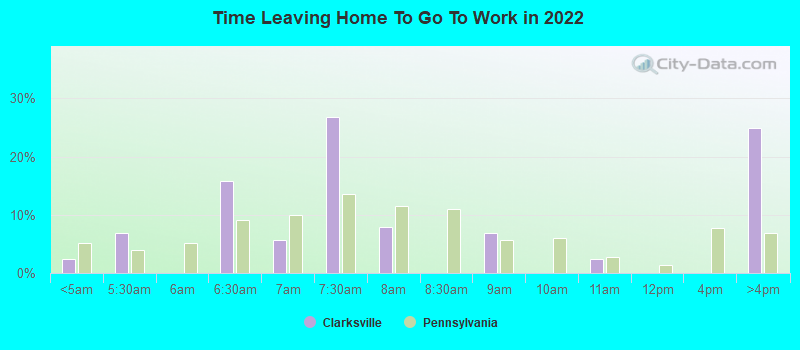
Percentage of workers working in this county: 50.6%
Number of people working at home: 0 (0.0% of all workers)
Travel time to work (commute)
- Less than 5 minutes: 4
- 5 to 9 minutes: 0
- 10 to 14 minutes: 10
- 15 to 19 minutes: 0
- 20 to 24 minutes: 29
- 25 to 29 minutes: 3
- 30 to 34 minutes: 4
- 35 to 39 minutes: 1
- 40 to 44 minutes: 13
- 45 to 59 minutes: 15
- 60 to 89 minutes: 0
- 90 or more minutes: 0
Means of transportation to work:
- Drove a car alone: 56 (84.8%)
- Carpooled: 6 (9.1%)
- Walked: 4 (6.1%)
- Unemployment by race in 2022
- Unemployment rate for White non-Hispanic residents
- 29.4%Males
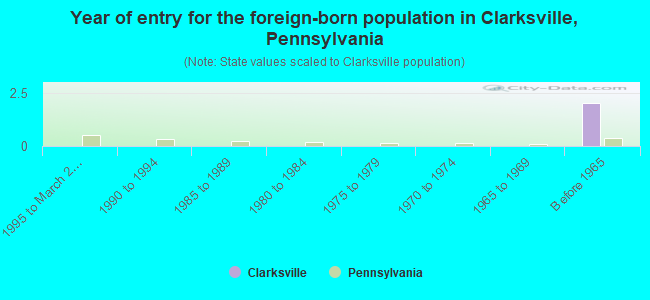
- Year of entry for the foreign-born population in Clarksville, Pennsylvania
- 01995 to March 2000
- 01990 to 1994
- 01985 to 1989
- 01980 to 1984
- 01975 to 1979
- 01970 to 1974
- 01965 to 1969
- 2Before 1965
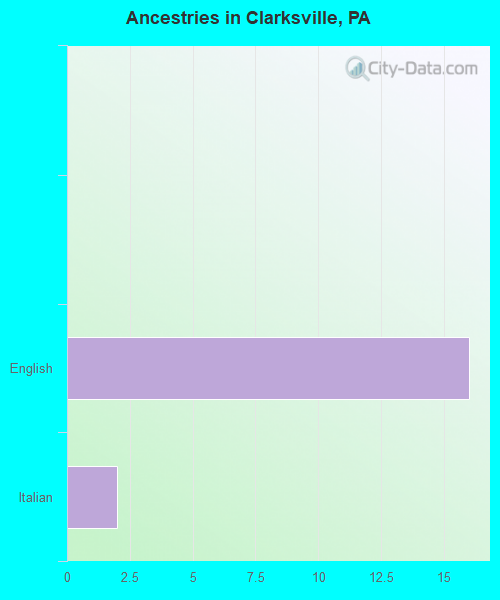
First ancestries reported:
- English: 16 (73.4%)
- Italian: 2 (9.2%)
Most common places of birth for foreign-born residents (%):
| Clarksville: | 100.0% (2) |
| Pennsylvania: | 6.0% (30,559) |
Place of birth for U.S.-born residents:
- This state: 117
- Other state: 91
- Northeast: 0
- Midwest: 12
- South: 78
- West: 0
89.4% of Clarksville residents lived in the same house 1 years ago.
Out of people who lived in different houses, 21.4% lived in this county.
Out of people who lived in different counties, 100.0% lived in Pennsylvania.
| Clarksville: | 89.4% |
| State average: | 89.3% |
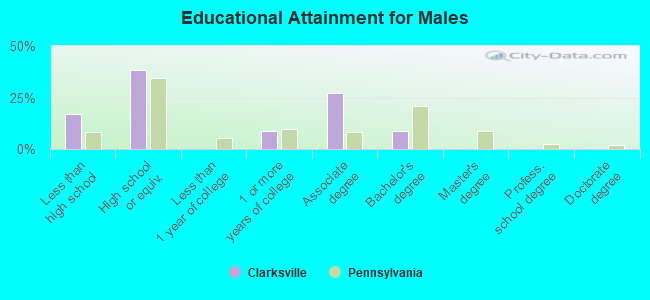
Education attainment for males 25 years and older:
- No schooling: 6
- Nursery to 4th grade: 0
- 5th and 6th grade: 0
- 7th and 8th grade: 0
- 9th grade: 0
- 10th grade: 0
- 11th grade: 0
- 12th grade, no diploma: 6
- High school graduate (or equivalency): 27
- Less than 1 year of college: 0
- Some college more than 1 year, no degree: 6
- Associate degree: 19
- Bachelor's degree: 6
- Master's degree: 0
- Professional school degree: 0
- Doctorate degree: 0
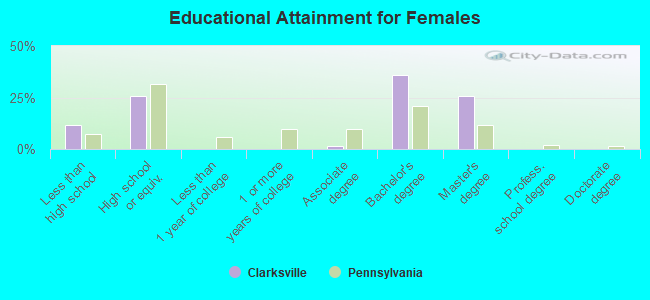
Education attainment for females 25 years and older:
- No schooling: 8
- Nursery to 4th grade: 0
- 5th and 6th grade: 0
- 7th and 8th grade: 0
- 9th grade: 0
- 10th grade: 0
- 11th grade: 0
- 12th grade, no diploma: 0
- High school graduate (or equivalency): 18
- Less than 1 year of college: 0
- Some college more than 1 year, no degree: 0
- Associate degree: 1
- Bachelor's degree: 25
- Master's degree: 18
- Professional school degree: 0
- Doctorate degree: 0


Housing units in structures:
- One, detached: 63
- One, attached: 6
- Two: 2
Housing units lacking complete kitchen facilities in 2022: 5.6%
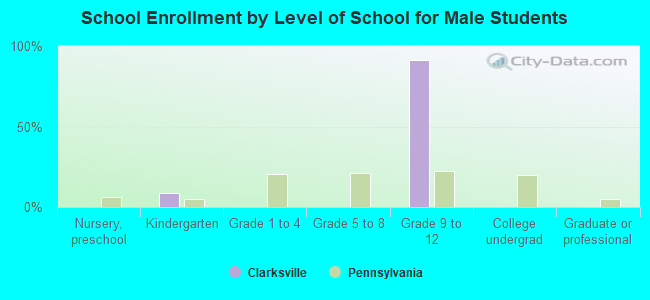
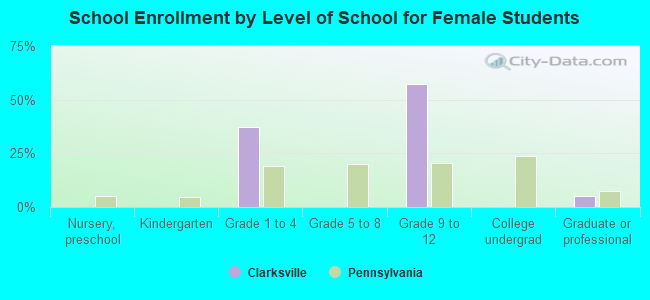
Private vs. public school enrollment:
| Here: | 0.0% |
| Pennsylvania: | 15.7% |
| Here: | 0.0% |
| Pennsylvania: | 13.4% |