Colonia, NJ (New Jersey) Houses and Residents
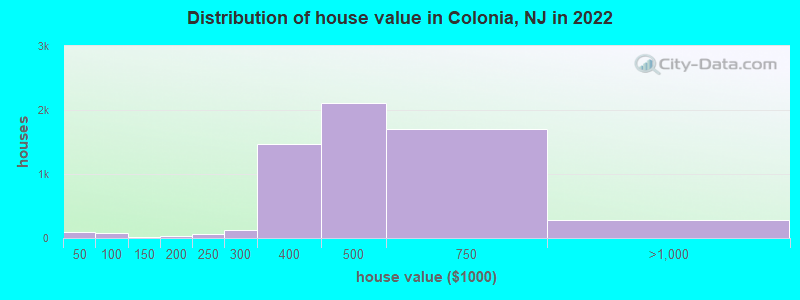
Estimated median house or condo value in 2022: $469,803 (it was $181,400 in 2000 )
Colonia:
$469,803New Jersey:
$428,900
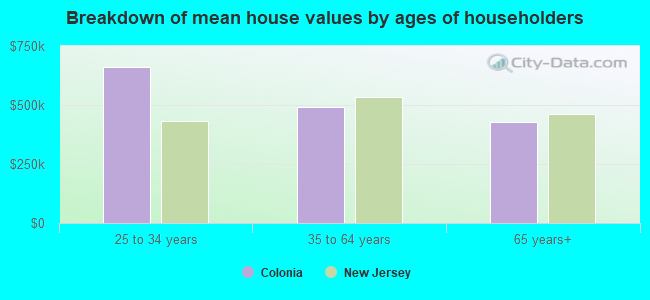
Lower value quartile - upper value quartile: $385,238 - $573,980Mean price in 2022: Detached houses: $457,017 Here:
$457,017State:
$537,591
Townhouses or other attached units: $623,324 Here:
$623,324State:
$381,113
In 2-unit structures: $367,310 Here:
$367,310State:
$444,476
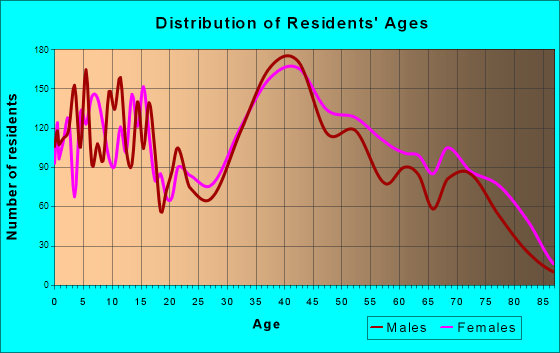
Total population: 17,795 (Urban population: 17,756, Rural population: 0)
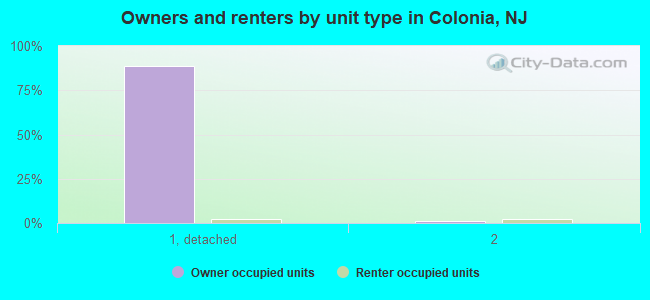
Houses: 6,395 (6,269 occupied: 5,649 owner occupied, 672 renter occupied )
% of renters here:
11%State:
35%
Housing density: 1,649 houses/condos per square mile
Median price asked for vacant for-sale houses and condos in 2022: $1,027,737.
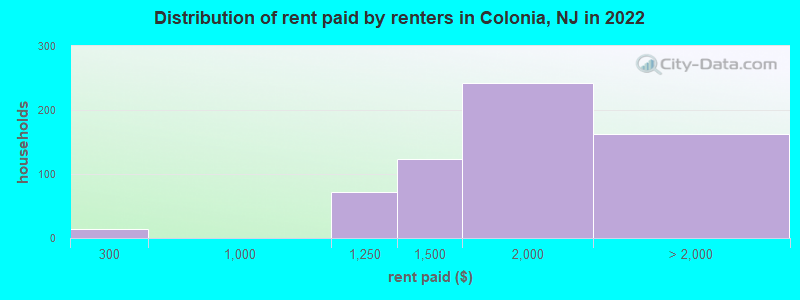
Median contract rent in 2022: $1,685 (lower quartile is $1,313, upper quartile is over $2,000)
Median rent asked for vacant for-rent units in 2022: $1,582
Median gross rent in Colonia, NJ in 2022: $1,761
Housing units in Colonia with a mortgage: 3,487 (530 second mortgage, 7 home equity loan, 520 both second mortgage and home equity loan )Houses without a mortgage: 223
Median household income for houses/condos with a mortgage: $156,918
Median household income for apartments without a mortgage: $87,351
Median monthly housing costs: $2,076
Data:
Median house or condo value ($)
Median house or condo value ($ change since 2000)
Median house or condo value ($) - White
Median house or condo value ($) - Black or African American
Median house or condo value ($) - Asian
Median house or condo value ($) - Hispanic or Latino
Median house or condo value ($) - American Indian and Alaska Native
Median house or condo value ($) - Multirace
Median house or condo value ($) - Other Race
Median price asked for mobile homes ($)
Household density (households per square mile)
Mean house or condo value by units in structure - 1, detached ($)
Mean house or condo value by units in structure - 1, attached ($)
Mean house or condo value by units in structure - 2 ($)
Mean house or condo value by units in structure by units in structure - 3 or 4 ($)
Mean house or condo value by units in structure - 5 or more ($)
Mean house or condo value by units in structure - Boat, RV, van, etc. ($)
Mean house or condo value by units in structure - Mobile home ($)
Median contract rent ($)
Median contract rent - Lower quartile ($)
Median contract rent - Upper quartile ($)
Median gross rent ($)
Urban houses (%)
Rural houses (%)
Houses occupied (%)
Houses occupied (% change since 2000)
Houses owner occupied (%)
Houses owner occupied (% change since 2000)
Houses renter occupied (%)
Houses renter occupied (% change since 2000)
Vacant housing units - For rent (%)
Vacant housing units - For rent (% change since 2000)
Vacant housing units - For sale only (%)
Vacant housing units - For sale only (% change since 2000)
Vacant housing units - Rented or sold, not occupied (%)
Vacant housing units - Rented or sold, not occupied (% change since 2000)
Vacant housing units - For seasonal, recreational, or occasional use (%)
Vacant housing units - For seasonal, recreational, or occasional use (% change since 2000)
Vacant housing units - For migrant workers (%)
Vacant housing units - For migrant workers (% change since 2000)
Vacant housing units - Other vacant (%)
Vacant housing units - Other vacant (% change since 2000)
Median monthly housing costs ($)
Median household income for houses/condos with a mortgage ($)
Median household income for houses/condos without a mortgage ($)
Median household income ($)
Median household income ($) - White
Median household income ($) - Black or African American
Median household income ($) - Asian
Median household income ($) - Hispanic or Latino
Median household income ($) - American Indian and Alaska Native
Median household income ($) - Multirace
Median household income ($) - Other Race
Mortgage status - with mortgage (%)
Mortgage status - with second mortgage (%)
Mortgage status - with home equity loan (%)
Mortgage status - with both second mortgage and home equity loan (%)
Mortgage status - without a mortgage (%)
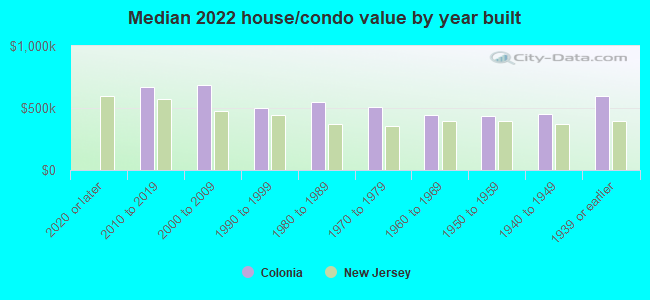
Median year house/condo built
Median year apartment built
Household type by relationship - Male householder living alone (%)
Household type by relationship - Male householder not living alone (%)
Household type by relationship - Female householder living alone (%)
Household type by relationship - Female householder not living alone (%)
Household type by relationship - Opposite-Sex spouse (%)
Household type by relationship - Same-Sex spouse (%)
Household type by relationship - Opposite-Sex unmarried partner (%)
Household type by relationship - Same-Sex unmarried partner (%)
Household type by relationship - In group quarters (%)
Size of family households - 2-person household (%)
Size of family households - 3-person household (%)
Size of family households - 4-person household (%)
Size of family households - 5-person household (%)
Size of family households - 6-person household (%)
Size of family households - 7-or-more-person household (%)
Size of nonfamily households - 1-person household (%)
Size of nonfamily households - 2-person household (%)
Size of nonfamily households - 3-person household (%)
Size of nonfamily households - 4-person household (%)
Size of nonfamily households - 5-person household (%)
Size of nonfamily households - 6-person household (%)
Size of nonfamily households - 7-or-moreperson household (%)
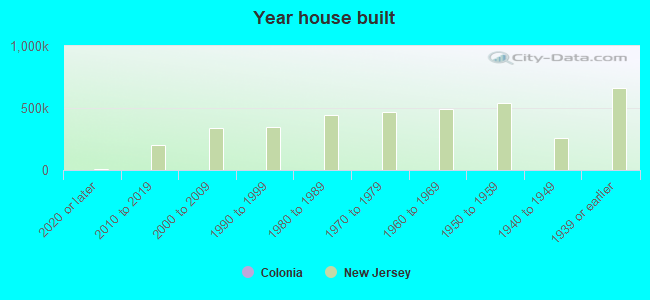
Year house built - Built 2010 or later (%)
Year house built - Built 2000 to 2009 (%)
Year house built - Built 1990 to 1999 (%)
Year house built - Built 1980 to 1989 (%)
Year house built - Built 1970 to 1979 (%)
Year house built - Built 1960 to 1969 (%)
Year house built - Built 1950 to 1959 (%)
Year house built - Built 1940 to 1949 (%)
Year house built - Built 1939 or earlier (%)
Median number of rooms in houses and condos
Median number of rooms in apartments
Median number of bedrooms in owner occupied houses
Mean number of bedrooms in owner occupied houses
Median number of bedrooms in renter occupied houses
Mean number of bedrooms in renter occupied houses
Median number of vehichles in owner occupied houses
Mean number of vehichles in owner occupied houses
Median number of vehichles in renter occupied houses
Mean number of vehichles in renter occupied houses
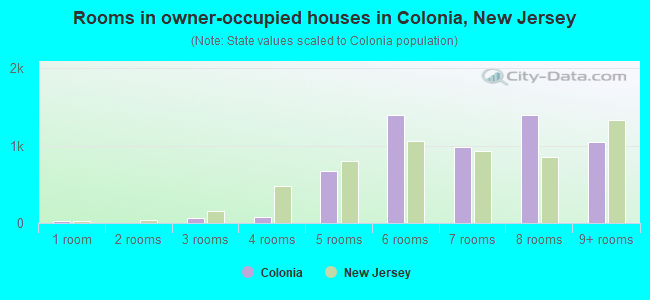
Rooms in owner-occupied houses - 1 room (%)
Rooms in owner-occupied houses - 2 rooms (%)
Rooms in owner-occupied houses - 3 rooms (%)
Rooms in owner-occupied houses - 4 rooms (%)
Rooms in owner-occupied houses - 5 rooms (%)
Rooms in owner-occupied houses - 6 rooms (%)
Rooms in owner-occupied houses - 7 rooms (%)
Rooms in owner-occupied houses - 8 rooms (%)
Rooms in owner-occupied houses - 9+ rooms (%)
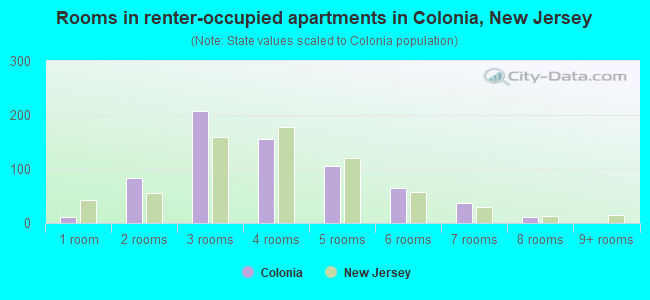
Rooms in renter-occupied houses - 1 room (%)
Rooms in renter-occupied houses - 2 rooms (%)
Rooms in renter-occupied houses - 3 rooms (%)
Rooms in renter-occupied houses - 4 rooms (%)
Rooms in renter-occupied houses - 5 rooms (%)
Rooms in renter-occupied houses - 6 rooms (%)
Rooms in renter-occupied houses - 7 rooms (%)
Rooms in renter-occupied houses - 8 rooms (%)
Rooms in renter-occupied houses - 9+ rooms (%)
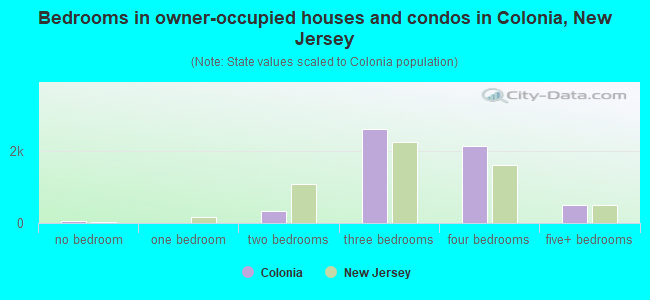
Bedrooms in owner-occupied houses - no bedrooms (%)
Bedrooms in owner-occupied houses - 1 bedroom (%)
Bedrooms in owner-occupied houses - 2 bedrooms (%)
Bedrooms in owner-occupied houses - 3 bedrooms (%)
Bedrooms in owner-occupied houses - 4 bedrooms (%)
Bedrooms in owner-occupied houses - 5+ bedrooms (%)
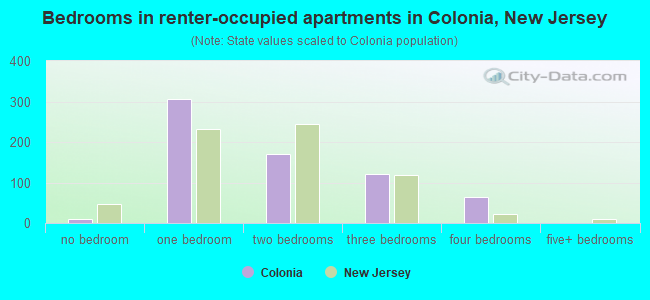
Bedrooms in renter-occupied houses - no bedrooms (%)
Bedrooms in renter-occupied houses - 1 bedroom (%)
Bedrooms in renter-occupied houses - 2 bedrooms (%)
Bedrooms in renter-occupied houses - 3 bedrooms (%)
Bedrooms in renter-occupied houses - 4 bedrooms (%)
Bedrooms in renter-occupied houses - 5+ bedrooms (%)
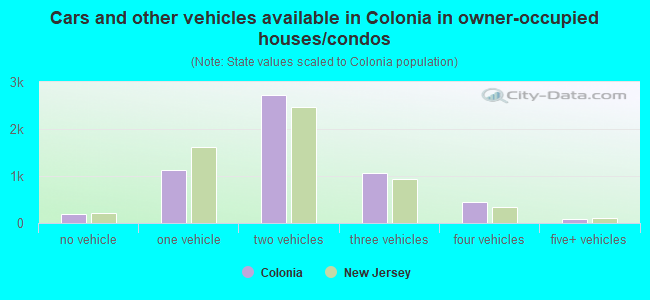
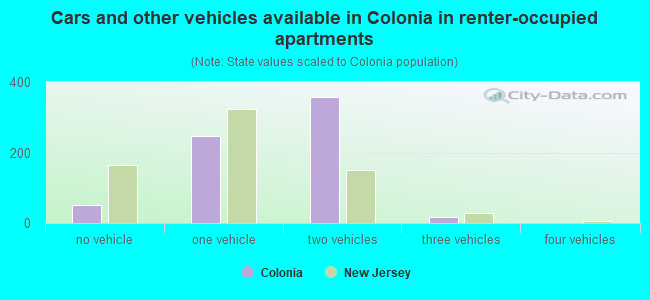
Vehicles available in owner-occupied houses - no vehicle available (%)
Vehicles available in owner-occupied houses - 1 vehicle available(%)
Vehicles available in owner-occupied houses - 2 Vehicles available (%)
Vehicles available in owner-occupied houses - 3 Vehicles available (%)
Vehicles available in owner-occupied houses - 4 Vehicles available (%)
Vehicles available in owner-occupied houses - 5+ Vehicles available (%)
Vehicles available in renter-occupied houses - no vehicle available (%)
Vehicles available in renter-occupied houses - 1 vehicle available (%)
Vehicles available in renter-occupied houses - 2 Vehicles available (%)
Vehicles available in renter-occupied houses - 3 Vehicles available (%)
Vehicles available in renter-occupied houses - 4 Vehicles available (%)
Vehicles available in renter-occupied houses - 5+ Vehicles available (%)
Housing units in structures - 1, detached (%)
Housing units in structures - 1, attached (%)
Housing units in structures - 2 (%)
Housing units in structures - 3 or 4 (%)
Housing units in structures - 5 to 9 (%)
Housing units in structures - 10 to 19 (%)
Housing units in structures - 20 to 49 (%)
Housing units in structures - 50 or more (%)
Housing units in structures - Mobile home (%)
Housing units in structures - Boat, RV, van, etc. (%)
Housing units in structures - Owners - 1, detached (%)
Housing units in structures - Owners - 1, attached (%)
Housing units in structures - Owners - 2 (%)
Housing units in structures - Owners - 3 or 4 (%)
Housing units in structures - Owners - 5 to 9 (%)
Housing units in structures - Owners - 10 to 19 (%)
Housing units in structures - Owners - 20 to 49 (%)
Housing units in structures - Owners - 50 or more (%)
Housing units in structures - Owners - Mobile home (%)
Housing units in structures - Owners - Boat, RV, van, etc. (%)
Housing units in structures - Renters - 1, detached (%)
Housing units in structures - Renters - 1, attached (%)
Housing units in structures - Renters - 2 (%)
Housing units in structures - Renters - 3 or 4 (%)
Housing units in structures - Renters - 5 to 9 (%)
Housing units in structures - Renters - 10 to 19 (%)
Housing units in structures - Renters - 20 to 49 (%)
Housing units in structures - Renters - 50 or more (%)
Housing units in structures - Renters - Mobile home (%)
Housing units in structures - Renters - Boat, RV, van, etc. (%)
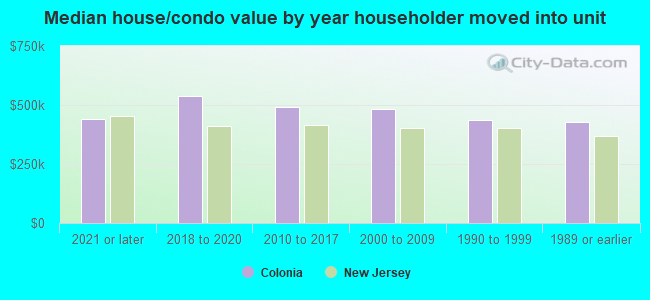
House/condo owner moved in on average (years ago)
Renter moved in on average (years ago)
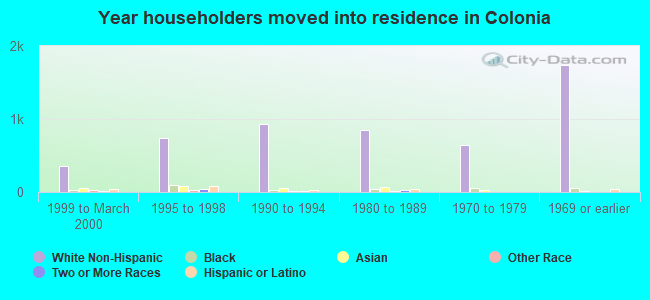
Year householder moved into unit - Moved in 1999 to March 2000 (%)
Year householder moved into unit - Moved in 1999 to March 2000 (%) - White
Year householder moved into unit - Moved in 1999 to March 2000 (%) - Black or African American
Year householder moved into unit - Moved in 1999 to March 2000 (%) - Asian
Year householder moved into unit - Moved in 1999 to March 2000 (%) - Hispanic or Latino
Year householder moved into unit - Moved in 1999 to March 2000 (%) - American Indian and Alaska Native
Year householder moved into unit - Moved in 1999 to March 2000 (%) - Multirace
Year householder moved into unit - Moved in 1999 to March 2000 (%) - Other Race
Year householder moved into unit - Moved in 1995 to 1998 (%)
Year householder moved into unit - Moved in 1995 to 1998 (%) - White
Year householder moved into unit - Moved in 1995 to 1998 (%) - Black or African American
Year householder moved into unit - Moved in 1995 to 1998 (%) - Asian
Year householder moved into unit - Moved in 1995 to 1998 (%) - Hispanic or Latino
Year householder moved into unit - Moved in 1995 to 1998 (%) - American Indian and Alaska Native
Year householder moved into unit - Moved in 1995 to 1998 (%) - Multirace
Year householder moved into unit - Moved in 1995 to 1998 (%) - Other Race
Year householder moved into unit - Moved in 1990 to 1994 (%)
Year householder moved into unit - Moved in 1990 to 1994 (%) - White
Year householder moved into unit - Moved in 1990 to 1994 (%) - Black or African American
Year householder moved into unit - Moved in 1990 to 1994 (%) - Asian
Year householder moved into unit - Moved in 1990 to 1994 (%) - Hispanic or Latino
Year householder moved into unit - Moved in 1990 to 1994 (%) - American Indian and Alaska Native
Year householder moved into unit - Moved in 1990 to 1994 (%) - Multirace
Year householder moved into unit - Moved in 1990 to 1994 (%) - Other Race
Year householder moved into unit - Moved in 1980 to 1989 (%)
Year householder moved into unit - Moved in 1980 to 1989 (%) - White
Year householder moved into unit - Moved in 1980 to 1989 (%) - Black or African American
Year householder moved into unit - Moved in 1980 to 1989 (%) - Asian
Year householder moved into unit - Moved in 1980 to 1989 (%) - Hispanic or Latino
Year householder moved into unit - Moved in 1980 to 1989 (%) - American Indian and Alaska Native
Year householder moved into unit - Moved in 1980 to 1989 (%) - Multirace
Year householder moved into unit - Moved in 1980 to 1989 (%) - Other Race
Year householder moved into unit - Moved in 1970 to 1979 (%)
Year householder moved into unit - Moved in 1970 to 1979 (%) - White
Year householder moved into unit - Moved in 1970 to 1979 (%) - Black or African American
Year householder moved into unit - Moved in 1970 to 1979 (%) - Asian
Year householder moved into unit - Moved in 1970 to 1979 (%) - Hispanic or Latino
Year householder moved into unit - Moved in 1970 to 1979 (%) - American Indian and Alaska Native
Year householder moved into unit - Moved in 1970 to 1979 (%) - Multirace
Year householder moved into unit - Moved in 1970 to 1979 (%) - Other Race
Year householder moved into unit - Moved in 1969 or earlier (%)
Year householder moved into unit - Moved in 1969 or earlier (%) - White
Year householder moved into unit - Moved in 1969 or earlier (%) - Black or African American
Year householder moved into unit - Moved in 1969 or earlier (%) - Asian
Year householder moved into unit - Moved in 1969 or earlier (%) - Hispanic or Latino
Year householder moved into unit - Moved in 1969 or earlier (%) - American Indian and Alaska Native
Year householder moved into unit - Moved in 1969 or earlier (%) - Multirace
Year householder moved into unit - Moved in 1969 or earlier (%) - Other Race
Housing units lacking complete plumbing facilities (%)
Housing units lacking complete kitchen facilities (%)
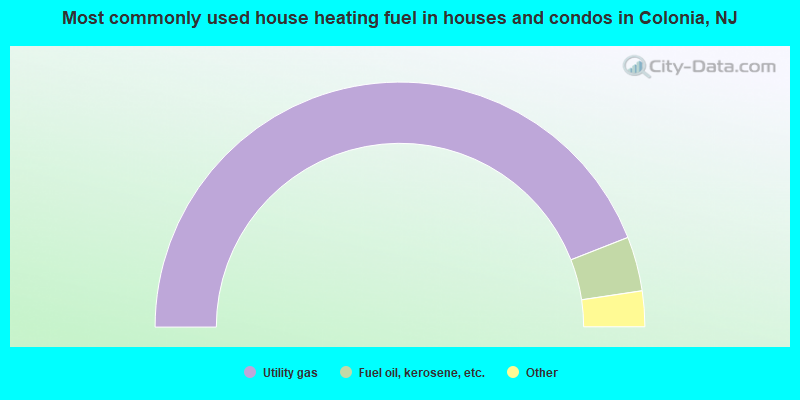
House heating fuel used in houses and condos - Utility gas (%)
House heating fuel used in houses and condos - Bottled, tank, or LP gas (%)
House heating fuel used in houses and condos - Electricity (%)
House heating fuel used in houses and condos - Fuel oil, kerosene, etc. (%)
House heating fuel used in houses and condos - Coal or coke (%)
House heating fuel used in houses and condos - Wood (%)
House heating fuel used in houses and condos - Solar energy (%)
House heating fuel used in houses and condos - Other fuel (%)
House heating fuel used in houses and condos - No fuel used (%)
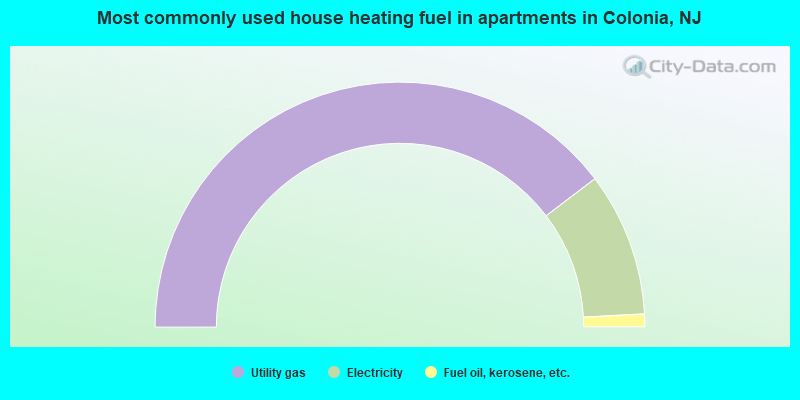
House heating fuel used in apartments - Utility gas (%)
House heating fuel used in apartments - Bottled, tank, or LP gas (%)
House heating fuel used in apartments - Electricity (%)
House heating fuel used in apartments - Fuel oil, kerosene, etc. (%)
House heating fuel used in apartments - Coal or coke (%)
House heating fuel used in apartments - Wood (%)
House heating fuel used in apartments - Solar energy (%)
House heating fuel used in apartments - Other fuel (%)
House heating fuel used in apartments - No fuel used (%)
Latest news about housing in Colonia, NJ collected exclusively by city-data.com from local newspapers, TV, and radio stations
Median year house/condo built: 1960Median year apartment built: 1971Household type by relationship:
Households: 18,608
Male householders: 2,989 (299 living alone ), Female householders: 3,239 (612 living alone )4,020 spouses (4,010 opposite-sex spouses ), 244 unmarried partners , (244 opposite-sex unmarried partners ), 6,069 children (5,778 natural , 62 adopted , 229 stepchildren ), 258 grandchildren , 90 brothers or sisters , 840 parents , 0 foster children , 408 other relatives , 437 non-relatives In group quarters: 9
Size of family households: 1,990 2-persons , 962 3-persons , 1,125 4-persons , 467 5-persons , 356 6-persons , 79 7-or-more-persons .
Size of nonfamily households: 927 1-person , 331 2-persons , 100 3-persons .
2,868 married couples with children. single-parent households (46 men , 591 women ).
66.8% of residents of Colonia speak English at home. of residents speak Spanish at home (71% speak English very well , 11% speak English well , 12% speak English not well , 6% don't speak English at all ).of residents speak other Indo-European language at home (64% speak English very well , 18% speak English well , 17% speak English not well , 1% don't speak English at all ).of residents speak Asian or Pacific Island language at home (64% speak English very well , 24% speak English well , 12% speak English not well ).of residents speak other language at home (71% speak English very well , 29% speak English well ).
Foreign born population: 5,020 (27.0%)of them are naturalized citizens )
Median number of rooms in houses and condos:
Median number of rooms in apartments
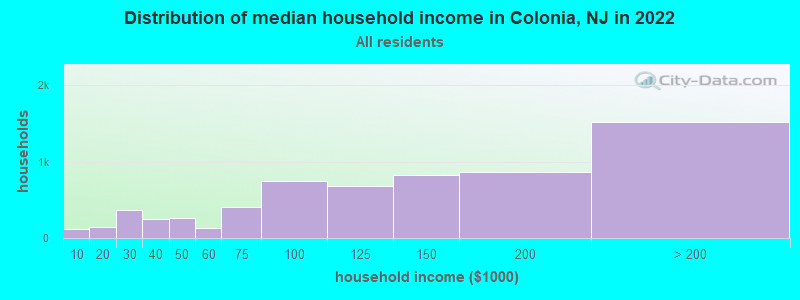
Colonia, NJ household income distribution 121 Less than $10,000139 $10,000 to $19,999368 $20,000 to $29,999248 $30,000 to $39,999262 $40,000 to $49,999137 $50,000 to $59,999401 $60,000 to $74,999748 $75,000 to $99,999678 $100,000 to $124,999822 $125,000 to $149,999859 $150,000 to $199,9991,521 $200,000 or more
Home value of owner - occupied houses in 2022 in Colonia, NJ 47 Less than $10,00010 $35,000 to $39,99940 $40,000 to $49,99924 $50,000 to $59,9993 $80,000 to $89,9992 $90,000 to $99,99912 $100,000 to $124,9995 $125,000 to $149,99933 $175,000 to $199,99954 $200,000 to $249,999131 $250,000 to $299,9991,464 $300,000 to $399,9992,101 $400,000 to $499,9991,701 $500,000 to $749,999247 $750,000 to $999,9999 $1,000,000 to $1,499,99916 $1,500,000 to $1,999,99910 $2,000,000 or moreRent paid by renters in 2022 in Colonia, NJ 13 $200 to $24971 $1,000 to $1,249123 $1,250 to $1,499242 $1,500 to $1,999133 $2,000 to $2,4999 $3,000 to $3,49920 No cash rent
Percentage of workers working in this county: 49.5%Number of people working at home: 1,330 (13.9% of all workers )
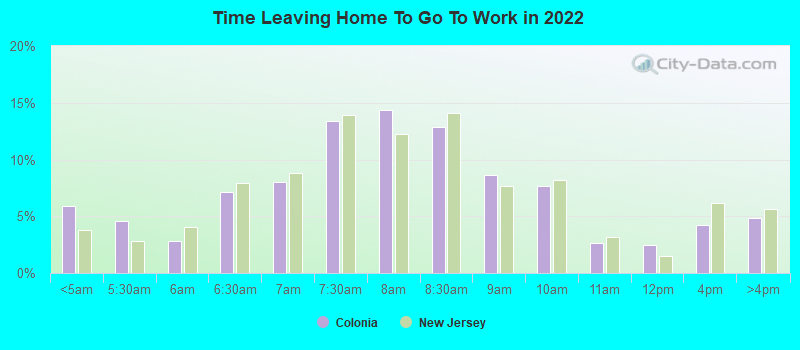
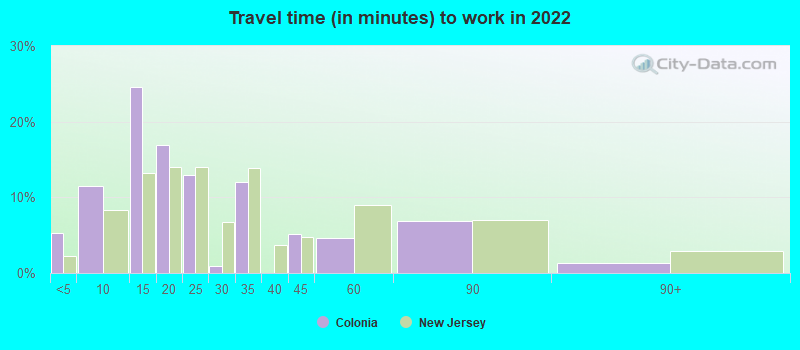
Travel time to work (commute)
Less than 5 minutes: 1455 to 9 minutes: 44710 to 14 minutes: 93815 to 19 minutes: 96520 to 24 minutes: 97425 to 29 minutes: 59030 to 34 minutes: 1,55735 to 39 minutes: 26240 to 44 minutes: 25945 to 59 minutes: 1,16960 to 89 minutes: 58890 or more minutes: 274
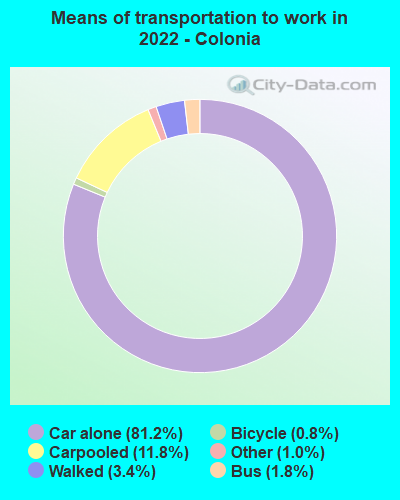
Means of transportation to work:
Drove a car alone: 1,415 (47.4%)Carpooled: 244 (8.2%)Bus : 13 (0.4%)Taxi: 24 (0.8%)Bicycle: 15 (0.5%)Walked: 87 (2.9%)Worked at home: 1,330 (44.6%)
Unemployment by race in 2022
Unemployment rate for White non-Hispanic residents 0.4% Males2.3% FemalesUnemployment rate for Black residents 34.8% FemalesUnemployment rate for Asian residents 4.1% FemalesUnemployment rate for other race residents 13.9% Males11.4% FemalesUnemployment rate for two or more race residents 5.0% MalesUnemployment rate for Hispanic or Latino residents 3.6% Males1.8% Females
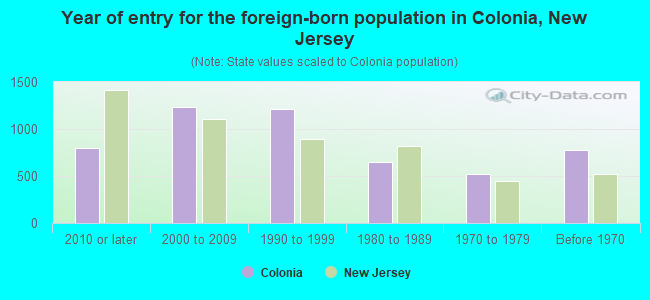
Year of entry for the foreign-born population in Colonia, New Jersey
803 2010 or later 1,232 2000 to 2009 1,211 1990 to 1999 652 1980 to 1989 523 1970 to 1979 780 Before 1970
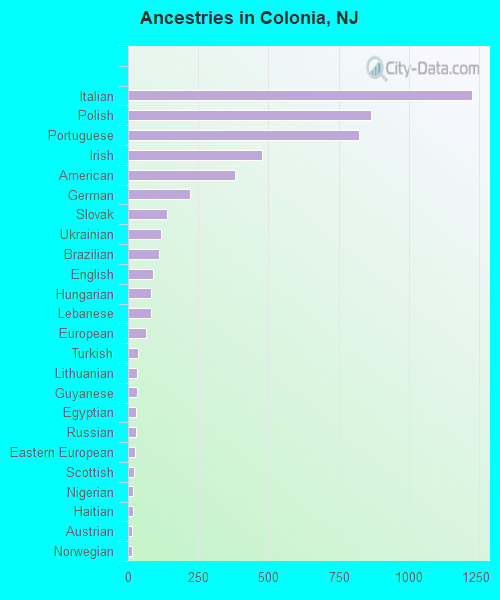
First ancestries reported:
Italian: 1,224 (13.2%)
Polish: 864 (9.3%)
Portuguese: 824 (8.9%)
Irish: 476 (5.1%)
American: 381 (4.1%)
German: 219 (2.4%)
Slovak: 138 (1.5%)
Ukrainian: 116 (1.3%)
Brazilian: 111 (1.2%)
English: 88 (0.9%)
Hungarian: 83 (0.9%)
Lebanese: 81 (0.9%)
European: 65 (0.7%)
Turkish: 34 (0.4%)
Lithuanian: 32 (0.3%)
Guyanese: 32 (0.3%)
Egyptian: 30 (0.3%)
Russian: 27 (0.3%)
Eastern European: 25 (0.3%)
Scottish: 23 (0.2%)
Nigerian: 17 (0.2%)
Haitian: 17 (0.2%)
Austrian: 15 (0.2%)
Norwegian: 14 (0.2%)
West Indian: 11 (0.1%)
German Russian: 10 (0.1%)
Romanian: 9 (0.10%)
Croatian: 8 (0.09%)
Trinidadian and Tobagonian: 8 (0.09%)
Scotch-Irish: 7 (0.08%)
French Canadian: 7 (0.08%)
Czechoslovakian: 7 (0.08%)
Slovene: 6 (0.06%)
African: 6 (0.06%)
Albanian: 6 (0.06%)
Greek: 5 (0.05%) Most common places of birth for foreign-born residents (%): India Colonia:
31.1% (1,519)New Jersey:
12.8% (274,609)
Poland Colonia:
10.5% (514)New Jersey:
2.3% (48,811)
Portugal Colonia:
8.4% (408)New Jersey:
1.3% (28,871)
Brazil Colonia:
5.2% (252)New Jersey:
2.1% (46,020)
Ecuador Colonia:
4.2% (206)New Jersey:
4.4% (95,275)
Dominican Republic Colonia:
3.6% (174)New Jersey:
9.7% (209,055)
Egypt Colonia:
3.0% (147)New Jersey:
1.6% (33,678)
Philippines Colonia:
2.6% (129)New Jersey:
4.0% (85,934)
Colombia Colonia:
2.3% (113)New Jersey:
4.2% (90,817)
Germany Colonia:
2.3% (111)New Jersey:
0.8% (17,217)
Guyana Colonia:
2.2% (109)New Jersey:
1.2% (26,173)
Czechoslovakia (includes Czech Republic and Slovakia) Colonia:
2.2% (108)New Jersey:
0.2% (3,968)
China, excluding Hong Kong and Taiwan Colonia:
2.0% (100)New Jersey:
3.7% (78,969)
Ukraine Colonia:
1.9% (95)New Jersey:
1.1% (22,760)
Place of birth for U.S.-born residents:
This state: 10,828Other state: 2,352Northeast: 1,904Midwest: 145South: 210West: 95 94.3% of Colonia residents lived in the same house 1 years ago.
Out of people who lived in different houses, 36.3% lived in this county.
Out of people who lived in different counties, 78.0% lived in New Jersey.
Colonia:
94.3%State average:
90.4%
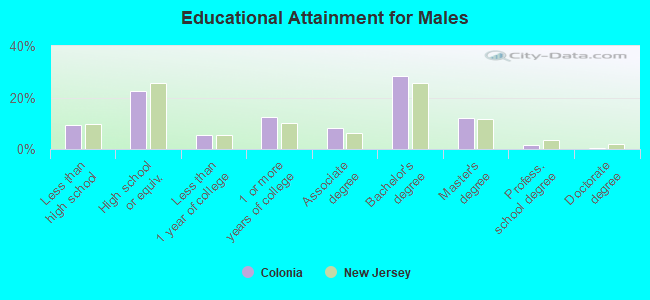
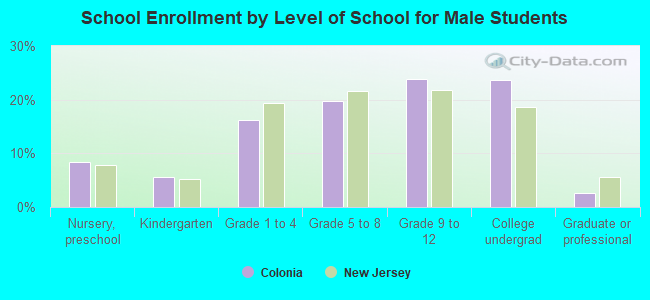
Education attainment for males 25 years and older:
No schooling: 323Nursery to 4th grade: 05th and 6th grade: 07th and 8th grade: 59th grade: 2410th grade: 6911th grade: 1012th grade, no diploma: 165High school graduate (or equivalency): 1,456Less than 1 year of college: 361Some college more than 1 year, no degree: 800Associate degree: 517Bachelor's degree: 1,843Master's degree: 780Professional school degree: 101Doctorate degree: 35
Education attainment for females 25 years and older:
No schooling: 122Nursery to 4th grade: 05th and 6th grade: 87th and 8th grade: 1169th grade: 810th grade: 5311th grade: 8712th grade, no diploma: 120High school graduate (or equivalency): 1,520Less than 1 year of college: 511Some college more than 1 year, no degree: 743Associate degree: 597Bachelor's degree: 2,029Master's degree: 918Professional school degree: 169Doctorate degree: 86
Housing units in structures:
One, detached: 5,721One, attached: 110Two: 2603 or 4: 1110 to 19: 16120 to 49: 4350 or more: 87Housing units lacking complete plumbing facilities in 2022: 0.5%House/condo owner moved in on average 18 years ago
Renter moved in on average 3 years ago
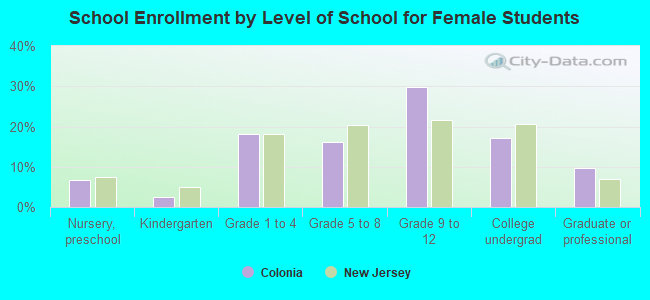
Private vs. public school enrollment:
Students in private schools in grades 1 to 8 (elementary and middle school): 70 Here:
4.5%New Jersey:
12.3%
Students in private schools in grades 9 to 12 (high school): 200 Here:
16.9%New Jersey:
13.1%
Students in private undergraduate colleges: 239 Here:
28.2%New Jersey:
33.2%