Coppell, TX (Texas) Houses and Residents
| Coppell: | $576,883 |
| Texas: | $275,400 |
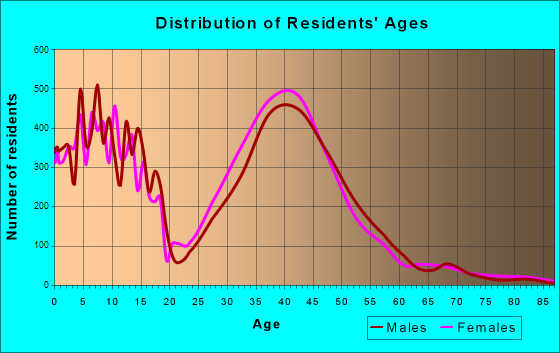
Total population: 40,678 (Urban population: 35,893, Rural population: 62 (all nonfarm))
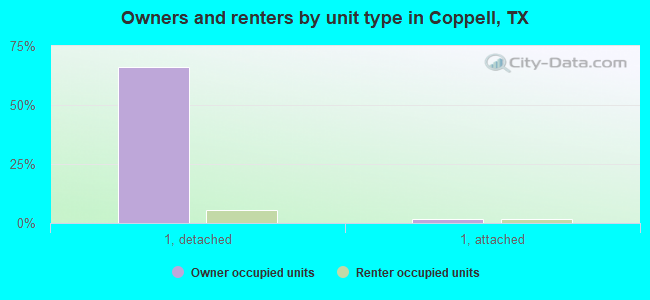
Houses: 16,360 (15,964 occupied: 11,400 owner occupied, 4,768 renter occupied)
| % of renters here: | 29% |
| State: | 38% |
Housing density: 1,100 houses/condos per square mile
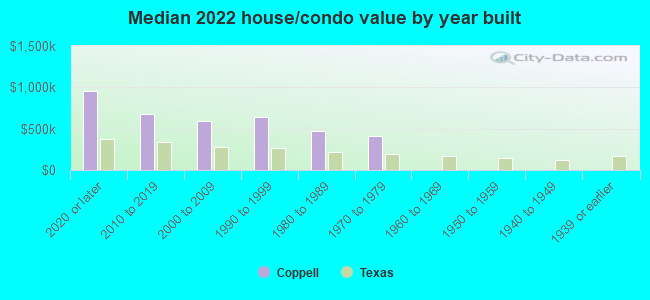
Median price asked for vacant for-sale houses and condos in 2022: $419,191.
Median contract rent in 2022: $1,657 (lower quartile is $1,258, upper quartile is over $2,000)
Median rent asked for vacant for-rent units in 2022: $1,701
Median gross rent in Coppell, TX in 2022: $1,816
Housing units in Coppell with a mortgage: 7,333 (467 second mortgage, 16 home equity loan, 287 both second mortgage and home equity loan)
Houses without a mortgage: 150
Median household income for houses/condos with a mortgage: $198,383
Median household income for apartments without a mortgage: $170,934
Median monthly housing costs: $2,178
Compare current foreclosures near Coppell, TX:
| Photo | Address | Area | Beds / Baths | Price | Details |
|---|---|---|---|---|---|

|
#1
Winetree Ct
Coppell, TX 75019
|
1,496 sq. feet
|
2 baths 3 beds |
show details | |

|
#2
Aspenway Dr
Coppell, TX 75019
|
1,378 sq. feet
|
2 baths 3 beds |
show details | |

|
#3
Dickens Dr
Coppell, TX 75019
|
3,922 sq. feet
|
4 baths 5 beds |
show details | |

|
#4
Hunters Ridge Rd
Coppell, TX 75019
|
2,359 sq. feet
|
2 baths 3 beds |
show details | |

|
#5
Simmons Dr
Coppell, TX 75019
|
1,978 sq. feet
|
2 baths 3 beds |
show details | |

|
#6
Parkway Blvd
Coppell, TX 75019
|
1,309 sq. feet
|
2 baths 3 beds |
show details | |

|
#7
Dillard Ln
Coppell, TX 75019
|
2,586 sq. feet
|
2 baths 4 beds |
show details | |

|
#8
Creek Xing
Coppell, TX 75019
|
3,605 sq. feet
|
4 baths 4 beds |
show details | |

|
#9
Meadowcreek Rd
Coppell, TX 75019
|
2,526 sq. feet
|
3 baths 3 beds |
show details | |

|
#10
Raintree Cir
Coppell, TX 75019
|
1,875 sq. feet
|
3 baths - beds |
show details |
| Photo | Address | Area | Beds / Baths | Price | Details |
|---|---|---|---|---|---|

|
#11
Olympus Blvd, Ste 500
Coppell, TX 75019
|
- sq. feet
|
- baths - beds |
show details | |

|
#12
Wharf Rd, Apt 366
Coppell, TX 75019
|
- sq. feet
|
- baths - beds |
show details | |

|
#13
Fairway Dr Apt 1413
Coppell, TX 75019
|
- sq. feet
|
- baths - beds |
show details | |

|
#14
N Coppell Rd Apt 3202
Coppell, TX 75019
|
- sq. feet
|
- baths - beds |
show details | |

|
#15
E Belt Line Rd Apt 912
Coppell, TX 75019
|
- sq. feet
|
- baths - beds |
show details | |

|
#16
E Belt Line Rd Apt 1127
Coppell, TX 75019
|
- sq. feet
|
- baths - beds |
show details | |

|
#17
Chapel Oaks Dr, Unit 404
Coppell, TX 75019
|
- sq. feet
|
- baths - beds |
show details | |

|
#18
Raven Ln
Coppell, TX 75019
|
- sq. feet
|
- baths - beds |
show details | |

|
#19
Rembrandt Ct
Coppell, TX 75019
|
- sq. feet
|
- baths - beds |
show details | |

|
#20
Samuel Blvd Apt 10f
Coppell, TX 75019
|
- sq. feet
|
- baths - beds |
show details |
| Photo | Address | Area | Beds / Baths | Price | Details |
|---|---|---|---|---|---|

|
#21
Fairway Dr Apt 515
Coppell, TX 75019
|
- sq. feet
|
- baths - beds |
show details | |

|
#22
Cypress Waters Blvd Apt 112
Coppell, TX 75019
|
- sq. feet
|
- baths - beds |
show details | |

|
#23
Cypress Waters Blvd, Ste 160
Coppell, TX 75019
|
- sq. feet
|
- baths - beds |
show details | |

|
#24
Huntingdon St
Coppell, TX 75019
|
- sq. feet
|
- baths - beds |
show details | |

|
#25
Woodhurst Dr
Coppell, TX 75019
|
- sq. feet
|
- baths - beds |
show details | |

|
#26
Eastpark Ln
Frisco, TX 75033
|
1,874 sq. feet
|
3 baths 3 beds |
$397,800
|
show details |

|
#27
Demarsh Lane
Denton, TX 76210
|
3,576 sq. feet
|
3 baths 4 beds |
$589,900
|
show details |

|
#28
Noble Way
Flower Mound, TX 75022
|
4,744 sq. feet
|
4 baths 4 beds |
show details | |

|
#29
N Ector Dr
Euless, TX 76039
|
1,643 sq. feet
|
2 baths 3 beds |
show details | |

|
#30
Little Ranch Rd
North Richland Hills, TX 76182
|
2,889 sq. feet
|
3 baths 5 beds |
show details |
| Photo | Address | Area | Beds / Baths | Price | Details |
|---|---|---|---|---|---|

|
#31
Leahy Dr
Dallas, TX 75229
|
2,231 sq. feet
|
3 baths 5 beds |
show details | |

|
#32
Brazos Dr
Carrollton, TX 75007
|
- sq. feet
|
2 baths 3 beds |
show details | |

|
#33
Waterfall Ln
Little Elm, TX 75068
|
- sq. feet
|
2 baths 4 beds |
show details | |

|
#34
Cherry Ridge Dr
Frisco, TX 75033
|
2,811 sq. feet
|
2 baths 3 beds |
show details | |

|
#35
Zebra Finch Dr
Little Elm, TX 75068
|
- sq. feet
|
3 baths 5 beds |
show details | |

|
#36
Saint Lukes Dr
Richardson, TX 75080
|
1,797 sq. feet
|
2 baths 3 beds |
show details | |

|
#37
Lamp Post Dr
Little Elm, TX 75068
|
1,480 sq. feet
|
2 baths 3 beds |
show details | |

|
#38
Chimney Hill Dr
Arlington, TX 76012
|
3,206 sq. feet
|
3 baths 4 beds |
show details | |

|
#39
Creekstone Dr
Plano, TX 75093
|
1,943 sq. feet
|
2 baths 3 beds |
show details | |

|
#40
Highland Dr
Colleyville, TX 76034
|
3,298 sq. feet
|
3 baths 4 beds |
show details |
| Photo | Address | Area | Beds / Baths | Price | Details |
|---|---|---|---|---|---|

|
#41
Southwestern Blvd
Dallas, TX 75225
|
7,329 sq. feet
|
6 baths 5 beds |
show details | |

|
#42
Peppercorn Dr
Euless, TX 76039
|
2,552 sq. feet
|
2 baths 3 beds |
show details | |

|
#43
Creek Crossing Dr
Plano, TX 75093
|
2,080 sq. feet
|
2 baths 4 beds |
show details | |

|
#44
Shoreham Cir
The Colony, TX 75056
|
4,012 sq. feet
|
3 baths 4 beds |
show details | |

|
#45
N Haven Dr
Denton, TX 76210
|
1,476 sq. feet
|
2 baths 3 beds |
show details | |

|
#46
Seneca Dr
Frisco, TX 75034
|
4,779 sq. feet
|
5 baths 5 beds |
show details | |

|
#47
Frazier Ct
Euless, TX 76040
|
1,336 sq. feet
|
1 baths 3 beds |
show details | |

|
#48
Norwich Ln
Denton, TX 76210
|
2,187 sq. feet
|
2 baths 3 beds |
show details | |

|
#49
Barnhill Ln
Frisco, TX 75034
|
4,157 sq. feet
|
2 baths 4 beds |
show details | |

|
Check over 1 million property listings on Foreclosure.com!
|
browse all offers | |||

Latest news about housing in Coppell, TX collected exclusively by city-data.com from local newspapers, TV, and radio stations


Median year apartment built: 1994
Household type by relationship:
Households: 42,460- Male householders: 9,068 (1,306 living alone), Female householders: 6,529 (1,663 living alone)
10,332 spouses (10,270 opposite-sex spouses), 409 unmarried partners, (388 opposite-sex unmarried partners), 14,563 children (13,857 natural, 231 adopted, 473 stepchildren), 275 grandchildren, 171 brothers or sisters, 605 parents, 0 foster children, 244 other relatives, 211 non-relatives
- In group quarters: 47
Size of family households: 4,862 2-persons, 3,236 3-persons, 3,279 4-persons, 807 5-persons, 307 6-persons, 14 7-or-more-persons.
Size of nonfamily households: 3,174 1-person, 329 2-persons, 15 4-persons.
9,493 married couples with children.
1,737 single-parent households (441 men, 1,296 women).
61.3% of residents of Coppell speak English at home.
10.7% of residents speak Spanish at home (78% speak English very well, 11% speak English well, 10% speak English not well, 1% don't speak English at all).
12.2% of residents speak other Indo-European language at home (87% speak English very well, 7% speak English well, 3% speak English not well, 3% don't speak English at all).
16.1% of residents speak Asian or Pacific Island language at home (83% speak English very well, 10% speak English well, 5% speak English not well, 1% don't speak English at all).
1.3% of residents speak other language at home (100% speak English very well).
Foreign born population: 12,224 (28.8%)
(51.9% of them are naturalized citizens)
| Here: | 7.8 |
| State: | 6.3 |
| Here: | 4.1 |
| State: | 4.0 |
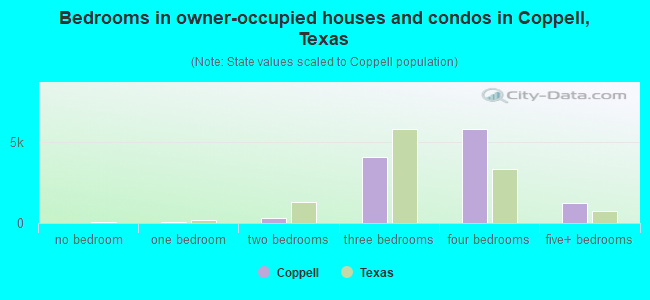
- Bedrooms in owner-occupied houses and condos in Coppell, Texas
- 10no bedroom
- 311 bedroom
- 2842 bedrooms
- 4,0753 bedrooms
- 5,7534 bedrooms
- 1,2475+ bedrooms
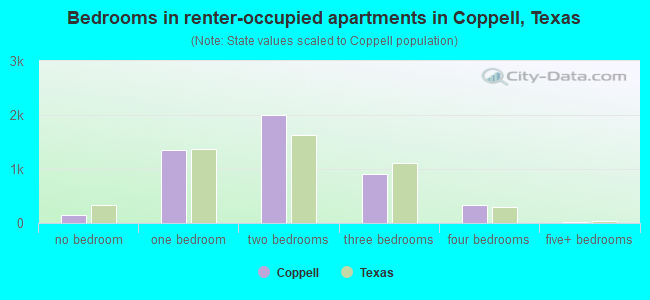
- Bedrooms in renter-occupied apartments in Coppell, Texas
- 148no bedroom
- 1,3551 bedroom
- 1,9952 bedrooms
- 9093 bedrooms
- 3414 bedrooms
- 215+ bedrooms
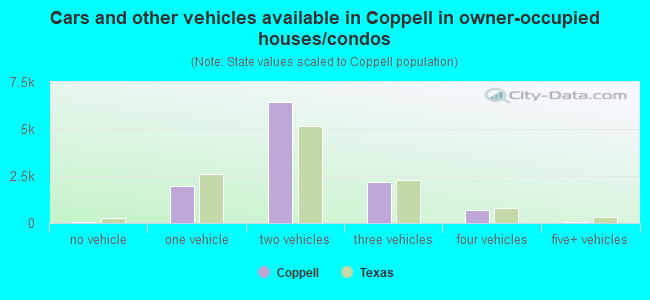
- Cars and other vehicles available in Coppell in owner-occupied houses/condos
- 49no vehicle
- 1,9501 vehicle
- 6,4202 vehicles
- 2,1993 vehicles
- 7174 vehicles
- 655+ vehicles
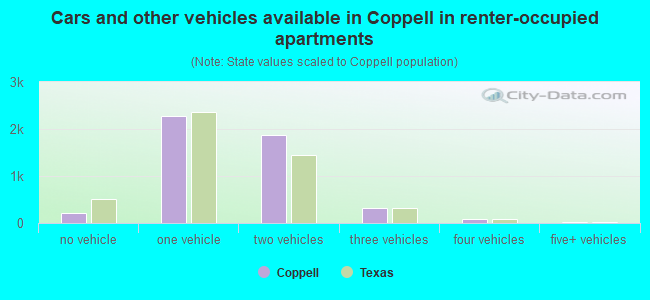
- Cars and other vehicles available in Coppell in renter-occupied apartments
- 216no vehicle
- 2,2751 vehicle
- 1,8642 vehicles
- 3183 vehicles
- 804 vehicles
- 145+ vehicles
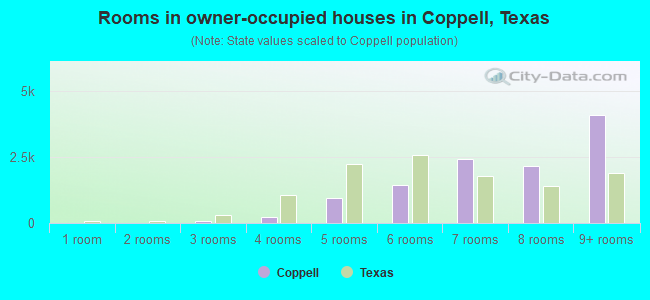
- Rooms in owner-occupied houses in Coppell, Texas
- 101 room
- 02 rooms
- 833 rooms
- 2224 rooms
- 9605 rooms
- 1,4526 rooms
- 2,4357 rooms
- 2,1518 rooms
- 4,0879+ rooms
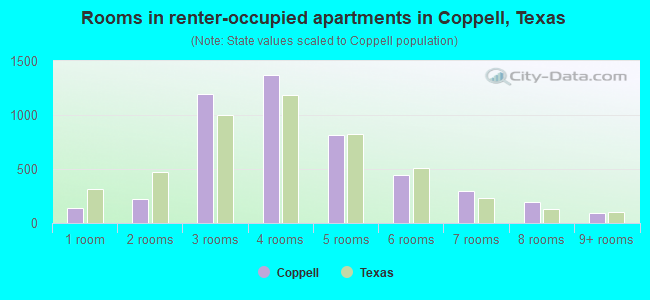
- Rooms in renter-occupied apartments in Coppell, Texas
- 1401 room
- 2222 rooms
- 1,1923 rooms
- 1,3694 rooms
- 8185 rooms
- 4416 rooms
- 2967 rooms
- 1978 rooms
- 959+ rooms
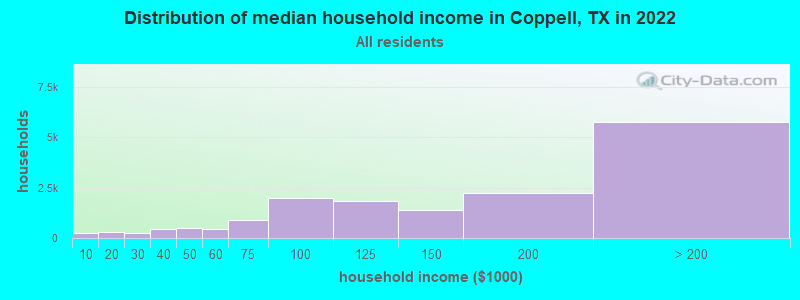
Coppell, TX household income distribution

- 268Less than $10,000
- 320$10,000 to $19,999
- 228$20,000 to $29,999
- 463$30,000 to $39,999
- 497$40,000 to $49,999
- 471$50,000 to $59,999
- 873$60,000 to $74,999
- 1,999$75,000 to $99,999
- 1,851$100,000 to $124,999
- 1,391$125,000 to $149,999
- 2,236$150,000 to $199,999
- 5,756$200,000 or more
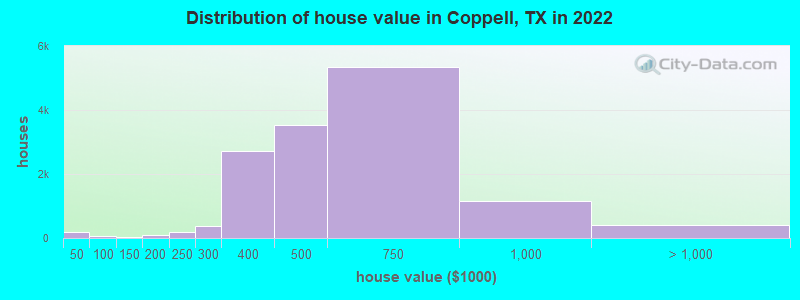
Home value of owner - occupied houses in 2022 in Coppell, TX
-
- 81Less than $10,000
- 10$20,000 to $24,999
- 68$25,000 to $29,999
- 34$40,000 to $49,999
- 5$60,000 to $69,999
- 12$70,000 to $79,999
- 13$80,000 to $89,999
- 4$90,000 to $99,999
- 12$100,000 to $124,999
- 14$125,000 to $149,999
- 50$150,000 to $174,999
- 40$175,000 to $199,999
- 185$200,000 to $249,999
- 385$250,000 to $299,999
- 2,709$300,000 to $399,999
- 3,524$400,000 to $499,999
- 5,356$500,000 to $749,999
- 1,153$750,000 to $999,999
- 243$1,000,000 to $1,499,999
- 54$1,500,000 to $1,999,999
- 95$2,000,000 or more
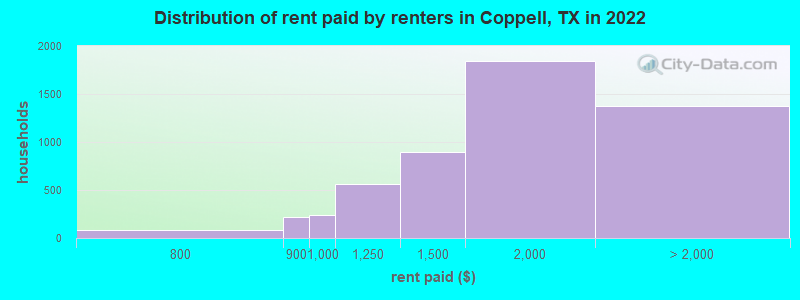
Rent paid by renters in 2022 in Coppell, TX
-
- 36$700 to $749
- 48$750 to $799
- 217$800 to $899
- 242$900 to $999
- 566$1,000 to $1,249
- 897$1,250 to $1,499
- 1,844$1,500 to $1,999
- 749$2,000 to $2,499
- 260$2,500 to $2,999
- 72$3,000 to $3,499
- 236$3,500 or more
- 59No cash rent
Percentage of workers working in this county: 77.4%
Number of people working at home: 7,821 (33.1% of all workers)
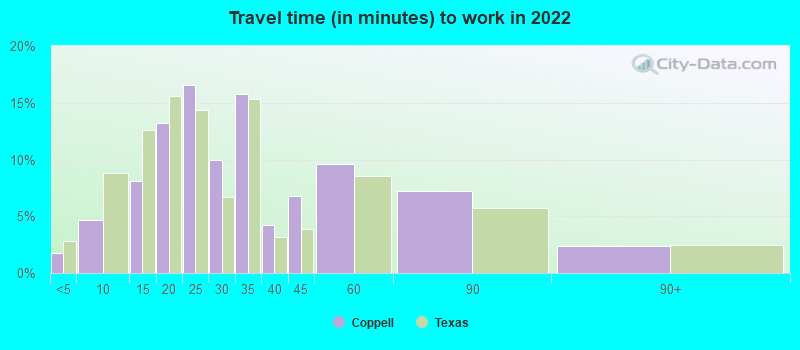
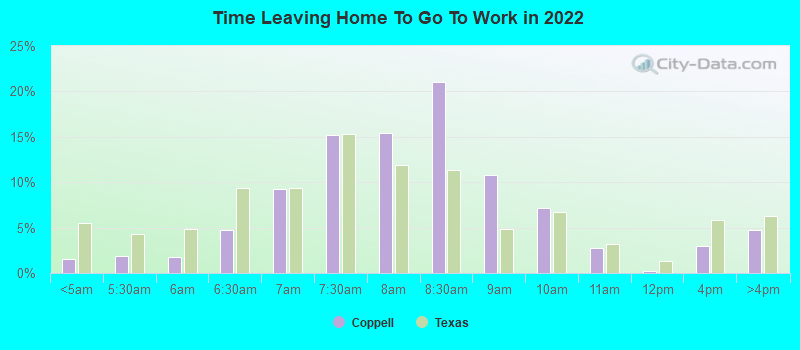
Travel time to work (commute)
- Less than 5 minutes: 265
- 5 to 9 minutes: 1,200
- 10 to 14 minutes: 1,807
- 15 to 19 minutes: 2,271
- 20 to 24 minutes: 3,715
- 25 to 29 minutes: 1,696
- 30 to 34 minutes: 2,981
- 35 to 39 minutes: 645
- 40 to 44 minutes: 704
- 45 to 59 minutes: 1,319
- 60 to 89 minutes: 252
- 90 or more minutes: 160
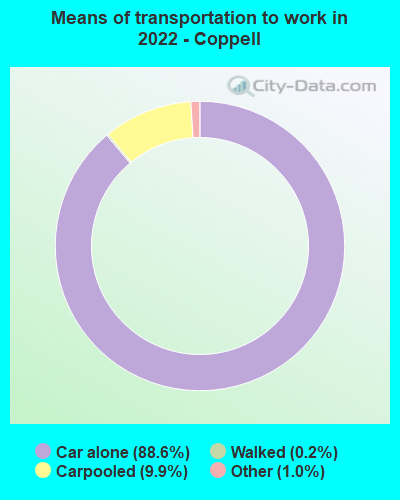
Means of transportation to work:
- Drove a car alone: 27,938 (72.5%)
- Carpooled: 3,212 (8.3%)
- Bus: 18 (0.0%)
- Subway or elevated rail: 9 (0.0%)
- Taxi: 409 (1.1%)
- Bicycle: 26 (0.1%)
- Walked: 74 (0.2%)
- Worked at home: 7,821 (20.3%)
- Unemployment by race in 2022
- Unemployment rate for White non-Hispanic residents
- 1.2%Males
- 0.3%Females
- Unemployment rate for Black residents
- 5.8%Males
- 3.6%Females
- Unemployment rate for Asian residents
- 3.2%Males
- 5.1%Females
- Unemployment rate for other race residents
- 10.4%Females
- Unemployment rate for two or more race residents
- 1.1%Males
- Unemployment rate for Hispanic or Latino residents
- 0.7%Males
- 1.7%Females
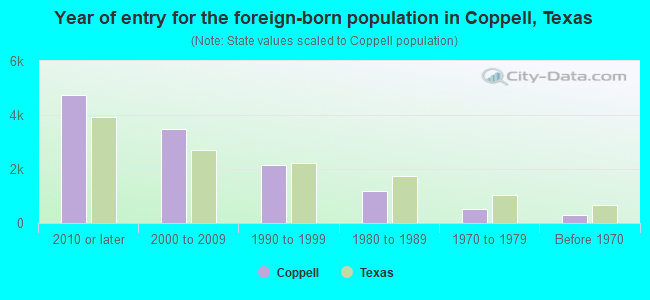
- Year of entry for the foreign-born population in Coppell, Texas
- 4,7342010 or later
- 3,4712000 to 2009
- 2,1321990 to 1999
- 1,1861980 to 1989
- 5321970 to 1979
- 285Before 1970
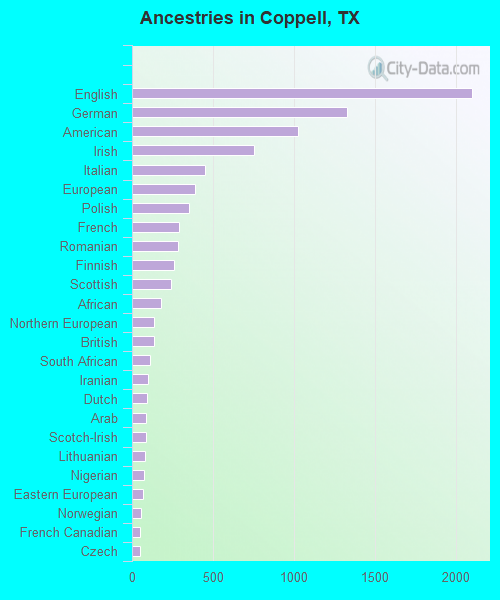
First ancestries reported:
- English: 2,101 (8.4%)
- German: 1,326 (5.3%)
- American: 1,023 (4.1%)
- Irish: 752 (3.0%)
- Italian: 452 (1.8%)
- European: 391 (1.6%)
- Polish: 352 (1.4%)
- French: 293 (1.2%)
- Romanian: 284 (1.1%)
- Finnish: 257 (1.0%)
- Scottish: 238 (1.0%)
- African: 179 (0.7%)
- Northern European: 136 (0.5%)
- British: 133 (0.5%)
- South African: 113 (0.5%)
- Iranian: 100 (0.4%)
- Dutch: 92 (0.4%)
- Arab: 89 (0.4%)
- Scotch-Irish: 88 (0.4%)
- Lithuanian: 80 (0.3%)
- Nigerian: 73 (0.3%)
- Eastern European: 68 (0.3%)
- Norwegian: 58 (0.2%)
- French Canadian: 51 (0.2%)
- Czech: 47 (0.2%)
- Welsh: 46 (0.2%)
- Armenian: 43 (0.2%)
- Russian: 42 (0.2%)
- Turkish: 42 (0.2%)
- Scandinavian: 41 (0.2%)
- Macedonian: 34 (0.1%)
- Slovene: 32 (0.1%)
- Ukrainian: 30 (0.1%)
- Syrian: 27 (0.1%)
- Canadian: 26 (0.1%)
- Belgian: 26 (0.1%)
- Swedish: 16 (0.06%)
- Greek: 16 (0.06%)
- Egyptian: 14 (0.06%)
- Lebanese: 12 (0.05%)
- Swiss: 12 (0.05%)
- Slovak: 11 (0.04%)
- West Indian: 11 (0.04%)
- Danish: 9 (0.04%)
- Luxembourger: 7 (0.03%)
- Jordanian: 6 (0.02%)
- Hungarian: 6 (0.02%)
- Czechoslovakian: 5 (0.02%)
- Yugoslavian: 4 (0.02%)
Most common places of birth for foreign-born residents (%):
| Coppell: | 45.7% (5,879) |
| Texas: | 6.1% (306,347) |
| Coppell: | 8.2% (1,053) |
| Texas: | 48.4% (2,411,723) |
| Coppell: | 6.4% (823) |
| Texas: | 2.3% (115,558) |
| Coppell: | 5.1% (656) |
| Texas: | 0.4% (17,796) |
| Coppell: | 3.9% (505) |
| Texas: | 1.2% (60,172) |
| Coppell: | 2.2% (279) |
| Texas: | 0.2% (11,402) |
| Coppell: | 1.9% (242) |
| Texas: | 1.2% (62,159) |
| Coppell: | 1.6% (210) |
| Texas: | 0.3% (15,368) |
Place of birth for U.S.-born residents:
- This state: 16,334
- Other state: 13,531
- Northeast: 2,488
- Midwest: 4,163
- South: 3,903
- West: 3,051
87.8% of Coppell residents lived in the same house 1 years ago.
Out of people who lived in different houses, 36.5% lived in this county.
Out of people who lived in different counties, 53.7% lived in Texas.
| Coppell: | 87.8% |
| State average: | 85.7% |
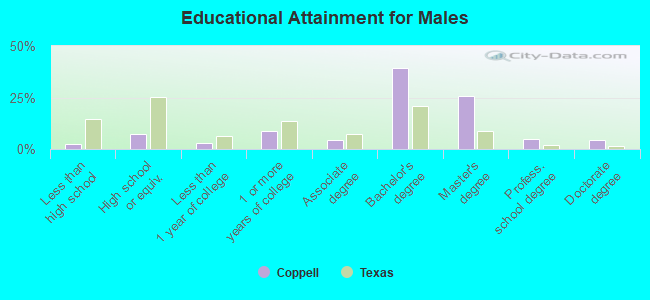
Education attainment for males 25 years and older:
- No schooling: 133
- Nursery to 4th grade: 46
- 5th and 6th grade: 76
- 7th and 8th grade: 0
- 9th grade: 5
- 10th grade: 25
- 11th grade: 0
- 12th grade, no diploma: 98
- High school graduate (or equivalency): 1,092
- Less than 1 year of college: 395
- Some college more than 1 year, no degree: 1,240
- Associate degree: 631
- Bachelor's degree: 5,757
- Master's degree: 3,729
- Professional school degree: 729
- Doctorate degree: 604
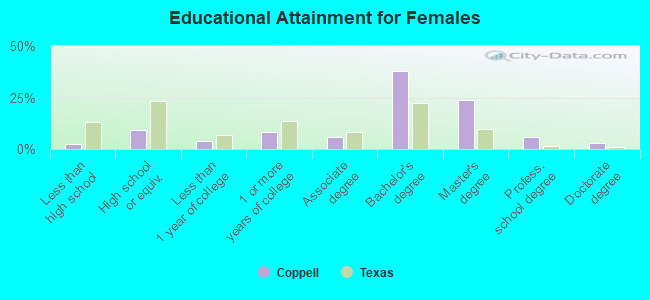
Education attainment for females 25 years and older:
- No schooling: 131
- Nursery to 4th grade: 14
- 5th and 6th grade: 56
- 7th and 8th grade: 0
- 9th grade: 19
- 10th grade: 26
- 11th grade: 30
- 12th grade, no diploma: 92
- High school graduate (or equivalency): 1,366
- Less than 1 year of college: 573
- Some college more than 1 year, no degree: 1,262
- Associate degree: 879
- Bachelor's degree: 5,599
- Master's degree: 3,542
- Professional school degree: 842
- Doctorate degree: 439
Housing units in structures:
- One, detached: 12,002
- One, attached: 635
- Two: 214
- 3 or 4: 393
- 5 to 9: 814
- 10 to 19: 1,040
- 20 to 49: 396
- 50 or more: 614
- Mobile homes: 238
- Boats, RVs, vans, etc.: 10
Median worth of mobile homes: $32,939
Housing units lacking complete kitchen facilities in 2022: 0.5%
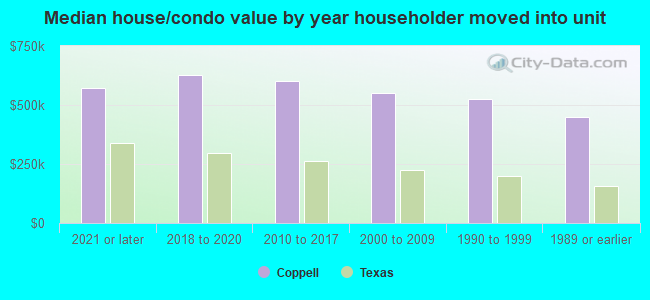
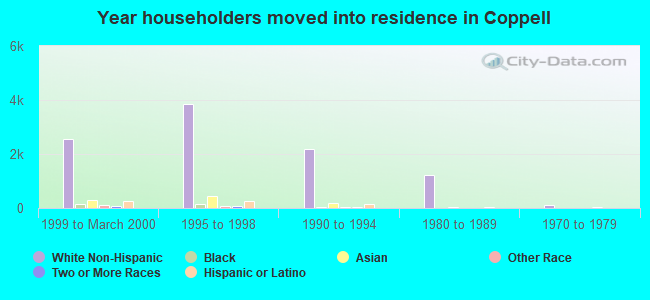
House/condo owner moved in on average 9 years ago
Renter moved in on average 3 years ago
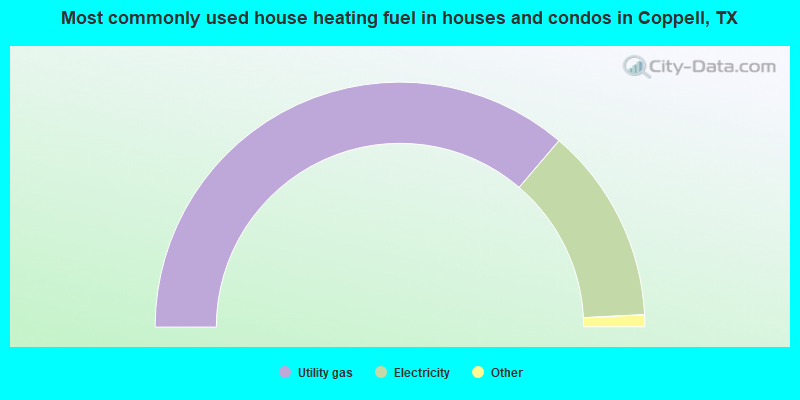
- 72.5%Utility gas
- 25.9%Electricity
- 0.7%Bottled, tank, or LP gas
- 0.6%No fuel used
- 0.2%Solar energy
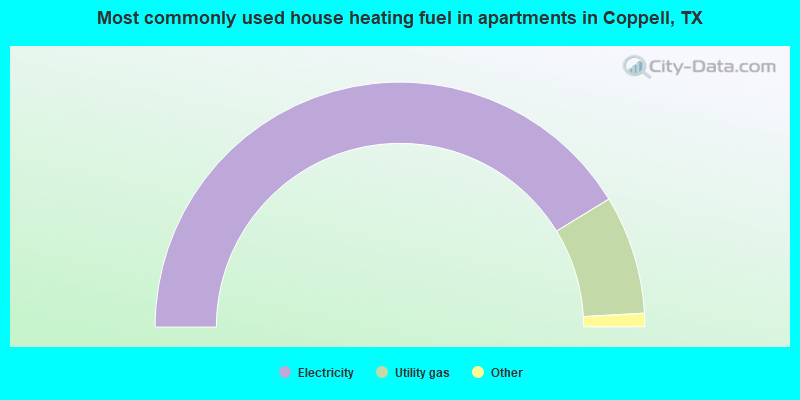
- 82.6%Electricity
- 15.7%Utility gas
- 1.0%No fuel used
- 0.8%Bottled, tank, or LP gas
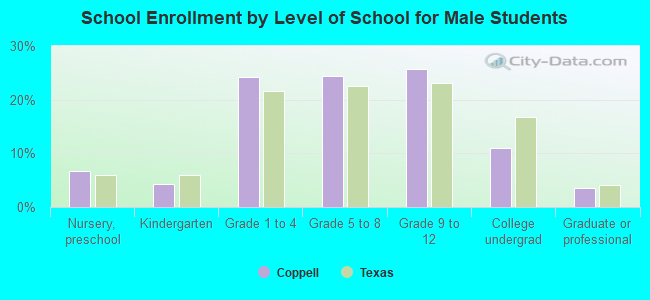
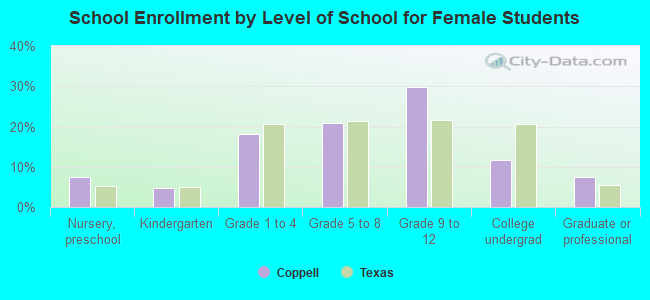
Private vs. public school enrollment:
| Here: | 7.6% |
| Texas: | 8.8% |
| Here: | 3.1% |
| Texas: | 8.0% |
| Here: | 25.7% |
| Texas: | 16.2% |