Cortlandville, NY (New York) Houses and Residents
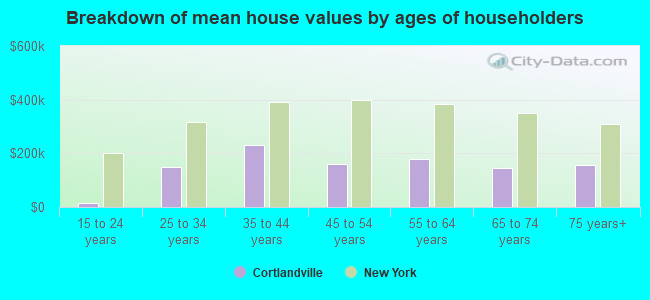
| Cortlandville: | $174,640 |
| New York: | $400,400 |
Total population: 8,509 (Urban population: 4,610 (all inside urban clusters), Rural population: 3,309 (44 farm, 3,265 nonfarm))
Houses: 3,431 (3,166 occupied: 2,231 owner occupied, 935 renter occupied)
| % of renters here: | 30% |
| State: | 46% |
Housing density: 69 houses/condos per square mile
Median price asked for vacant for-sale houses and condos in 2022 in this county: $266,169.
Median contract rent in 2022: $855 (lower quartile is $664, upper quartile is $1,004)
Median rent asked for vacant for-rent units in 2022: $718
Median gross rent in Cortlandville, NY in 2022: $961
Housing units in Cortlandville with a mortgage: 1,203 (98 second mortgage, 121 home equity loan, 4 both second mortgage and home equity loan)
Houses without a mortgage: 575
Compare current foreclosures near Cortlandville, NY:
| Photo | Address | Area | Beds / Baths | Price | Details |
|---|---|---|---|---|---|

|
#1
Brown Ave
Cortland, NY 13045
|
1,972 sq. feet
|
1 baths 4 beds |
$86,000
|
show details |

|
#2
Pine Hill Rd
Marathon, NY 13803
|
- sq. feet
|
2 baths 3 beds |
$221,660
|
show details |

|
#3
Champlin Rd
Groton, NY 13073
|
1,756 sq. feet
|
2 baths 3 beds |
show details | |

|
#4
Preble Rd
Preble, NY 13141
|
2,033 sq. feet
|
1 baths 3 beds |
show details | |

|
#5
W Center St
Mc Graw, NY 13101
|
1,474 sq. feet
|
1 baths 3 beds |
show details | |

|
#6
State Route 90
Locke, NY 13092
|
1,816 sq. feet
|
1 baths 2 beds |
show details | |

|
#7
E Homer Baltimore Rd
Homer, NY 13077
|
1,120 sq. feet
|
1 baths 3 beds |
show details | |

|
#8
Mead Rd
Homer, NY 13077
|
2,070 sq. feet
|
1 baths 3 beds |
show details | |

|
#9
E Homer Crossing Rd
Cortland, NY 13045
|
1,065 sq. feet
|
1 baths 3 beds |
show details | |

|
#10
Gulf Hill Rd
Cortland, NY 13045
|
1,296 sq. feet
|
1 baths 3 beds |
show details |
| Photo | Address | Area | Beds / Baths | Price | Details |
|---|---|---|---|---|---|

|
#11
Gulf Hill Rd # B
Cortland, NY 13045
|
2,544 sq. feet
|
2 baths 4 beds |
show details | |

|
#12
Maybury Rd
Mc Graw, NY 13101
|
2,880 sq. feet
|
1 baths 3 beds |
show details | |

|
#13
Sherman Rd
Cortland, NY 13045
|
1,456 sq. feet
|
2 baths 3 beds |
show details | |

|
#14
Greystone Dr
Dryden, NY 13053
|
2,356 sq. feet
|
2 baths 3 beds |
show details | |

|
#15
Traverse Rd
Cortland, NY 13045
|
1,560 sq. feet
|
2 baths 4 beds |
show details | |

|
#16
Mcgraw Marathon Rd
Mc Graw, NY 13101
|
1,180 sq. feet
|
1 baths 3 beds |
show details | |

|
#17
Mcgraw Marathon Rd
Mc Graw, NY 13101
|
1,180 sq. feet
|
1 baths 3 beds |
show details | |

|
#18
State Route 90
Cortland, NY 13045
|
2,802 sq. feet
|
2 baths 5 beds |
show details | |

|
#19
Tobin Dr
Homer, NY 13077
|
1,388 sq. feet
|
1 baths 3 beds |
show details | |

|
#20
Center St
Mc Graw, NY 13101
|
1,305 sq. feet
|
1 baths 3 beds |
show details |
| Photo | Address | Area | Beds / Baths | Price | Details |
|---|---|---|---|---|---|

|
#21
Creal Rd
Homer, NY 13077
|
1,296 sq. feet
|
1 baths 3 beds |
show details | |

|
#22
Chapman Rd
Cortland, NY 13045
|
1,008 sq. feet
|
1 baths 2 beds |
show details | |

|
#23
Page Green Rd
Cortland, NY 13045
|
2,400 sq. feet
|
1 baths 4 beds |
show details | |

|
#24
Southworth Rd
Dryden, NY 13053
|
1,696 sq. feet
|
2 baths 3 beds |
show details | |

|
#25
Neimi Rd
Freeville, NY 13068
|
1,350 sq. feet
|
2 baths 3 beds |
show details | |

|
#26
State Route 41
Willet, NY 13863
|
2,040 sq. feet
|
1 baths 4 beds |
show details | |

|
#27
Route 91
Tully, NY 13159
|
1,344 sq. feet
|
2 baths 3 beds |
show details | |

|
#28
State Route 26
Willet, NY 13863
|
1,064 sq. feet
|
1 baths 2 beds |
show details | |

|
#29
Grandview Dr
Ithaca, NY 14850
|
1,540 sq. feet
|
3 baths 3 beds |
show details | |

|
#30
Slaterville Rd
Slaterville Springs, NY 14881
|
2,063 sq. feet
|
1 baths 3 beds |
show details |
| Photo | Address | Area | Beds / Baths | Price | Details |
|---|---|---|---|---|---|

|
#31
State Route 90
Locke, NY 13092
|
1,820 sq. feet
|
2 baths 3 beds |
show details | |

|
#32
State Route 23
Cincinnatus, NY 13040
|
2,136 sq. feet
|
2 baths 4 beds |
show details | |

|
#33
Goodman Rd
Groton, NY 13073
|
1,200 sq. feet
|
2 baths 3 beds |
show details | |

|
#34
Divers Xing
Marathon, NY 13803
|
2,288 sq. feet
|
2 baths 4 beds |
show details | |

|
#35
Sweeney Rd
Cortland, NY 13045
|
2,492 sq. feet
|
3 baths 4 beds |
show details | |

|
#36
Chestnut Ridge Rd
Moravia, NY 13118
|
1,680 sq. feet
|
2 baths 3 beds |
show details | |

|
#37
Bird Cemetery Rd
Locke, NY 13092
|
1,914 sq. feet
|
1 baths 3 beds |
show details | |

|
#38
Caswell Rd
Freeville, NY 13068
|
1,280 sq. feet
|
1 baths 3 beds |
show details | |

|
#39
Booth Rd
Locke, NY 13092
|
1,150 sq. feet
|
1 baths 3 beds |
show details | |

|
#40
Glen Haven Rd
Homer, NY 13077
|
1,025 sq. feet
|
1 baths 2 beds |
show details |
| Photo | Address | Area | Beds / Baths | Price | Details |
|---|---|---|---|---|---|

|
#41
Glen Haven Rd
Homer, NY 13077
|
1,025 sq. feet
|
1 baths 2 beds |
show details | |

|
#42
Glen Haven Rd
Homer, NY 13077
|
1,538 sq. feet
|
1 baths 2 beds |
show details | |

|
#43
Preble Rd
Preble, NY 13141
|
1,096 sq. feet
|
1 baths 3 beds |
show details | |

|
#44
Briarmeadow Rd
Cortland, NY 13045
|
1,760 sq. feet
|
2 baths 3 beds |
show details | |

|
#45
Davis Rd
Berkshire, NY 13736
|
1,600 sq. feet
|
1 baths 3 beds |
show details | |

|
#46
E Main St
Cortland, NY 13045
|
2,553 sq. feet
|
3 baths 4 beds |
show details | |

|
#47
Kellogg Rd
Cortland, NY 13045
|
1,008 sq. feet
|
1 baths 2 beds |
show details | |

|
#48
River St
Cortland, NY 13045
|
1,318 sq. feet
|
1 baths 3 beds |
show details | |

|
#49
Bellrose Ave
Cortland, NY 13045
|
1,050 sq. feet
|
1 baths 3 beds |
show details | |

|
Check over 1 million property listings on Foreclosure.com!
|
browse all offers | |||

Household type by relationship:
Households: 45,775- In family households: 35,501 (7,923 male householders, 3,566 female householders)
8,414 spouses, 12,392 children (11,458 natural, 293 adopted, 641 stepchildren), 716 grandchildren, 276 brothers or sisters, 268 parents, foster children, 269 other relatives, 1,498 non-relatives
- In nonfamily households: 10,274 (3,463 male householders (2,394 living alone)), 3,719 female householders (2,826 living alone)), 3,092 nonrelatives
- In group quarters: 3,561 (491 institutionalized population)
7,633 married couples with children.
2,910 single-parent households (808 men, 2,102 women).
95.7% of residents of Cortlandville speak English at home.
0.7% of residents speak Spanish at home (65% speak English very well, 22% speak English well, 13% speak English not well).
3.1% of residents speak other Indo-European language at home (67% speak English very well, 30% speak English well, 3% speak English not well).
0.5% of residents speak other language at home (100% speak English very well).
Foreign born population: 203 (2.5%)
(80.8% of them are naturalized citizens)
| Here: | 6.4 |
| State: | 6.3 |
| Here: | 4.8 |
| State: | 3.8 |
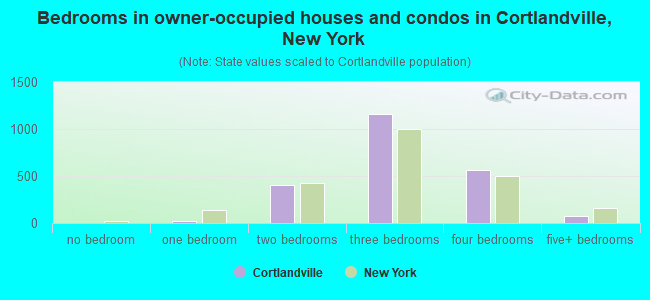
- Bedrooms in owner-occupied houses and condos in Cortlandville, New York
- 0no bedroom
- 221 bedroom
- 4022 bedrooms
- 1,1623 bedrooms
- 5684 bedrooms
- 775+ bedrooms
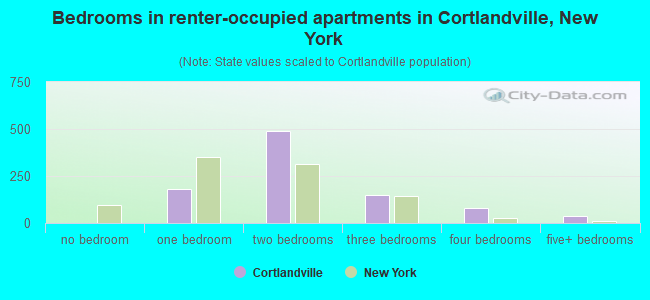
- Bedrooms in renter-occupied apartments in Cortlandville, New York
- 0no bedroom
- 1791 bedroom
- 4882 bedrooms
- 1513 bedrooms
- 784 bedrooms
- 395+ bedrooms
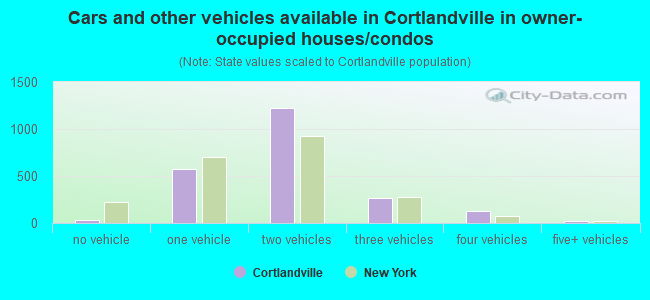
- Cars and other vehicles available in Cortlandville in owner-occupied houses/condos
- 28no vehicle
- 5701 vehicle
- 1,2192 vehicles
- 2643 vehicles
- 1294 vehicles
- 215+ vehicles
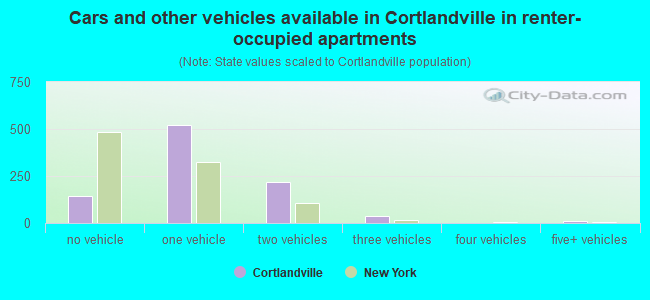
- Cars and other vehicles available in Cortlandville in renter-occupied apartments
- 144no vehicle
- 5211 vehicle
- 2182 vehicles
- 383 vehicles
- 24 vehicles
- 125+ vehicles
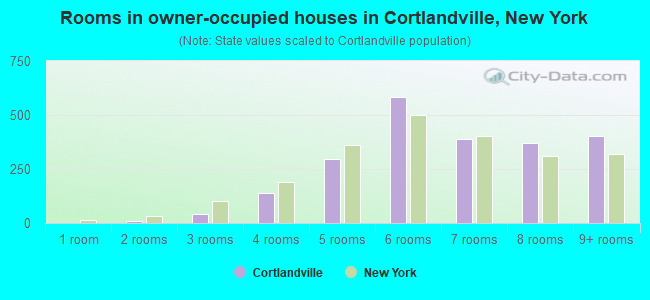
- Rooms in owner-occupied houses in Cortlandville, New York
- 01 room
- 82 rooms
- 403 rooms
- 1404 rooms
- 2985 rooms
- 5846 rooms
- 3887 rooms
- 3698 rooms
- 4049+ rooms
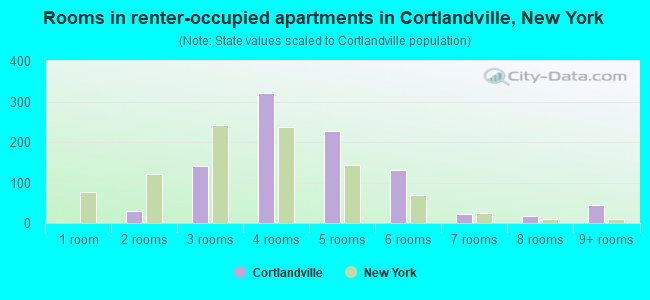
- Rooms in renter-occupied apartments in Cortlandville, New York
- 01 room
- 292 rooms
- 1413 rooms
- 3214 rooms
- 2275 rooms
- 1316 rooms
- 237 rooms
- 188 rooms
- 459+ rooms
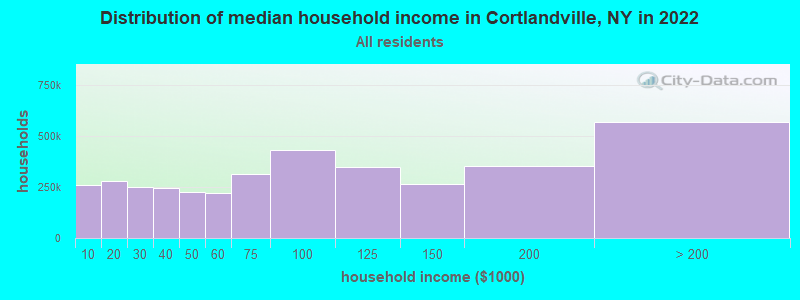
Cortlandville, NY household income distribution

- 275,289Less than $10,000
- 296,335$10,000 to $19,999
- 265,269$20,000 to $29,999
- 258,194$30,000 to $39,999
- 238,536$40,000 to $49,999
- 230,009$50,000 to $59,999
- 332,593$60,000 to $74,999
- 454,914$75,000 to $99,999
- 366,452$100,000 to $124,999
- 280,626$125,000 to $149,999
- 372,419$150,000 to $199,999
- 604,048$200,000 or more
Percentage of workers working in this county: 80.8%
Number of people working at home: 572 (13.8% of all workers)
Travel time to work (commute)
- Less than 5 minutes: 239
- 5 to 9 minutes: 796
- 10 to 14 minutes: 849
- 15 to 19 minutes: 528
- 20 to 24 minutes: 322
- 25 to 29 minutes: 59
- 30 to 34 minutes: 171
- 35 to 39 minutes: 85
- 40 to 44 minutes: 96
- 45 to 59 minutes: 243
- 60 to 89 minutes: 95
- 90 or more minutes: 50
Means of transportation to work:
- Drove a car alone: 2,928 (79.5%)
- Carpooled: 380 (10.3%)
- Bus or trolley bus: 25 (0.7%)
- Taxi: 57 (1.5%)
- Motorcycle: 5 (0.1%)
- Bicycle: 16 (0.4%)
- Walked: 113 (3.1%)
- Other means: 9 (0.2%)
- Worked at home: 150 (4.1%)
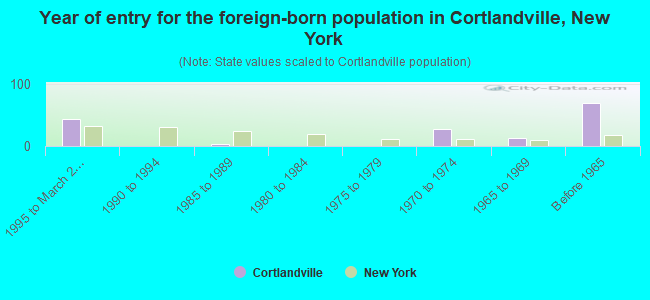
- Year of entry for the foreign-born population in Cortlandville, New York
- 431995 to March 2000
- 01990 to 1994
- 41985 to 1989
- 01980 to 1984
- 01975 to 1979
- 281970 to 1974
- 131965 to 1969
- 69Before 1965
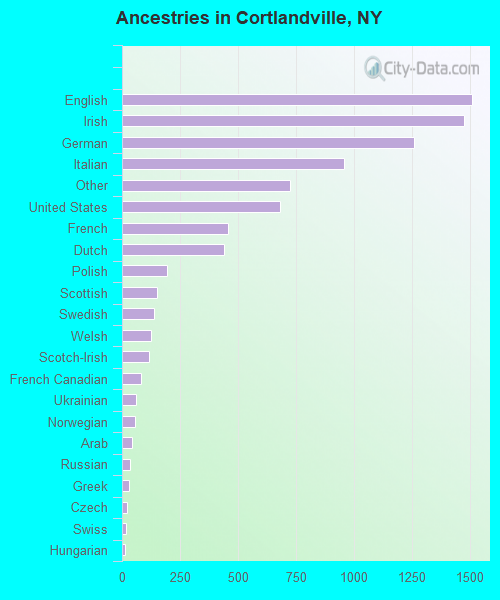
First ancestries reported:
- English: 1,507 (17.5%)
- Irish: 1,474 (17.1%)
- German: 1,259 (14.6%)
- Italian: 958 (11.1%)
- Other: 726 (8.4%)
- United States: 680 (7.9%)
- French: 456 (5.3%)
- Dutch: 439 (5.1%)
- Polish: 196 (2.3%)
- Scottish: 149 (1.7%)
- Swedish: 139 (1.6%)
- Welsh: 123 (1.4%)
- Scotch-Irish: 116 (1.3%)
- French Canadian: 81 (0.9%)
- Ukrainian: 60 (0.7%)
- Norwegian: 55 (0.6%)
- Arab: 41 (0.5%)
- Russian: 36 (0.4%)
- Greek: 29 (0.3%)
- Czech: 22 (0.3%)
- Swiss: 18 (0.2%)
- Hungarian: 14 (0.2%)
- Danish: 13 (0.2%)
- West Indian: 9 (0.1%)
- Slovak: 8 (0.09%)
- Portuguese: 7 (0.08%)
Most common places of birth for foreign-born residents (%):
| Cortlandville: | 22.9% (36) |
| New York: | 2.1% (82,238) |
| Cortlandville: | 19.7% (31) |
| New York: | 3.8% (147,729) |
| Cortlandville: | 18.5% (29) |
| New York: | 1.8% (69,327) |
| Cortlandville: | 10.2% (16) |
| New York: | 1.4% (54,876) |
| Cortlandville: | 9.6% (15) |
| New York: | 1.6% (62,237) |
| Cortlandville: | 7.0% (11) |
| New York: | 1.9% (72,408) |
| Cortlandville: | 5.7% (9) |
| New York: | 0.2% (9,275) |
| Cortlandville: | 3.8% (6) |
| New York: | 0.2% (7,531) |
| Cortlandville: | 2.5% (4) |
| New York: | 1.1% (42,335) |
Place of birth for U.S.-born residents:
- This state: 6,587
- Other state: 1,120
- Northeast: 489
- Midwest: 272
- South: 285
- West: 74
58% of Cortlandville residents lived in the same house 5 years ago.
Out of people who lived in different houses, 73% lived in this county.
Out of people who lived in different counties, 69% lived in New York.
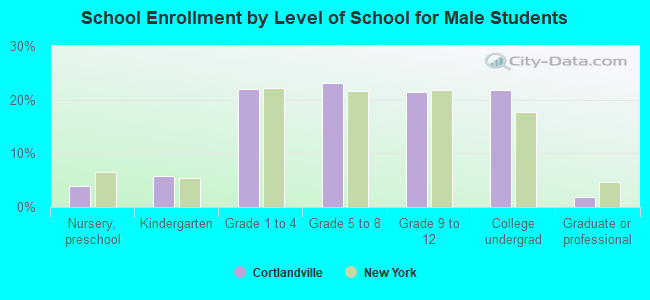
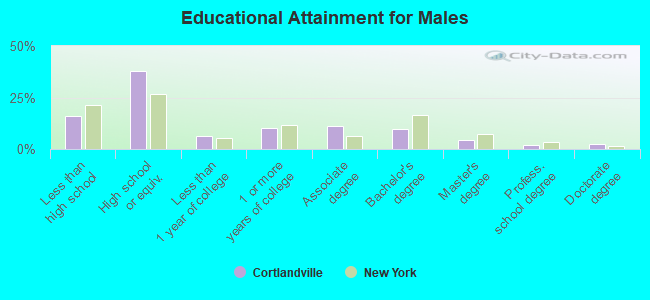
Education attainment for males 25 years and older:
- No schooling: 27
- Nursery to 4th grade: 2
- 5th and 6th grade: 15
- 7th and 8th grade: 88
- 9th grade: 43
- 10th grade: 76
- 11th grade: 89
- 12th grade, no diploma: 66
- High school graduate (or equivalency): 972
- Less than 1 year of college: 166
- Some college more than 1 year, no degree: 266
- Associate degree: 280
- Bachelor's degree: 250
- Master's degree: 107
- Professional school degree: 47
- Doctorate degree: 68
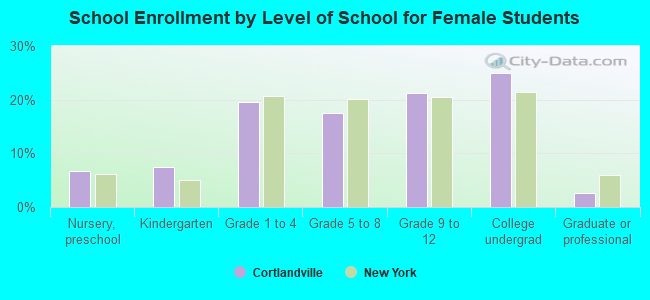
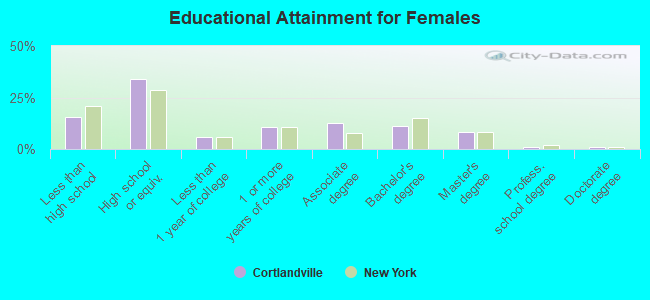
Education attainment for females 25 years and older:
- No schooling: 29
- Nursery to 4th grade: 13
- 5th and 6th grade: 17
- 7th and 8th grade: 45
- 9th grade: 77
- 10th grade: 87
- 11th grade: 60
- 12th grade, no diploma: 105
- High school graduate (or equivalency): 936
- Less than 1 year of college: 167
- Some college more than 1 year, no degree: 299
- Associate degree: 354
- Bachelor's degree: 304
- Master's degree: 223
- Professional school degree: 30
- Doctorate degree: 27


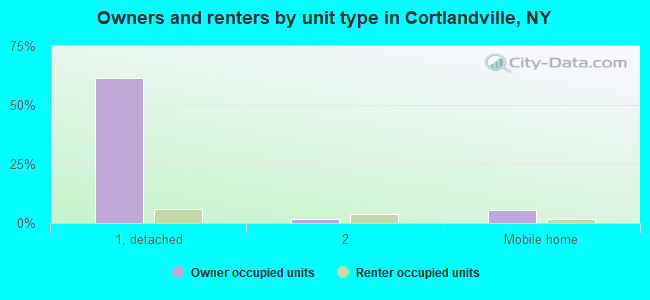
Housing units in structures:
- One, detached: 2,231
- One, attached: 37
- Two: 199
- 3 or 4: 203
- 5 to 9: 211
- 10 to 19: 238
- 20 to 49: 7
- 50 or more: 11
- Mobile homes: 294
Median worth of mobile homes: $48,679
Housing units lacking complete kitchen facilities: 1.2%
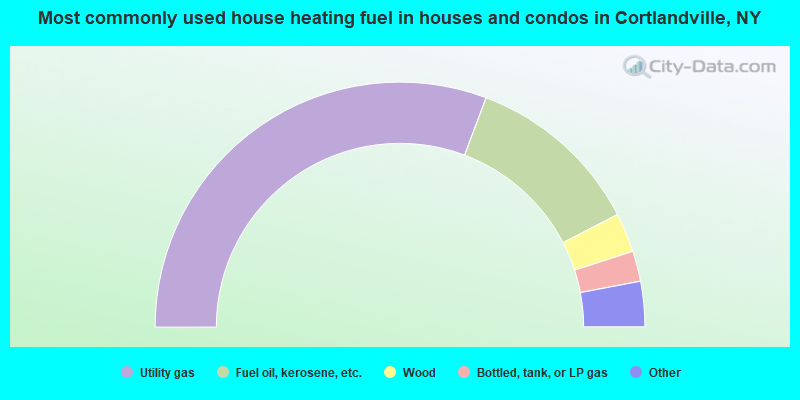
- 61.5%Utility gas
- 23.4%Fuel oil, kerosene, etc.
- 5.2%Wood
- 4.0%Bottled, tank, or LP gas
- 3.6%Electricity
- 1.3%Other fuel
- 1.1%Coal or coke
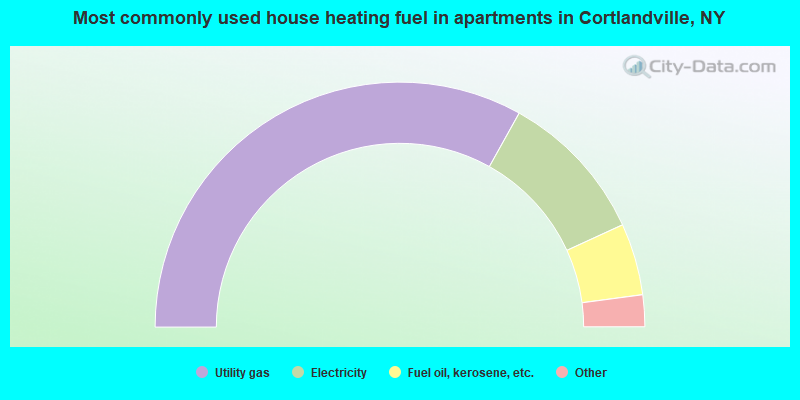
- 66.2%Utility gas
- 20.1%Electricity
- 9.5%Fuel oil, kerosene, etc.
- 2.0%Wood
- 1.5%Bottled, tank, or LP gas
- 0.6%Other fuel
Private vs. public school enrollment:
| Here: | 13.7% |
| New York: | 14.0% |
| Here: | 1.2% |
| New York: | 13.2% |
| Here: | 6.0% |
| New York: | 38.2% |