Covington, WA (Washington) Houses and Residents
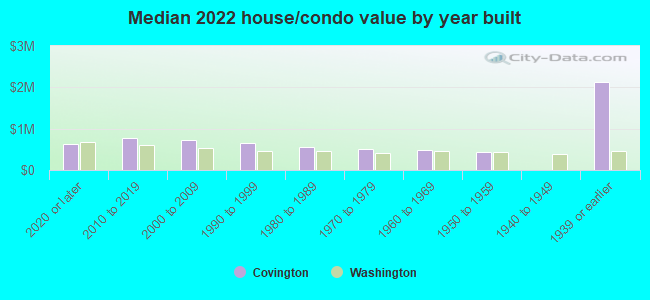
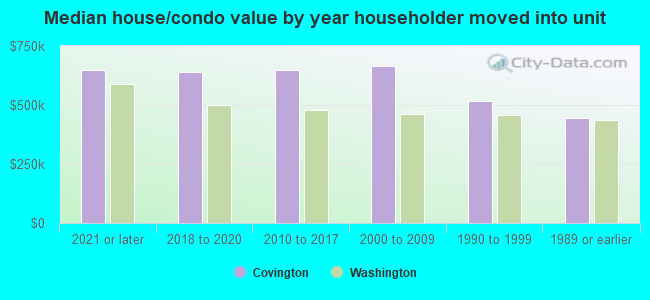
Estimated median house or condo value in 2022: $618,316 (it was $162,700 in 2000 )
Covington:
$618,316Washington:
$569,500
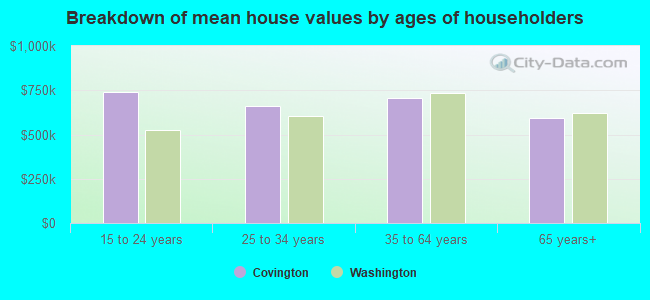
Lower value quartile - upper value quartile: $489,656 - $785,654Mean price in 2022: Detached houses: $657,049 Here:
$657,049State:
$734,307
Townhouses or other attached units: $562,366 Here:
$562,366State:
$657,697
Mobile homes: $3,332,370 Here:
$3,332,370State:
$218,362
Total population: 19,134 (Urban population: 13,768, Rural population: 0)
Houses: 7,798 (7,545 occupied: 6,118 owner occupied, 1,417 renter occupied )
% of renters here:
19%State:
36%
Housing density: 1,352 houses/condos per square mile
Median price asked for vacant for-sale houses and condos in 2022: $1,660,985.
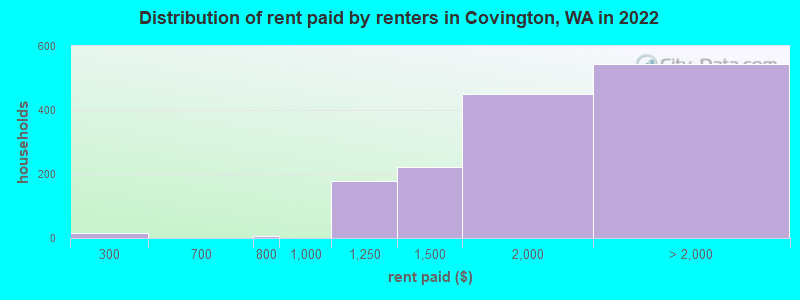
Median contract rent in 2022: $1,805 (lower quartile is $1,421, upper quartile is over $2,000)
Median rent asked for vacant for-rent units in 2022: $9,987
Median gross rent in Covington, WA in 2022: over $2,000
Housing units in Covington with a mortgage: 4,807 (601 second mortgage, 0 home equity loan, 520 both second mortgage and home equity loan )Houses without a mortgage: 205
Median household income for houses/condos with a mortgage: $139,029
Median household income for apartments without a mortgage: $117,200
Median monthly housing costs: $2,118
Data:
Median house or condo value ($)
Median house or condo value ($ change since 2000)
Median house or condo value ($) - White
Median house or condo value ($) - Black or African American
Median house or condo value ($) - Asian
Median house or condo value ($) - Hispanic or Latino
Median house or condo value ($) - American Indian and Alaska Native
Median house or condo value ($) - Multirace
Median house or condo value ($) - Other Race
Median price asked for mobile homes ($)
Household density (households per square mile)
Mean house or condo value by units in structure - 1, detached ($)
Mean house or condo value by units in structure - 1, attached ($)
Mean house or condo value by units in structure - 2 ($)
Mean house or condo value by units in structure by units in structure - 3 or 4 ($)
Mean house or condo value by units in structure - 5 or more ($)
Mean house or condo value by units in structure - Boat, RV, van, etc. ($)
Mean house or condo value by units in structure - Mobile home ($)
Median contract rent ($)
Median contract rent - Lower quartile ($)
Median contract rent - Upper quartile ($)
Median gross rent ($)
Urban houses (%)
Rural houses (%)
Houses occupied (%)
Houses occupied (% change since 2000)
Houses owner occupied (%)
Houses owner occupied (% change since 2000)
Houses renter occupied (%)
Houses renter occupied (% change since 2000)
Vacant housing units - For rent (%)
Vacant housing units - For rent (% change since 2000)
Vacant housing units - For sale only (%)
Vacant housing units - For sale only (% change since 2000)
Vacant housing units - Rented or sold, not occupied (%)
Vacant housing units - Rented or sold, not occupied (% change since 2000)
Vacant housing units - For seasonal, recreational, or occasional use (%)
Vacant housing units - For seasonal, recreational, or occasional use (% change since 2000)
Vacant housing units - For migrant workers (%)
Vacant housing units - For migrant workers (% change since 2000)
Vacant housing units - Other vacant (%)
Vacant housing units - Other vacant (% change since 2000)
Median monthly housing costs ($)
Median household income for houses/condos with a mortgage ($)
Median household income for houses/condos without a mortgage ($)
Median household income ($)
Median household income ($) - White
Median household income ($) - Black or African American
Median household income ($) - Asian
Median household income ($) - Hispanic or Latino
Median household income ($) - American Indian and Alaska Native
Median household income ($) - Multirace
Median household income ($) - Other Race
Mortgage status - with mortgage (%)
Mortgage status - with second mortgage (%)
Mortgage status - with home equity loan (%)
Mortgage status - with both second mortgage and home equity loan (%)
Mortgage status - without a mortgage (%)
Median year house/condo built
Median year apartment built
Household type by relationship - Male householder living alone (%)
Household type by relationship - Male householder not living alone (%)
Household type by relationship - Female householder living alone (%)
Household type by relationship - Female householder not living alone (%)
Household type by relationship - Opposite-Sex spouse (%)
Household type by relationship - Same-Sex spouse (%)
Household type by relationship - Opposite-Sex unmarried partner (%)
Household type by relationship - Same-Sex unmarried partner (%)
Household type by relationship - In group quarters (%)
Size of family households - 2-person household (%)
Size of family households - 3-person household (%)
Size of family households - 4-person household (%)
Size of family households - 5-person household (%)
Size of family households - 6-person household (%)
Size of family households - 7-or-more-person household (%)
Size of nonfamily households - 1-person household (%)
Size of nonfamily households - 2-person household (%)
Size of nonfamily households - 3-person household (%)
Size of nonfamily households - 4-person household (%)
Size of nonfamily households - 5-person household (%)
Size of nonfamily households - 6-person household (%)
Size of nonfamily households - 7-or-moreperson household (%)
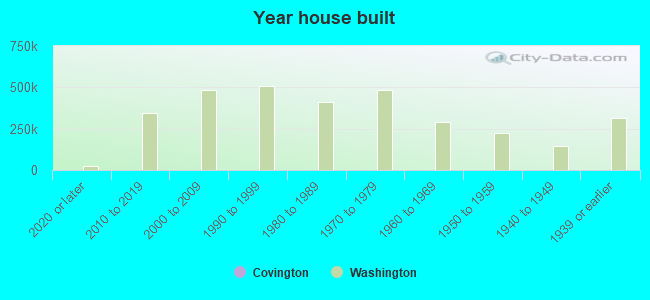
Year house built - Built 2010 or later (%)
Year house built - Built 2000 to 2009 (%)
Year house built - Built 1990 to 1999 (%)
Year house built - Built 1980 to 1989 (%)
Year house built - Built 1970 to 1979 (%)
Year house built - Built 1960 to 1969 (%)
Year house built - Built 1950 to 1959 (%)
Year house built - Built 1940 to 1949 (%)
Year house built - Built 1939 or earlier (%)
Median number of rooms in houses and condos
Median number of rooms in apartments
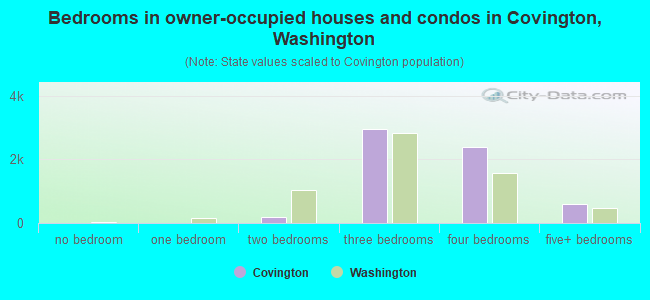
Median number of bedrooms in owner occupied houses
Mean number of bedrooms in owner occupied houses
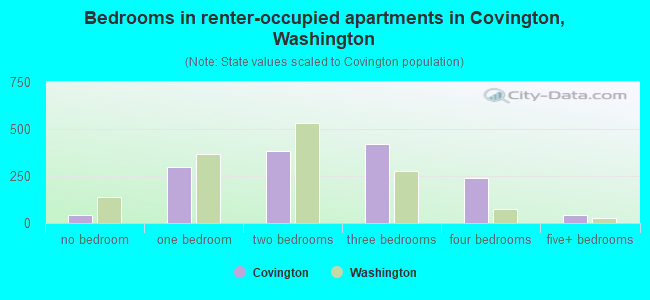
Median number of bedrooms in renter occupied houses
Mean number of bedrooms in renter occupied houses
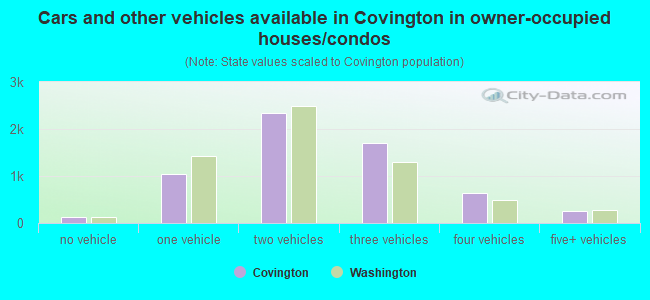
Median number of vehichles in owner occupied houses
Mean number of vehichles in owner occupied houses
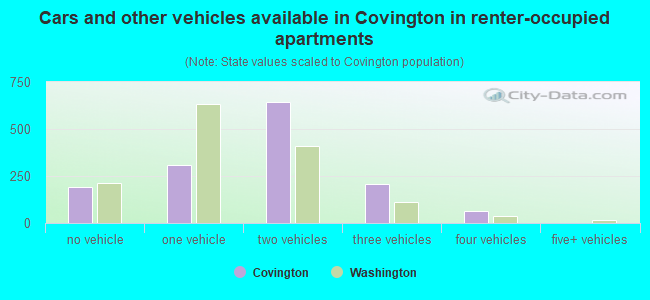
Median number of vehichles in renter occupied houses
Mean number of vehichles in renter occupied houses
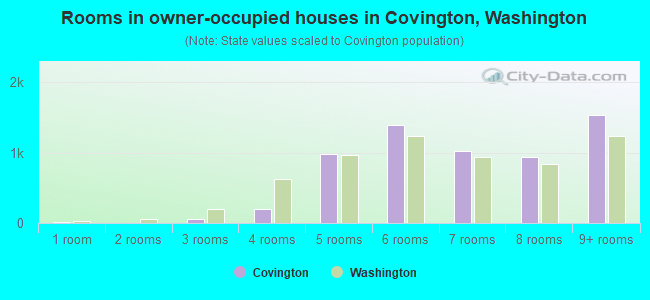
Rooms in owner-occupied houses - 1 room (%)
Rooms in owner-occupied houses - 2 rooms (%)
Rooms in owner-occupied houses - 3 rooms (%)
Rooms in owner-occupied houses - 4 rooms (%)
Rooms in owner-occupied houses - 5 rooms (%)
Rooms in owner-occupied houses - 6 rooms (%)
Rooms in owner-occupied houses - 7 rooms (%)
Rooms in owner-occupied houses - 8 rooms (%)
Rooms in owner-occupied houses - 9+ rooms (%)
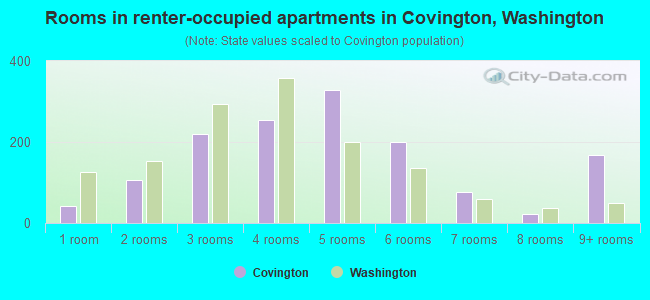
Rooms in renter-occupied houses - 1 room (%)
Rooms in renter-occupied houses - 2 rooms (%)
Rooms in renter-occupied houses - 3 rooms (%)
Rooms in renter-occupied houses - 4 rooms (%)
Rooms in renter-occupied houses - 5 rooms (%)
Rooms in renter-occupied houses - 6 rooms (%)
Rooms in renter-occupied houses - 7 rooms (%)
Rooms in renter-occupied houses - 8 rooms (%)
Rooms in renter-occupied houses - 9+ rooms (%)
Bedrooms in owner-occupied houses - no bedrooms (%)
Bedrooms in owner-occupied houses - 1 bedroom (%)
Bedrooms in owner-occupied houses - 2 bedrooms (%)
Bedrooms in owner-occupied houses - 3 bedrooms (%)
Bedrooms in owner-occupied houses - 4 bedrooms (%)
Bedrooms in owner-occupied houses - 5+ bedrooms (%)
Bedrooms in renter-occupied houses - no bedrooms (%)
Bedrooms in renter-occupied houses - 1 bedroom (%)
Bedrooms in renter-occupied houses - 2 bedrooms (%)
Bedrooms in renter-occupied houses - 3 bedrooms (%)
Bedrooms in renter-occupied houses - 4 bedrooms (%)
Bedrooms in renter-occupied houses - 5+ bedrooms (%)
Vehicles available in owner-occupied houses - no vehicle available (%)
Vehicles available in owner-occupied houses - 1 vehicle available(%)
Vehicles available in owner-occupied houses - 2 Vehicles available (%)
Vehicles available in owner-occupied houses - 3 Vehicles available (%)
Vehicles available in owner-occupied houses - 4 Vehicles available (%)
Vehicles available in owner-occupied houses - 5+ Vehicles available (%)
Vehicles available in renter-occupied houses - no vehicle available (%)
Vehicles available in renter-occupied houses - 1 vehicle available (%)
Vehicles available in renter-occupied houses - 2 Vehicles available (%)
Vehicles available in renter-occupied houses - 3 Vehicles available (%)
Vehicles available in renter-occupied houses - 4 Vehicles available (%)
Vehicles available in renter-occupied houses - 5+ Vehicles available (%)
Housing units in structures - 1, detached (%)
Housing units in structures - 1, attached (%)
Housing units in structures - 2 (%)
Housing units in structures - 3 or 4 (%)
Housing units in structures - 5 to 9 (%)
Housing units in structures - 10 to 19 (%)
Housing units in structures - 20 to 49 (%)
Housing units in structures - 50 or more (%)
Housing units in structures - Mobile home (%)
Housing units in structures - Boat, RV, van, etc. (%)
Housing units in structures - Owners - 1, detached (%)
Housing units in structures - Owners - 1, attached (%)
Housing units in structures - Owners - 2 (%)
Housing units in structures - Owners - 3 or 4 (%)
Housing units in structures - Owners - 5 to 9 (%)
Housing units in structures - Owners - 10 to 19 (%)
Housing units in structures - Owners - 20 to 49 (%)
Housing units in structures - Owners - 50 or more (%)
Housing units in structures - Owners - Mobile home (%)
Housing units in structures - Owners - Boat, RV, van, etc. (%)
Housing units in structures - Renters - 1, detached (%)
Housing units in structures - Renters - 1, attached (%)
Housing units in structures - Renters - 2 (%)
Housing units in structures - Renters - 3 or 4 (%)
Housing units in structures - Renters - 5 to 9 (%)
Housing units in structures - Renters - 10 to 19 (%)
Housing units in structures - Renters - 20 to 49 (%)
Housing units in structures - Renters - 50 or more (%)
Housing units in structures - Renters - Mobile home (%)
Housing units in structures - Renters - Boat, RV, van, etc. (%)
House/condo owner moved in on average (years ago)
Renter moved in on average (years ago)
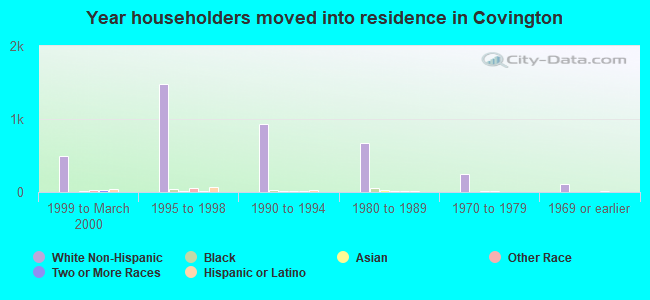
Year householder moved into unit - Moved in 1999 to March 2000 (%)
Year householder moved into unit - Moved in 1999 to March 2000 (%) - White
Year householder moved into unit - Moved in 1999 to March 2000 (%) - Black or African American
Year householder moved into unit - Moved in 1999 to March 2000 (%) - Asian
Year householder moved into unit - Moved in 1999 to March 2000 (%) - Hispanic or Latino
Year householder moved into unit - Moved in 1999 to March 2000 (%) - American Indian and Alaska Native
Year householder moved into unit - Moved in 1999 to March 2000 (%) - Multirace
Year householder moved into unit - Moved in 1999 to March 2000 (%) - Other Race
Year householder moved into unit - Moved in 1995 to 1998 (%)
Year householder moved into unit - Moved in 1995 to 1998 (%) - White
Year householder moved into unit - Moved in 1995 to 1998 (%) - Black or African American
Year householder moved into unit - Moved in 1995 to 1998 (%) - Asian
Year householder moved into unit - Moved in 1995 to 1998 (%) - Hispanic or Latino
Year householder moved into unit - Moved in 1995 to 1998 (%) - American Indian and Alaska Native
Year householder moved into unit - Moved in 1995 to 1998 (%) - Multirace
Year householder moved into unit - Moved in 1995 to 1998 (%) - Other Race
Year householder moved into unit - Moved in 1990 to 1994 (%)
Year householder moved into unit - Moved in 1990 to 1994 (%) - White
Year householder moved into unit - Moved in 1990 to 1994 (%) - Black or African American
Year householder moved into unit - Moved in 1990 to 1994 (%) - Asian
Year householder moved into unit - Moved in 1990 to 1994 (%) - Hispanic or Latino
Year householder moved into unit - Moved in 1990 to 1994 (%) - American Indian and Alaska Native
Year householder moved into unit - Moved in 1990 to 1994 (%) - Multirace
Year householder moved into unit - Moved in 1990 to 1994 (%) - Other Race
Year householder moved into unit - Moved in 1980 to 1989 (%)
Year householder moved into unit - Moved in 1980 to 1989 (%) - White
Year householder moved into unit - Moved in 1980 to 1989 (%) - Black or African American
Year householder moved into unit - Moved in 1980 to 1989 (%) - Asian
Year householder moved into unit - Moved in 1980 to 1989 (%) - Hispanic or Latino
Year householder moved into unit - Moved in 1980 to 1989 (%) - American Indian and Alaska Native
Year householder moved into unit - Moved in 1980 to 1989 (%) - Multirace
Year householder moved into unit - Moved in 1980 to 1989 (%) - Other Race
Year householder moved into unit - Moved in 1970 to 1979 (%)
Year householder moved into unit - Moved in 1970 to 1979 (%) - White
Year householder moved into unit - Moved in 1970 to 1979 (%) - Black or African American
Year householder moved into unit - Moved in 1970 to 1979 (%) - Asian
Year householder moved into unit - Moved in 1970 to 1979 (%) - Hispanic or Latino
Year householder moved into unit - Moved in 1970 to 1979 (%) - American Indian and Alaska Native
Year householder moved into unit - Moved in 1970 to 1979 (%) - Multirace
Year householder moved into unit - Moved in 1970 to 1979 (%) - Other Race
Year householder moved into unit - Moved in 1969 or earlier (%)
Year householder moved into unit - Moved in 1969 or earlier (%) - White
Year householder moved into unit - Moved in 1969 or earlier (%) - Black or African American
Year householder moved into unit - Moved in 1969 or earlier (%) - Asian
Year householder moved into unit - Moved in 1969 or earlier (%) - Hispanic or Latino
Year householder moved into unit - Moved in 1969 or earlier (%) - American Indian and Alaska Native
Year householder moved into unit - Moved in 1969 or earlier (%) - Multirace
Year householder moved into unit - Moved in 1969 or earlier (%) - Other Race
Housing units lacking complete plumbing facilities (%)
Housing units lacking complete kitchen facilities (%)
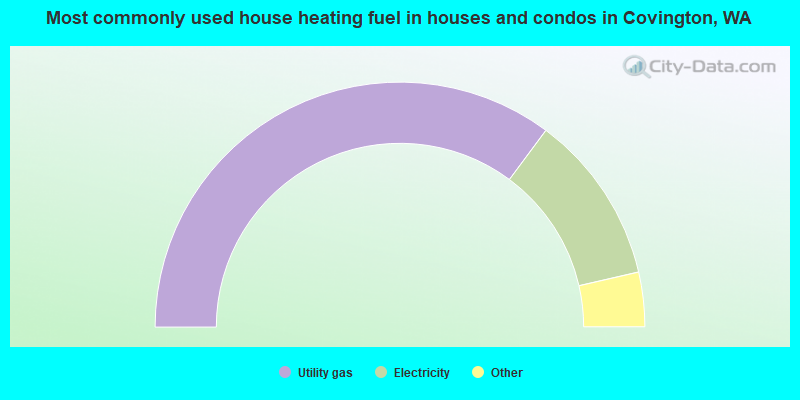
House heating fuel used in houses and condos - Utility gas (%)
House heating fuel used in houses and condos - Bottled, tank, or LP gas (%)
House heating fuel used in houses and condos - Electricity (%)
House heating fuel used in houses and condos - Fuel oil, kerosene, etc. (%)
House heating fuel used in houses and condos - Coal or coke (%)
House heating fuel used in houses and condos - Wood (%)
House heating fuel used in houses and condos - Solar energy (%)
House heating fuel used in houses and condos - Other fuel (%)
House heating fuel used in houses and condos - No fuel used (%)
House heating fuel used in apartments - Utility gas (%)
House heating fuel used in apartments - Bottled, tank, or LP gas (%)
House heating fuel used in apartments - Electricity (%)
House heating fuel used in apartments - Fuel oil, kerosene, etc. (%)
House heating fuel used in apartments - Coal or coke (%)
House heating fuel used in apartments - Wood (%)
House heating fuel used in apartments - Solar energy (%)
House heating fuel used in apartments - Other fuel (%)
House heating fuel used in apartments - No fuel used (%)
Latest news about housing in Covington, WA collected exclusively by city-data.com from local newspapers, TV, and radio stations
Median year house/condo built: 1992Median year apartment built: 2001Household type by relationship:
Households: 20,928
Male householders: 3,901 (681 living alone ), Female householders: 3,444 (697 living alone )4,509 spouses (4,483 opposite-sex spouses ), 556 unmarried partners , (556 opposite-sex unmarried partners ), 6,470 children (6,230 natural , 19 adopted , 221 stepchildren ), 422 grandchildren , 263 brothers or sisters , 214 parents , 12 foster children , 370 other relatives , 732 non-relatives In group quarters: 32
Size of family households: 1,960 2-persons , 1,268 3-persons , 1,523 4-persons , 390 5-persons , 216 6-persons , 93 7-or-more-persons .
Size of nonfamily households: 1,483 1-person , 378 2-persons , 43 3-persons , 34 4-persons , 3 5-persons .
3,512 married couples with children. single-parent households (212 men , 828 women ).
74.5% of residents of Covington speak English at home. of residents speak Spanish at home (80% speak English very well , 6% speak English well , 14% speak English not well ).of residents speak other Indo-European language at home (71% speak English very well , 21% speak English well , 6% speak English not well , 2% don't speak English at all ).of residents speak Asian or Pacific Island language at home (60% speak English very well , 22% speak English well , 14% speak English not well , 3% don't speak English at all ).of residents speak other language at home (87% speak English very well , 8% speak English well , 5% speak English not well ).
Foreign born population: 3,623 (17.3%)of them are naturalized citizens )
Median number of rooms in houses and condos:
Median number of rooms in apartments
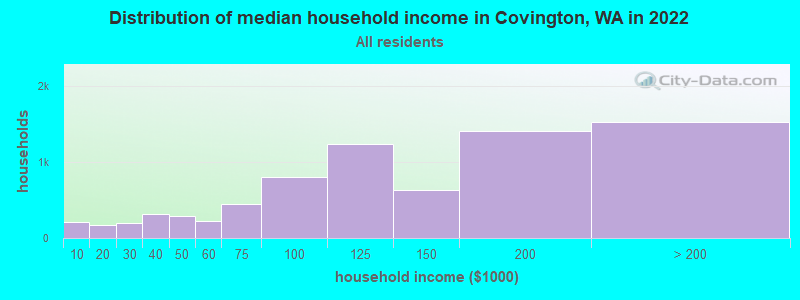
Covington, WA household income distribution 215 Less than $10,000166 $10,000 to $19,999194 $20,000 to $29,999319 $30,000 to $39,999285 $40,000 to $49,999222 $50,000 to $59,999448 $60,000 to $74,999809 $75,000 to $99,9991,242 $100,000 to $124,999631 $125,000 to $149,9991,417 $150,000 to $199,9991,531 $200,000 or more
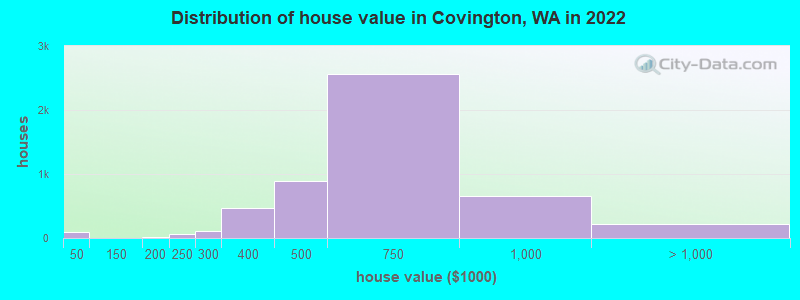
Home value of owner - occupied houses in 2022 in Covington, WA 70 Less than $10,0005 $25,000 to $29,99923 $30,000 to $34,9997 $150,000 to $174,99911 $175,000 to $199,99956 $200,000 to $249,999105 $250,000 to $299,999470 $300,000 to $399,999891 $400,000 to $499,9992,569 $500,000 to $749,999660 $750,000 to $999,99998 $1,000,000 to $1,499,999114 $2,000,000 or moreRent paid by renters in 2022 in Covington, WA 14 $200 to $2496 $750 to $799176 $1,000 to $1,249222 $1,250 to $1,499449 $1,500 to $1,999310 $2,000 to $2,499133 $2,500 to $2,99948 $3,000 to $3,49952 No cash rent
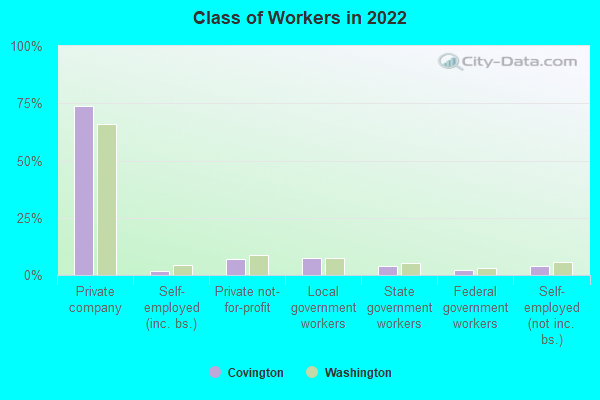
Percentage of workers working in this county: 94.3%Number of people working at home: 1,957 (17.5% of all workers )
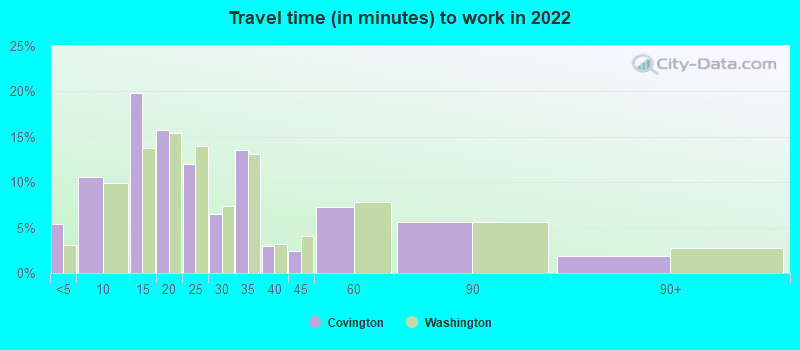
Travel time to work (commute)
Less than 5 minutes: 2325 to 9 minutes: 36610 to 14 minutes: 54915 to 19 minutes: 47020 to 24 minutes: 84125 to 29 minutes: 63930 to 34 minutes: 1,77435 to 39 minutes: 63840 to 44 minutes: 69245 to 59 minutes: 1,28160 to 89 minutes: 76790 or more minutes: 204
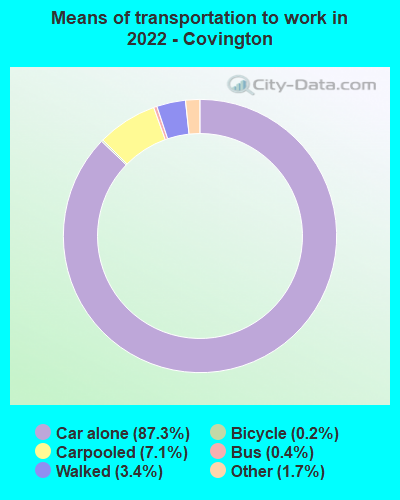
Means of transportation to work:
Drove a car alone: 4,384 (65.8%)Carpooled: 344 (5.2%)Bus : 11 (0.2%)Taxi: 75 (1.1%)Bicycle: 9 (0.1%)Walked: 150 (2.2%)Worked at home: 1,957 (29.4%)
Unemployment by race in 2022
Unemployment rate for White non-Hispanic residents 2.9% Males2.1% FemalesUnemployment rate for American Indian and Alaska Native residents 100.0% FemalesUnemployment rate for Asian residents 4.6% MalesUnemployment rate for other race residents 4.2% MalesUnemployment rate for two or more race residents 13.4% MalesUnemployment rate for Hispanic or Latino residents 1.9% Males8.3% Females
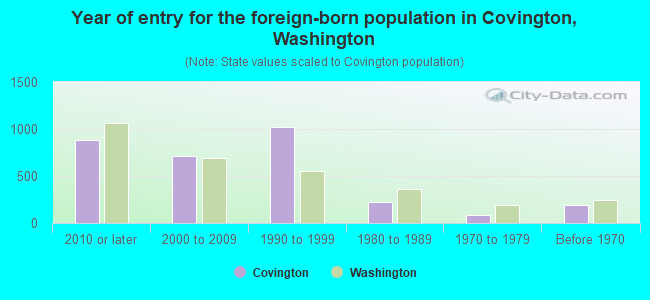
Year of entry for the foreign-born population in Covington, Washington
888 2010 or later 710 2000 to 2009 1,025 1990 to 1999 219 1980 to 1989 90 1970 to 1979 187 Before 1970
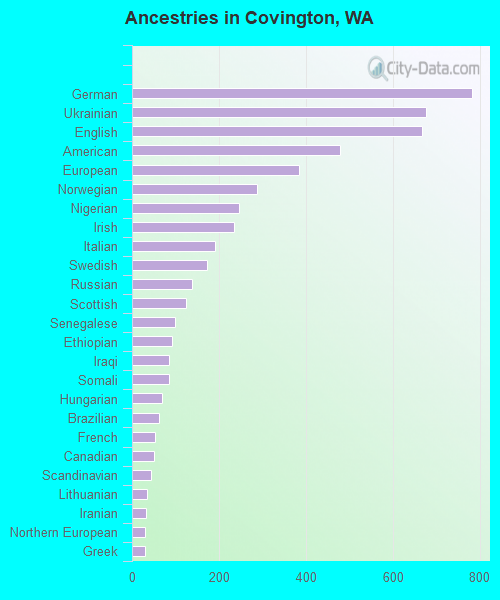
First ancestries reported:
German: 782 (8.0%)
Ukrainian: 676 (6.9%)
English: 666 (6.8%)
American: 479 (4.9%)
European: 383 (3.9%)
Norwegian: 288 (3.0%)
Nigerian: 245 (2.5%)
Irish: 235 (2.4%)
Italian: 191 (2.0%)
Swedish: 173 (1.8%)
Russian: 138 (1.4%)
Scottish: 125 (1.3%)
Senegalese: 99 (1.0%)
Ethiopian: 92 (0.9%)
Iraqi: 86 (0.9%)
Somali: 85 (0.9%)
Hungarian: 69 (0.7%)
Brazilian: 61 (0.6%)
French: 53 (0.5%)
Canadian: 51 (0.5%)
Scandinavian: 43 (0.4%)
Lithuanian: 35 (0.4%)
Iranian: 33 (0.3%)
Northern European: 31 (0.3%)
Greek: 30 (0.3%)
Scotch-Irish: 29 (0.3%)
Polish: 25 (0.3%)
African: 25 (0.3%)
Dutch: 22 (0.2%)
Danish: 22 (0.2%)
Croatian: 19 (0.2%)
Welsh: 19 (0.2%)
Eastern European: 18 (0.2%)
British: 13 (0.1%)
Finnish: 9 (0.09%)
French Canadian: 8 (0.08%)
Estonian: 6 (0.06%)
Lebanese: 4 (0.04%) Most common places of birth for foreign-born residents (%): Philippines Covington:
19.9% (721)Washington:
6.3% (71,661)
India Covington:
12.9% (467)Washington:
8.9% (101,353)
Ukraine Covington:
9.9% (357)Washington:
3.1% (35,872)
China, excluding Hong Kong and Taiwan Covington:
5.8% (211)Washington:
7.4% (84,470)
Mexico Covington:
5.8% (209)Washington:
21.1% (241,655)
Hong Kong Covington:
4.1% (147)Washington:
0.8% (8,785)
Vietnam Covington:
3.9% (141)Washington:
5.4% (62,003)
Canada Covington:
3.6% (131)Washington:
4.1% (47,238)
Russia Covington:
2.7% (98)Washington:
1.9% (21,540)
Belarus Covington:
2.4% (86)Washington:
0.4% (4,177)
Iraq Covington:
2.4% (86)Washington:
0.5% (6,259)
Ethiopia Covington:
2.3% (82)Washington:
1.6% (17,938)
Other Eastern Africa Covington:
2.1% (76)Washington:
0.1% (1,599)
Nigeria Covington:
1.9% (69)Washington:
0.2% (2,660)
Japan Covington:
1.8% (64)Washington:
1.5% (17,453)
Place of birth for U.S.-born residents:
This state: 10,309Other state: 6,365Northeast: 563Midwest: 1,349South: 931West: 3,513 85.1% of Covington residents lived in the same house 1 years ago.
Out of people who lived in different houses, 47.4% lived in this county.
Out of people who lived in different counties, 62.3% lived in Washington.
Covington:
85.1%State average:
85.2%
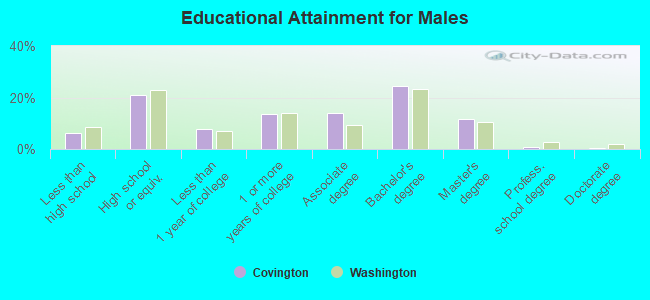
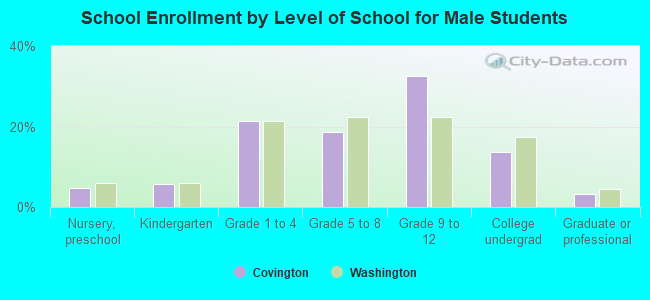
Education attainment for males 25 years and older:
No schooling: 97Nursery to 4th grade: 05th and 6th grade: 267th and 8th grade: 129th grade: 1210th grade: 3511th grade: 1512th grade, no diploma: 226High school graduate (or equivalency): 1,448Less than 1 year of college: 533Some college more than 1 year, no degree: 947Associate degree: 970Bachelor's degree: 1,685Master's degree: 807Professional school degree: 54Doctorate degree: 36
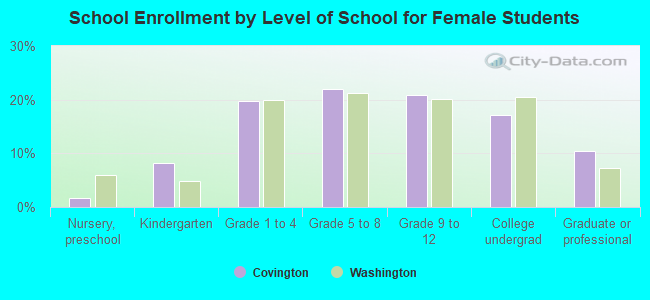
Education attainment for females 25 years and older:
No schooling: 59Nursery to 4th grade: 05th and 6th grade: 37th and 8th grade: 149th grade: 1610th grade: 9111th grade: 2412th grade, no diploma: 224High school graduate (or equivalency): 1,588Less than 1 year of college: 601Some college more than 1 year, no degree: 1,302Associate degree: 837Bachelor's degree: 1,619Master's degree: 533Professional school degree: 93Doctorate degree: 22
Housing units in structures:
One, detached: 6,895One, attached: 48Two: 73 or 4: 235 to 9: 6310 to 19: 20320 to 49: 11950 or more: 334Mobile homes: 92Boats, RVs, vans, etc.: 10Housing units lacking complete plumbing facilities in 2022: 0.5%Housing units lacking complete kitchen facilities in 2022: 0.5%House/condo owner moved in on average 10 years ago
Renter moved in on average 6 years ago
Private vs. public school enrollment:
Students in private schools in grades 1 to 8 (elementary and middle school): 316 Here:
15.3%Washington:
12.4%
Students in private schools in grades 9 to 12 (high school): 49 Students in private undergraduate colleges: 122 Here:
15.7%Washington:
16.5%