Dallas, TX (Texas) Houses and Residents
| Dallas: | $320,400 |
| Texas: | $275,400 |
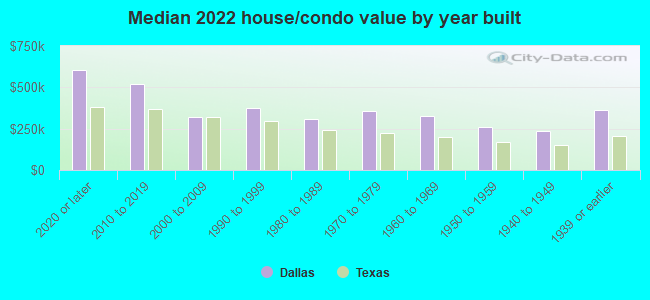
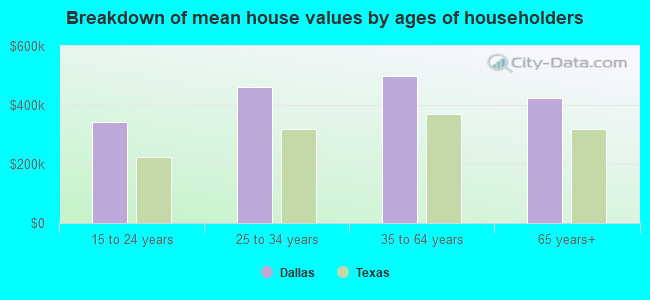
Mean price in 2022:
Detached houses: $504,900
Here: $504,900 State: $369,058 Townhouses or other attached units: $442,341
Here: $442,341 State: $327,631 In 2-unit structures: $344,076
Here: $344,076 State: $374,947 In 3-to-4-unit structures: $258,595
Here: $258,595 State: $209,652 In 5-or-more-unit structures: $436,290
Here: $436,290 State: $413,944 Mobile homes: $80,730
Here: $80,730 State: $124,413 Occupied boats, RVs, vans, etc.: $482,263
Here: $482,263 State: $73,921
Total population: 1,281,047 (Urban population: 1,185,405, Rural population: 2,799 (25 farm, 2,774 nonfarm))
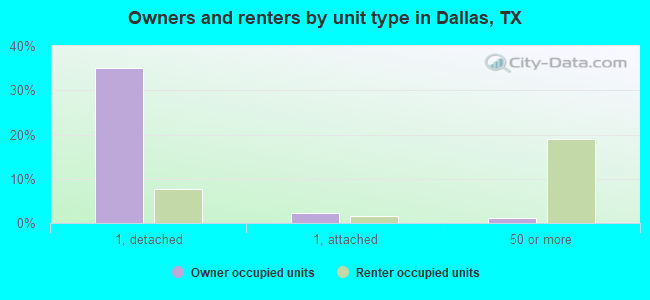
Houses: 587,984 (539,718 occupied: 223,937 owner occupied, 315,781 renter occupied)
| % of renters here: | 59% |
| State: | 38% |
Housing density: 1,717 houses/condos per square mile
Median price asked for vacant for-sale houses and condos in 2022: $426,591.
Median contract rent in 2022: $1,208 (lower quartile is $934, upper quartile is $1,624)
Median rent asked for vacant for-rent units in 2022: $1,350
Median gross rent in Dallas, TX in 2022: $1,360
Housing units in Dallas with a mortgage: 120,763 (6,257 second mortgage, 335 home equity loan, 4,264 both second mortgage and home equity loan)
Houses without a mortgage: 1,534
Median household income for houses/condos with a mortgage: $128,668
Median household income for apartments without a mortgage: $65,972
Median monthly housing costs: $1,364
Compare current foreclosures in Dallas, TX:
| Photo | Address | Area | Beds / Baths | Price | Details |
|---|---|---|---|---|---|

|
#1
Leaning Oaks St
Dallas, TX 75241
|
963 sq. feet
|
1 baths 3 beds |
$149,900
|
show details |

|
#2
Melrose Ave
Dallas, TX 75206
|
2,906 sq. feet
|
4 baths 4 beds |
show details | |

|
#3
Shelby Ave
Dallas, TX 75219
|
1,964 sq. feet
|
2 baths 2 beds |
show details | |

|
#4
Ponder Dr
Dallas, TX 75229
|
2,254 sq. feet
|
2 baths 3 beds |
show details | |

|
#5
Mountain Cedar Ln
Dallas, TX 75236
|
1,424 sq. feet
|
2 baths 3 beds |
show details | |

|
#6
Leahy Dr
Dallas, TX 75229
|
2,231 sq. feet
|
3 baths 5 beds |
show details | |

|
#7
Jadewood Dr
Dallas, TX 75232
|
946 sq. feet
|
1 baths 3 beds |
show details | |

|
#8
Southwestern Blvd
Dallas, TX 75225
|
7,329 sq. feet
|
6 baths 5 beds |
show details | |

|
#9
Alaska Ave
Dallas, TX 75216
|
1,326 sq. feet
|
3 baths 3 beds |
show details | |

|
#10
Glen Cross Dr
Dallas, TX 75228
|
1,368 sq. feet
|
2 baths 3 beds |
show details |
| Photo | Address | Area | Beds / Baths | Price | Details |
|---|---|---|---|---|---|

|
#11
Rylie Crest Dr
Dallas, TX 75217
|
1,104 sq. feet
|
1 baths 3 beds |
show details | |

|
#12
Wrangler Way
Dallas, TX 75253
|
- sq. feet
|
2 baths 3 beds |
show details | |

|
#13
Leland College Dr
Dallas, TX 75241
|
1,037 sq. feet
|
1 baths 3 beds |
show details | |

|
#14
& 415 Graham Avenue
Dallas, TX 75223
|
- sq. feet
|
2 baths 2 beds |
show details | |

|
#15
Desdemona Dr
Dallas, TX 75228
|
981 sq. feet
|
1 baths 2 beds |
show details | |

|
#16
Cricket Dr
Dallas, TX 75217
|
1,343 sq. feet
|
2 baths 3 beds |
show details | |

|
#17
Little Canyon Rd
Dallas, TX 75249
|
1,960 sq. feet
|
2 baths 4 beds |
show details | |

|
#18
N Masters Dr
Dallas, TX 75227
|
1,362 sq. feet
|
2 baths 4 beds |
show details | |

|
#19
Las Villas Ave
Dallas, TX 75211
|
1,561 sq. feet
|
2 baths 4 beds |
show details | |

|
#20
N Farola Dr
Dallas, TX 75228
|
1,103 sq. feet
|
2 baths 3 beds |
show details |
| Photo | Address | Area | Beds / Baths | Price | Details |
|---|---|---|---|---|---|

|
#21
Skyview Dr
Dallas, TX 75228
|
1,377 sq. feet
|
2 baths 3 beds |
show details | |

|
#22
Peoria St
Dallas, TX 75212
|
1,393 sq. feet
|
2 baths 3 beds |
show details | |

|
#23
Bondstone Dr
Dallas, TX 75218
|
1,825 sq. feet
|
2 baths 4 beds |
show details | |

|
#24
Slay St
Dallas, TX 75217
|
864 sq. feet
|
1 baths 2 beds |
show details | |

|
#25
Kostner Ave
Dallas, TX 75216
|
2,116 sq. feet
|
2 baths 4 beds |
show details | |

|
#26
Philip Ave
Dallas, TX 75223
|
1,500 sq. feet
|
2 baths 4 beds |
show details | |

|
#27
Elsie Faye Heggins Street
Dallas, TX 75210
|
1,945 sq. feet
|
3 baths 5 beds |
show details | |

|
#28
Romanway Dr
Dallas, TX 75249
|
2,270 sq. feet
|
2 baths 4 beds |
show details | |

|
#29
Ryanridge Dr
Dallas, TX 75232
|
1,316 sq. feet
|
2 baths 3 beds |
show details | |

|
#30
Lost Canyon Dr
Dallas, TX 75249
|
1,760 sq. feet
|
3 baths 3 beds |
show details |
| Photo | Address | Area | Beds / Baths | Price | Details |
|---|---|---|---|---|---|

|
#31
Highgrove Dr
Dallas, TX 75220
|
1,586 sq. feet
|
2 baths 3 beds |
show details | |

|
#32
Barrel Drive
Dallas, TX 75253
|
1,315 sq. feet
|
2 baths 3 beds |
show details | |

|
#33
Glen Cross Dr
Dallas, TX 75228
|
1,784 sq. feet
|
1 baths 3 beds |
show details | |

|
#34
Fisher Rd
Dallas, TX 75214
|
5,009 sq. feet
|
5 baths 4 beds |
show details | |

|
#35
Channel Dr
Dallas, TX 75229
|
1,305 sq. feet
|
2 baths 3 beds |
show details | |

|
#36
Marfa Ave
Dallas, TX 75216
|
1,248 sq. feet
|
2 baths 4 beds |
show details | |

|
#37
Meandering Way Apt 2103
Dallas, TX 75252
|
1,193 sq. feet
|
2 baths 2 beds |
show details | |

|
#38
Oak Forest Dr
Dallas, TX 75232
|
1,728 sq. feet
|
2 baths 3 beds |
show details | |

|
#39
S Montclair Ave
Dallas, TX 75208
|
1,762 sq. feet
|
2 baths 3 beds |
show details | |

|
#40
Emrose Ter
Dallas, TX 75227
|
1,652 sq. feet
|
2 baths 3 beds |
show details |
| Photo | Address | Area | Beds / Baths | Price | Details |
|---|---|---|---|---|---|

|
#41
Saint Nicholas Dr
Dallas, TX 75233
|
1,081 sq. feet
|
2 baths 3 beds |
show details | |

|
#42
Preston Haven Dr
Dallas, TX 75229
|
2,157 sq. feet
|
2 baths 3 beds |
show details | |

|
#43
Carpenter Ave
Dallas, TX 75215
|
1,163 sq. feet
|
1 baths 3 beds |
show details | |

|
#44
Orbiter Cir
Dallas, TX 75243
|
1,965 sq. feet
|
2 baths 3 beds |
show details | |

|
#45
Whistler Dr
Dallas, TX 75217
|
1,621 sq. feet
|
2 baths 3 beds |
show details | |

|
#46
N Edgefield Ave
Dallas, TX 75208
|
1,086 sq. feet
|
1 baths 2 beds |
show details | |

|
#47
Erikaglen Dr
Dallas, TX 75241
|
1,620 sq. feet
|
2 baths 3 beds |
show details | |

|
#48
Pennsylvania Ave
Dallas, TX 75215
|
980 sq. feet
|
1 baths 2 beds |
show details | |

|
#49
Santa Cruz Dr
Dallas, TX 75227
|
1,820 sq. feet
|
1 baths 3 beds |
show details | |

|
Check over 1 million property listings on Foreclosure.com!
|
browse all offers | |||

Latest news about housing in Dallas, TX collected exclusively by city-data.com from local newspapers, TV, and radio stations


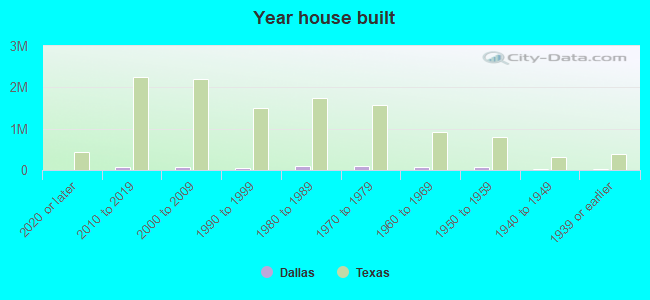
Median year apartment built: 1986
Household type by relationship:
Households: 1,299,553- Male householders: 261,707 (98,201 living alone), Female householders: 278,011 (105,627 living alone)
182,710 spouses (176,812 opposite-sex spouses), 43,254 unmarried partners, (39,261 opposite-sex unmarried partners), 371,403 children (355,853 natural, 3,292 adopted, 12,258 stepchildren), 40,516 grandchildren, 19,620 brothers or sisters, 20,960 parents, 1,153 foster children, 28,273 other relatives, 38,610 non-relatives
- In group quarters: 13,336
Size of family households: 116,633 2-persons, 68,650 3-persons, 52,185 4-persons, 30,419 5-persons, 12,312 6-persons, 8,385 7-or-more-persons.
Size of nonfamily households: 203,828 1-person, 41,987 2-persons, 4,156 3-persons, 929 4-persons, 234 5-persons.
157,264 married couples with children.
105,883 single-parent households (21,422 men, 84,461 women).
57.4% of residents of Dallas speak English at home.
36.3% of residents speak Spanish at home (54% speak English very well, 18% speak English well, 17% speak English not well, 11% don't speak English at all).
2.4% of residents speak other Indo-European language at home (77% speak English very well, 14% speak English well, 8% speak English not well, 1% don't speak English at all).
1.9% of residents speak Asian or Pacific Island language at home (63% speak English very well, 25% speak English well, 11% speak English not well, 1% don't speak English at all).
2.0% of residents speak other language at home (77% speak English very well, 15% speak English well, 7% speak English not well, 2% don't speak English at all).
Foreign born population: 310,058 (23.9%)
(33.0% of them are naturalized citizens)
| Here: | 6.2 |
| State: | 6.3 |
| Here: | 3.6 |
| State: | 4.0 |
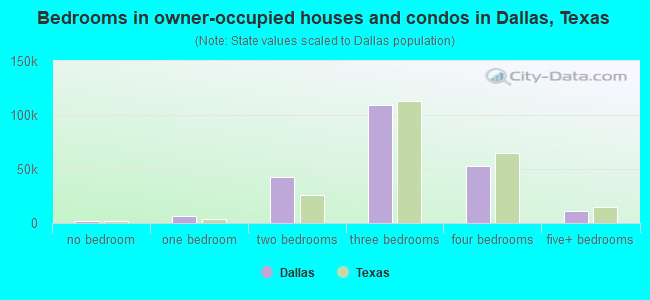
- Bedrooms in owner-occupied houses and condos in Dallas, Texas
- 2,126no bedroom
- 6,2801 bedroom
- 42,4282 bedrooms
- 109,1023 bedrooms
- 52,8884 bedrooms
- 11,1135+ bedrooms

- Bedrooms in renter-occupied apartments in Dallas, Texas
- 31,089no bedroom
- 129,8851 bedroom
- 109,6932 bedrooms
- 38,5493 bedrooms
- 5,5024 bedrooms
- 1,0635+ bedrooms
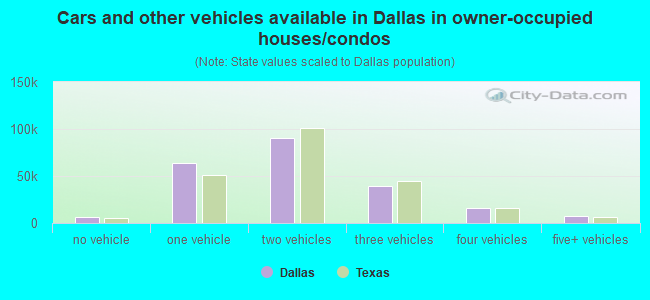
- Cars and other vehicles available in Dallas in owner-occupied houses/condos
- 6,151no vehicle
- 63,8901 vehicle
- 90,8102 vehicles
- 39,7073 vehicles
- 16,3074 vehicles
- 7,0725+ vehicles
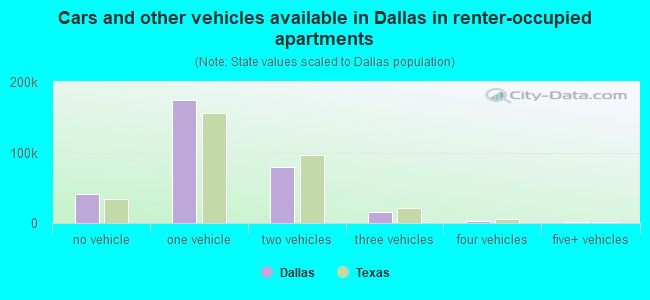
- Cars and other vehicles available in Dallas in renter-occupied apartments
- 41,659no vehicle
- 174,5231 vehicle
- 79,3732 vehicles
- 15,7833 vehicles
- 2,4254 vehicles
- 2,0185+ vehicles
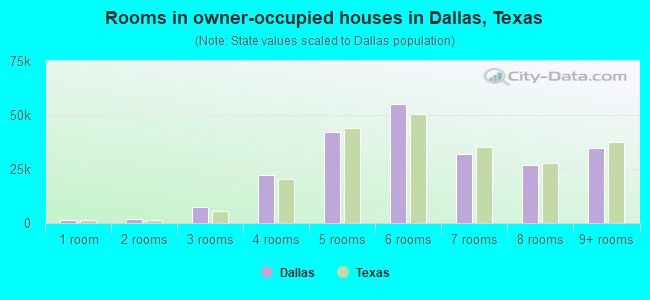
- Rooms in owner-occupied houses in Dallas, Texas
- 1,4531 room
- 1,6712 rooms
- 7,5743 rooms
- 22,4514 rooms
- 42,1735 rooms
- 54,9216 rooms
- 32,1747 rooms
- 26,9338 rooms
- 34,5879+ rooms
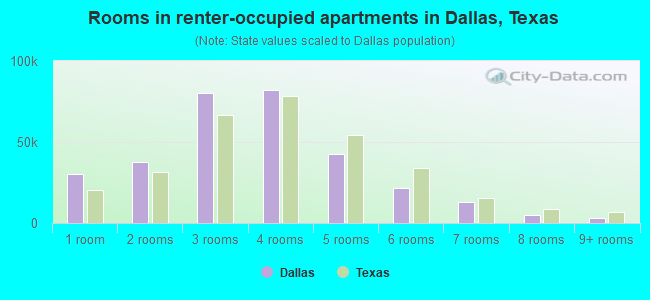
- Rooms in renter-occupied apartments in Dallas, Texas
- 29,9581 room
- 37,8842 rooms
- 80,4183 rooms
- 82,3794 rooms
- 42,3205 rooms
- 21,7796 rooms
- 12,9887 rooms
- 5,0958 rooms
- 2,9609+ rooms
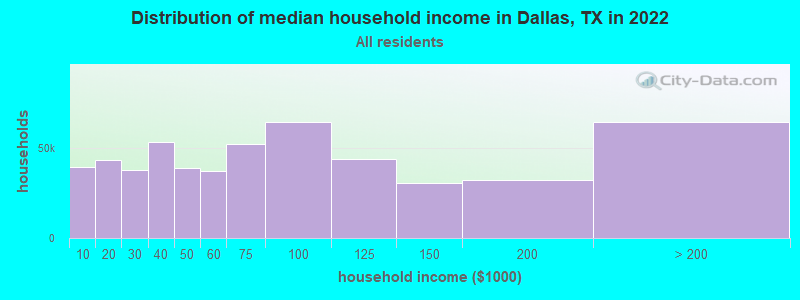
Dallas, TX household income distribution

- 39,553Less than $10,000
- 43,634$10,000 to $19,999
- 37,739$20,000 to $29,999
- 53,306$30,000 to $39,999
- 39,270$40,000 to $49,999
- 37,392$50,000 to $59,999
- 52,644$60,000 to $74,999
- 64,458$75,000 to $99,999
- 44,159$100,000 to $124,999
- 30,554$125,000 to $149,999
- 32,383$150,000 to $199,999
- 64,626$200,000 or more
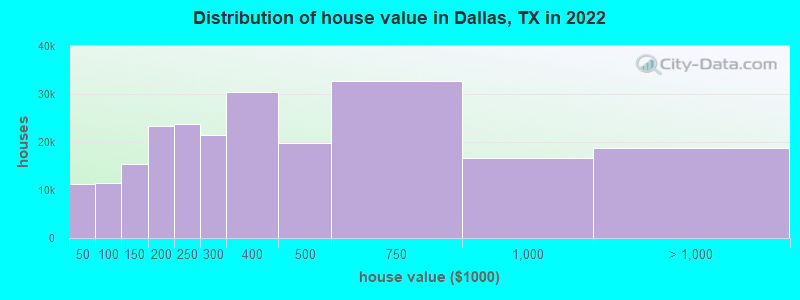
Home value of owner - occupied houses in 2022 in Dallas, TX
-
- 2,758Less than $10,000
- 2,176$10,000 to $14,999
- 1,200$15,000 to $19,999
- 1,311$20,000 to $24,999
- 1,122$25,000 to $29,999
- 1,456$30,000 to $34,999
- 449$35,000 to $39,999
- 867$40,000 to $49,999
- 1,414$50,000 to $59,999
- 1,791$60,000 to $69,999
- 2,062$70,000 to $79,999
- 3,021$80,000 to $89,999
- 2,201$90,000 to $99,999
- 9,076$100,000 to $124,999
- 6,276$125,000 to $149,999
- 13,390$150,000 to $174,999
- 9,868$175,000 to $199,999
- 23,844$200,000 to $249,999
- 21,489$250,000 to $299,999
- 30,353$300,000 to $399,999
- 19,747$400,000 to $499,999
- 32,622$500,000 to $749,999
- 16,718$750,000 to $999,999
- 8,643$1,000,000 to $1,499,999
- 5,125$1,500,000 to $1,999,999
- 4,958$2,000,000 or more
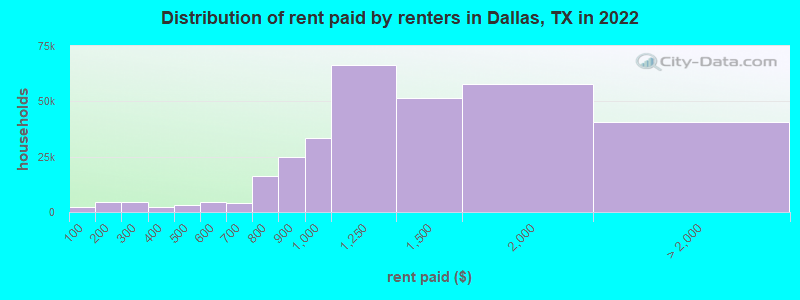
Rent paid by renters in 2022 in Dallas, TX
-
- 2,071Less than $100
- 2,422$100 to $149
- 2,263$150 to $199
- 1,732$200 to $249
- 2,920$250 to $299
- 1,330$300 to $349
- 744$350 to $399
- 1,134$400 to $449
- 1,830$450 to $499
- 2,488$500 to $549
- 1,840$550 to $599
- 2,294$600 to $649
- 1,696$650 to $699
- 5,699$700 to $749
- 10,767$750 to $799
- 24,871$800 to $899
- 33,208$900 to $999
- 66,329$1,000 to $1,249
- 51,647$1,250 to $1,499
- 58,001$1,500 to $1,999
- 18,807$2,000 to $2,499
- 6,907$2,500 to $2,999
- 3,663$3,000 to $3,499
- 4,420$3,500 or more
- 6,698No cash rent

Percentage of workers working in this county: 85.6%
Number of people working at home: 110,249 (16.4% of all workers)

Travel time to work (commute)
- Less than 5 minutes: 11,656
- 5 to 9 minutes: 39,684
- 10 to 14 minutes: 77,618
- 15 to 19 minutes: 95,064
- 20 to 24 minutes: 90,673
- 25 to 29 minutes: 47,351
- 30 to 34 minutes: 90,425
- 35 to 39 minutes: 14,561
- 40 to 44 minutes: 19,778
- 45 to 59 minutes: 37,659
- 60 to 89 minutes: 29,604
- 90 or more minutes: 8,398

Means of transportation to work:
- Drove a car alone: 690,143 (73.8%)
- Carpooled: 89,454 (9.6%)
- Bus: 8,777 (0.9%)
- Subway or elevated rail: 1,276 (0.1%)
- Long-distance train or commuter rail: 229 (0.0%)
- Light rail, streetcar or trolley: 3,919 (0.4%)
- Ferryboat: 63 (0.0%)
- Taxi: 14,390 (1.5%)
- Bicycle: 2,054 (0.2%)
- Walked: 14,030 (1.5%)
- Worked at home: 110,249 (11.8%)
- Unemployment by race in 2022
- Unemployment rate for White non-Hispanic residents
- 3.6%Males
- 2.6%Females
- Unemployment rate for Black residents
- 9.6%Males
- 6.7%Females
- Unemployment rate for American Indian and Alaska Native residents
- 5.4%Males
- 2.0%Females
- Unemployment rate for Asian residents
- 3.5%Males
- 6.0%Females
- Unemployment rate for other race residents
- 2.7%Males
- 2.8%Females
- Unemployment rate for two or more race residents
- 1.8%Males
- 2.8%Females
- Unemployment rate for Hispanic or Latino residents
- 2.6%Males
- 2.7%Females
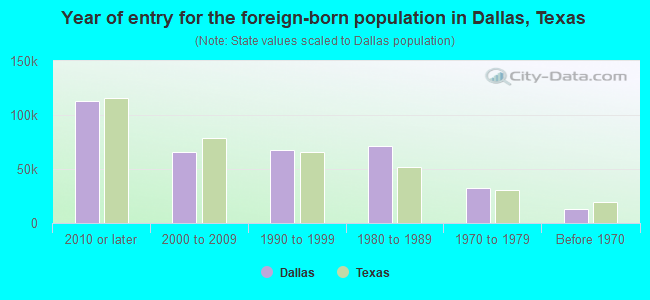
- Year of entry for the foreign-born population in Dallas, Texas
- 112,8322010 or later
- 65,4402000 to 2009
- 67,9751990 to 1999
- 70,8581980 to 1989
- 32,2271970 to 1979
- 13,000Before 1970
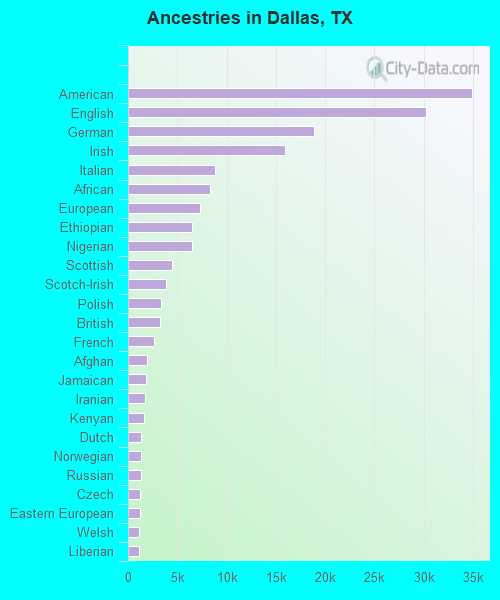
First ancestries reported:
- American: 34,892 (4.0%)
- English: 30,221 (3.5%)
- German: 18,881 (2.2%)
- Irish: 15,916 (1.8%)
- Italian: 8,841 (1.0%)
- African: 8,358 (1.0%)
- European: 7,320 (0.8%)
- Ethiopian: 6,524 (0.8%)
- Nigerian: 6,469 (0.7%)
- Scottish: 4,437 (0.5%)
- Scotch-Irish: 3,818 (0.4%)
- Polish: 3,299 (0.4%)
- British: 3,214 (0.4%)
- French: 2,641 (0.3%)
- Afghan: 1,910 (0.2%)
- Jamaican: 1,836 (0.2%)
- Iranian: 1,710 (0.2%)
- Kenyan: 1,575 (0.2%)
- Dutch: 1,370 (0.2%)
- Norwegian: 1,348 (0.2%)
- Russian: 1,302 (0.1%)
- Czech: 1,215 (0.1%)
- Eastern European: 1,183 (0.1%)
- Welsh: 1,154 (0.1%)
- Liberian: 1,127 (0.1%)
- French Canadian: 1,031 (0.1%)
- Northern European: 981 (0.1%)
- Brazilian: 943 (0.1%)
- Lebanese: 883 (0.1%)
- Swedish: 805 (0.09%)
- Portuguese: 735 (0.08%)
- Turkish: 688 (0.08%)
- Ghanaian: 615 (0.07%)
- Greek: 608 (0.07%)
- Romanian: 585 (0.07%)
- Ukrainian: 571 (0.07%)
- Egyptian: 509 (0.06%)
- Albanian: 498 (0.06%)
- Haitian: 412 (0.05%)
- U.S. Virgin Islander: 398 (0.05%)
- South African: 390 (0.04%)
- Israeli: 389 (0.04%)
- Hungarian: 366 (0.04%)
- West Indian: 358 (0.04%)
- Armenian: 353 (0.04%)
- Arab: 351 (0.04%)
- Canadian: 326 (0.04%)
- Scandinavian: 320 (0.04%)
- Somali: 320 (0.04%)
- Lithuanian: 283 (0.03%)
- Cajun: 265 (0.03%)
- Serbian: 253 (0.03%)
- Slovene: 244 (0.03%)
- Australian: 235 (0.03%)
- Belgian: 220 (0.03%)
- Danish: 200 (0.02%)
- Czechoslovakian: 189 (0.02%)
- Basque: 178 (0.02%)
- Swiss: 178 (0.02%)
- Austrian: 165 (0.02%)
- Guyanese: 157 (0.02%)
- Moroccan: 156 (0.02%)
- Belizean: 155 (0.02%)
- Ugandan: 153 (0.02%)
- Trinidadian and Tobagonian: 153 (0.02%)
- Zimbabwean: 152 (0.02%)
- Finnish: 147 (0.02%)
- Jordanian: 137 (0.02%)
- Palestinian: 136 (0.02%)
- Bulgarian: 133 (0.02%)
- Iraqi: 125 (0.01%)
- Yugoslavian: 118 (0.01%)
- British West Indian: 114 (0.01%)
- Slovak: 106 (0.01%)
- Sierra Leonean: 98 (0.01%)
- Icelander: 89 (0.01%)
- Barbadian: 86 (0.01%)
- Syrian: 86 (0.01%)
- Senegalese: 75 (0.01%)
- Sudanese: 67 (0.01%)
- Celtic: 62 (0.01%)
Most common places of birth for foreign-born residents (%):
| Dallas: | 54.5% (174,612) |
| Texas: | 48.4% (2,411,723) |
| Dallas: | 5.8% (18,714) |
| Texas: | 4.5% (224,455) |
| Dallas: | 5.0% (16,156) |
| Texas: | 3.0% (147,182) |
| Dallas: | 2.9% (9,215) |
| Texas: | 6.1% (306,347) |
| Dallas: | 2.6% (8,281) |
| Texas: | 1.8% (87,382) |
| Dallas: | 2.4% (7,724) |
| Texas: | 1.5% (72,413) |
| Dallas: | 2.1% (6,764) |
| Texas: | 1.9% (96,110) |
Place of birth for U.S.-born residents:
- This state: 686,144
- Other state: 286,383
- Northeast: 32,683
- Midwest: 79,673
- South: 110,200
- West: 63,827
84.2% of Dallas residents lived in the same house 1 years ago.
Out of people who lived in different houses, 38.0% lived in this county.
Out of people who lived in different counties, 55.2% lived in Texas.
| Dallas: | 84.2% |
| State average: | 85.7% |
Education attainment for males 25 years and older:
- No schooling: 15,831
- Nursery to 4th grade: 7,344
- 5th and 6th grade: 16,758
- 7th and 8th grade: 6,631
- 9th grade: 12,221
- 10th grade: 7,054
- 11th grade: 7,823
- 12th grade, no diploma: 9,963
- High school graduate (or equivalency): 89,695
- Less than 1 year of college: 19,653
- Some college more than 1 year, no degree: 44,969
- Associate degree: 19,860
- Bachelor's degree: 97,944
- Master's degree: 39,410
- Professional school degree: 16,960
- Doctorate degree: 7,687

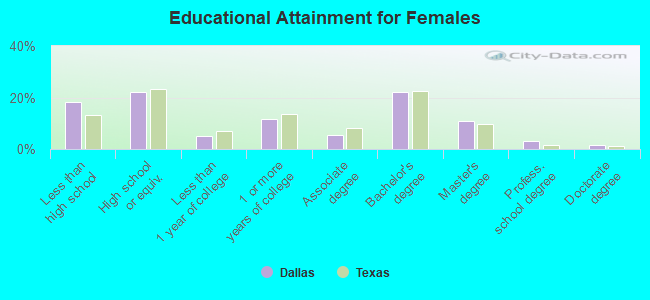
Education attainment for females 25 years and older:
- No schooling: 14,920
- Nursery to 4th grade: 8,822
- 5th and 6th grade: 13,027
- 7th and 8th grade: 6,359
- 9th grade: 12,133
- 10th grade: 7,090
- 11th grade: 8,131
- 12th grade, no diploma: 8,496
- High school graduate (or equivalency): 95,703
- Less than 1 year of college: 22,421
- Some college more than 1 year, no degree: 50,114
- Associate degree: 24,390
- Bachelor's degree: 97,132
- Master's degree: 46,601
- Professional school degree: 13,813
- Doctorate degree: 6,508
Housing units in structures:
- One, detached: 238,534
- One, attached: 21,046
- Two: 8,398
- 3 or 4: 30,712
- 5 to 9: 56,143
- 10 to 19: 61,125
- 20 to 49: 46,096
- 50 or more: 119,149
- Mobile homes: 6,717
- Boats, RVs, vans, etc.: 64
Median worth of mobile homes: $25,100
Housing units lacking complete kitchen facilities in 2022: 1.4%
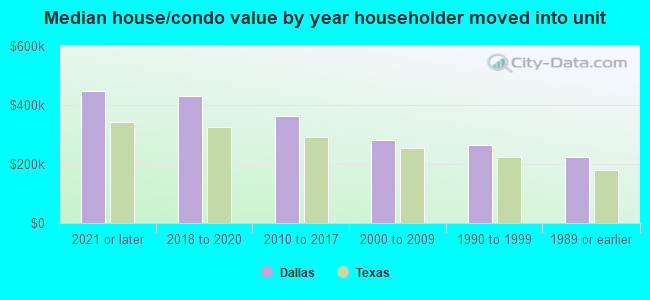
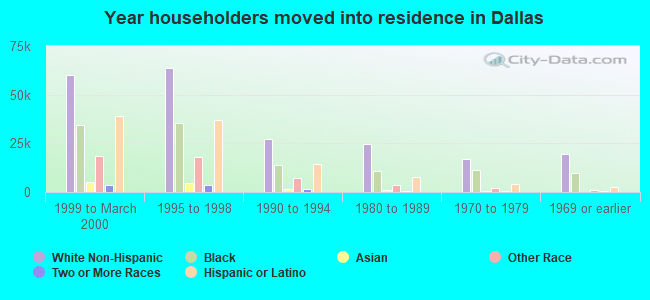
House/condo owner moved in on average 12 years ago
Renter moved in on average 2 years ago
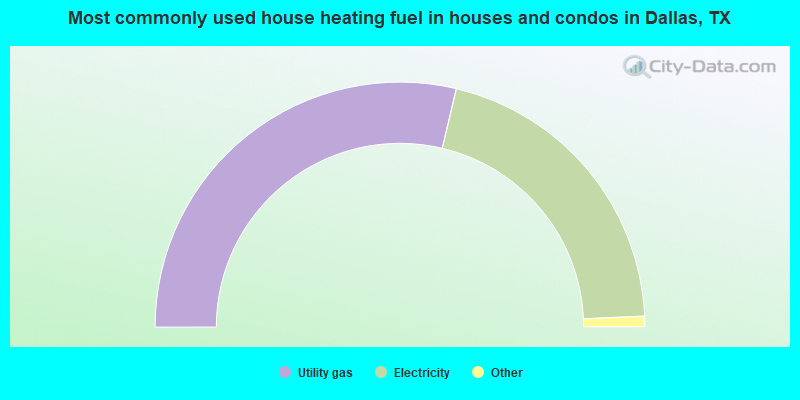
- 57.4%Utility gas
- 41.2%Electricity
- 0.8%Bottled, tank, or LP gas
- 0.3%No fuel used
- 0.1%Solar energy
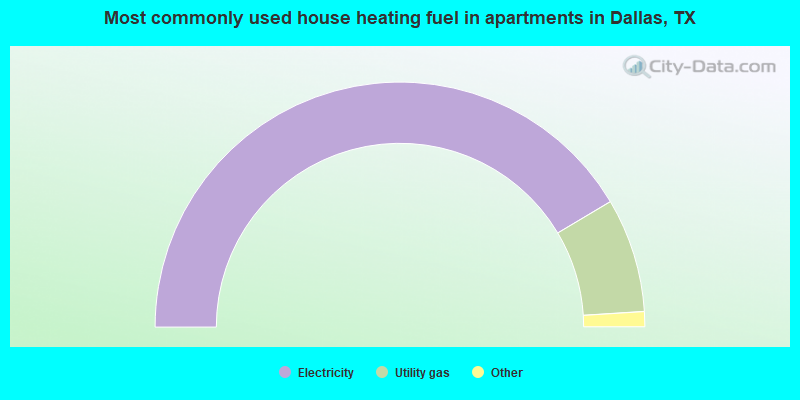
- 82.9%Electricity
- 15.1%Utility gas
- 1.0%No fuel used
- 0.7%Bottled, tank, or LP gas
- 0.1%Other fuel
- 0.1%Solar energy
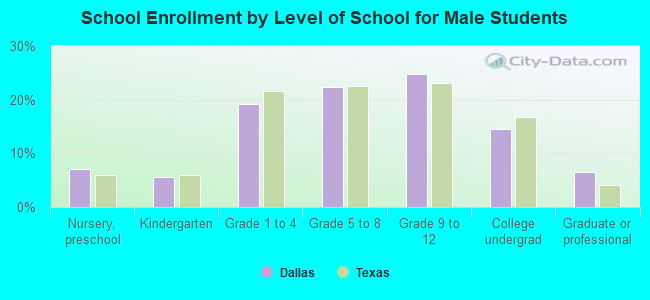
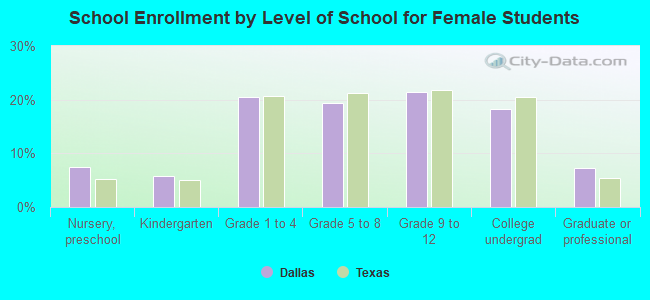
Private vs. public school enrollment:
| Here: | 10.2% |
| Texas: | 8.8% |
| Here: | 11.5% |
| Texas: | 8.0% |
| Here: | 24.4% |
| Texas: | 16.2% |